. 2017 Jul 12;18(7):1499.
doi: 10.3390/ijms18071499.

Entrainment of Breast Cell Lines Results in Rhythmic Fluctuations of MicroRNAs

Affiliations

Entrainment of Breast Cell Lines Results in Rhythmic Fluctuations of MicroRNAs

Rafael Chacolla-Huaringa et al. Int J Mol Sci. .

Abstract

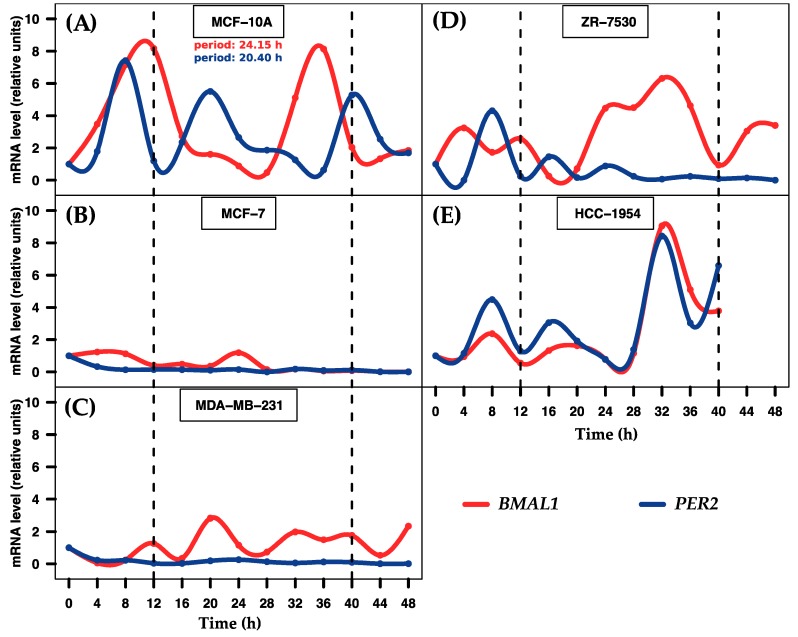
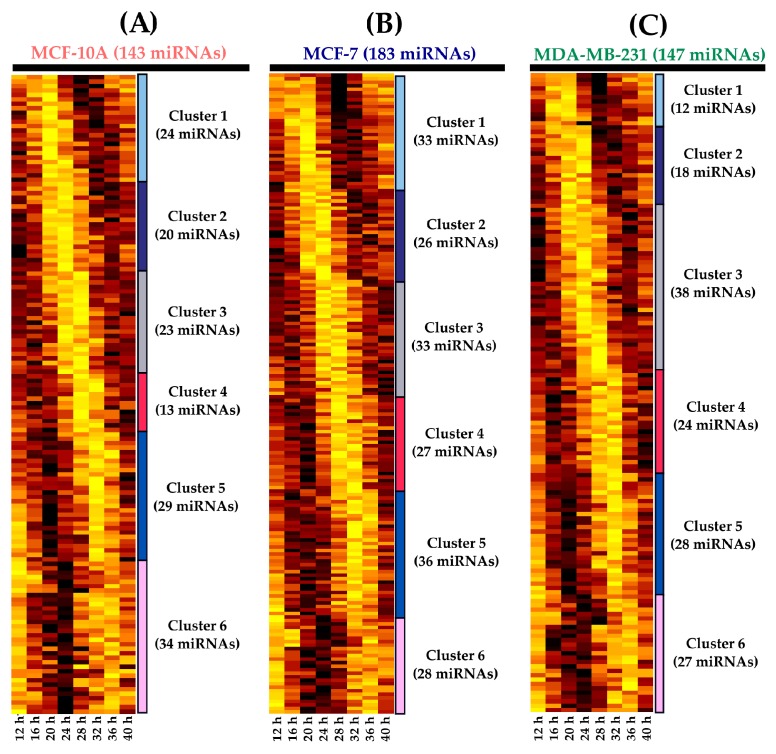
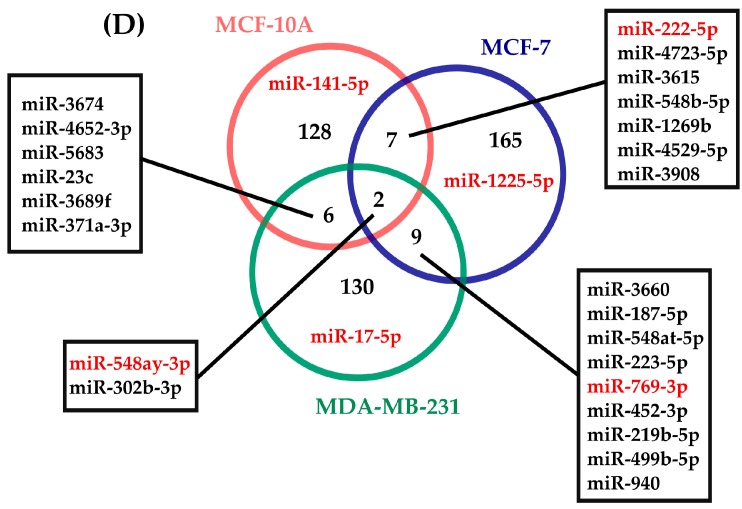
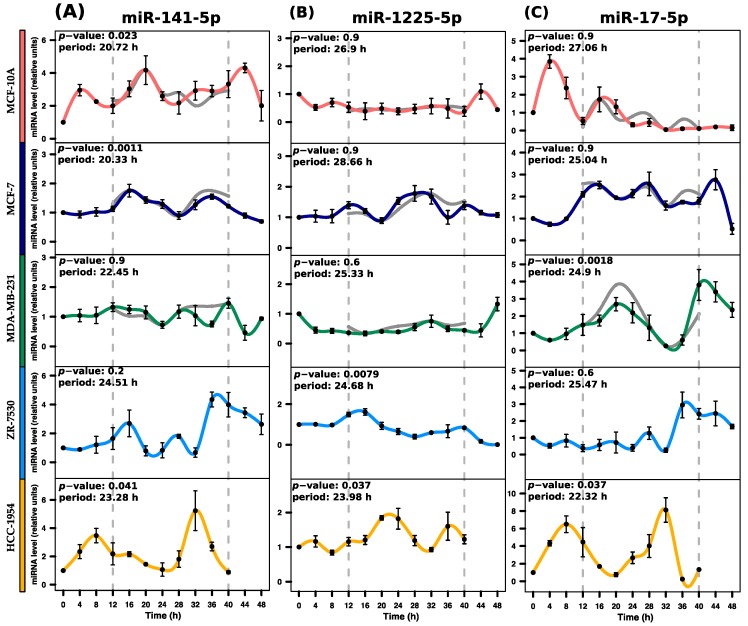
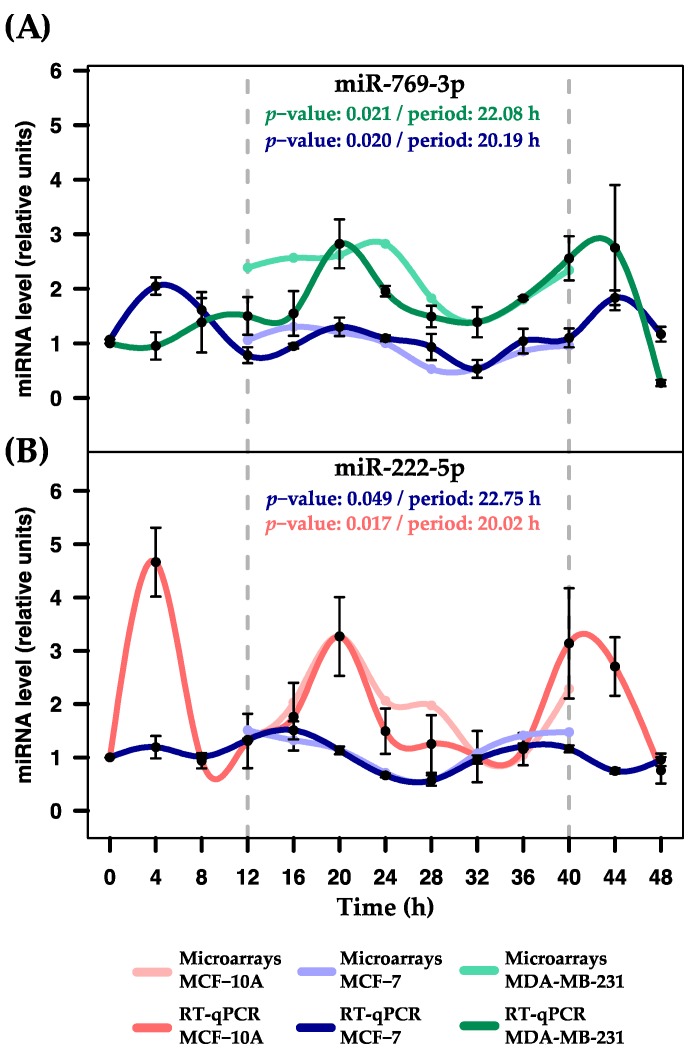
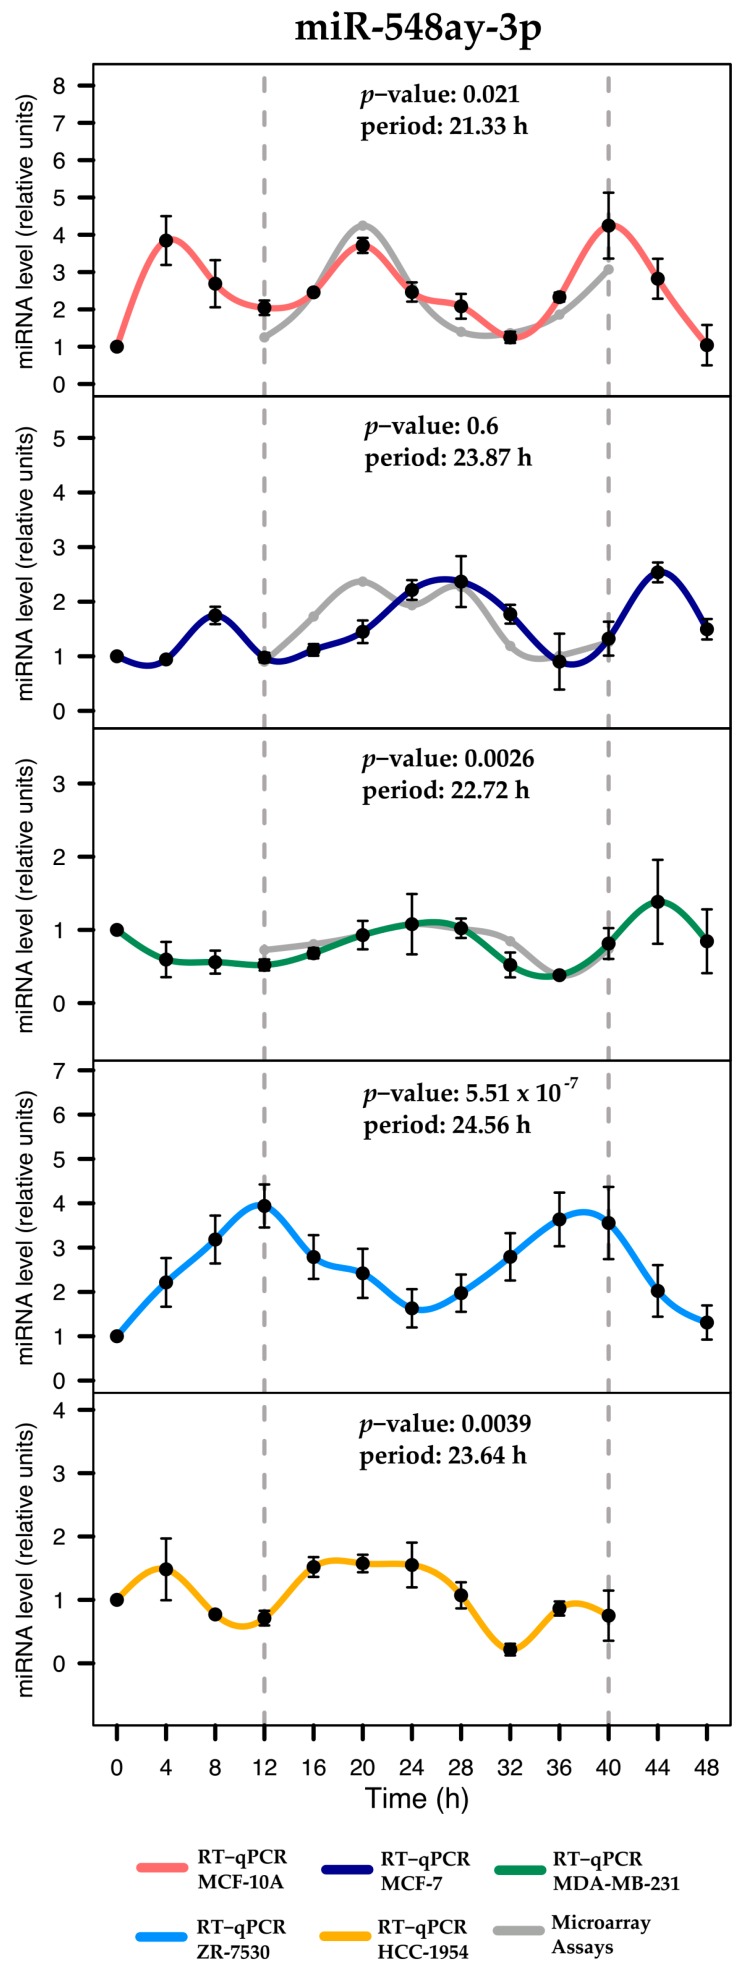
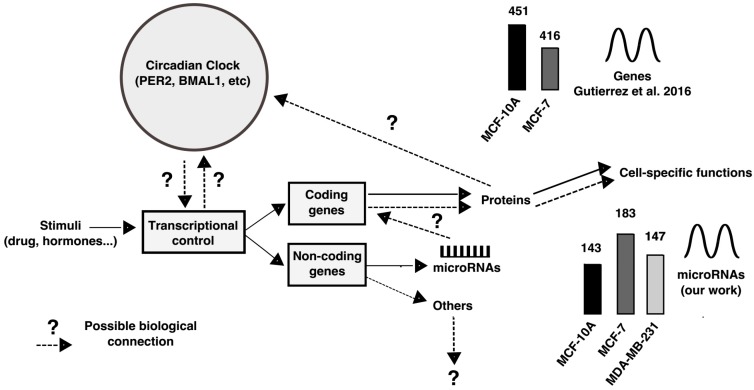
Circadian rhythms are essential for temporal (~24 h) regulation of molecular processes in diverse species. Dysregulation of circadian gene expression has been implicated in the pathogenesis of various disorders, including hypertension, diabetes, depression, and cancer. Recently, microRNAs (miRNAs) have been identified as critical modulators of gene expression post-transcriptionally, and perhaps involved in circadian clock architecture or their output functions. The aim of the present study is to explore the temporal expression of miRNAs among entrained breast cell lines. For this purpose, we evaluated the temporal (28 h) expression of 2006 miRNAs in MCF-10A, MCF-7, and MDA-MB-231 cells using microarrays after serum shock entrainment. We noted hundreds of miRNAs that exhibit rhythmic fluctuations in each breast cell line, and some of them across two or three cell lines. Afterwards, we validated the rhythmic profiles exhibited by miR-141-5p, miR-1225-5p, miR-17-5p, miR-222-5p, miR-769-3p, and miR-548ay-3p in the above cell lines, as well as in ZR-7530 and HCC-1954 using RT-qPCR. Our results show that serum shock entrainment in breast cells lines induces rhythmic fluctuations of distinct sets of miRNAs, which have the potential to be related to endogenous circadian clock, but extensive investigation is required to elucidate that connection.

Keywords: RT-qPCR; breast cancer; circadian rhythms; microarrays; rhythmic fluctuations microRNAs.


Conflict of interest statement

The authors declare no conflict of interest.

Figures

Figure 1
Figure 1
Temporal expression of BMAL1 and PER2 genes in five breast cell lines. The graph depicts the level of expression of two clock genes at 4 h intervals over 48 h after 2 h serum shock entrainment. (A) MCF-10A cells show rhythmic profiles of both genes; (BE) MCF-7, MDA-MB-231, ZR-7530 and HCC-1954 cells do not show rhythmic profiles. Dashed black lines at 12 and 40 h were added to show the period during which the profiles exhibited robustness. Data points (means of two biological replicates) were normalized using GAPDH relative to the first time point (t = 0) within each corresponding cell line.
Figure 2
Figure 2
Rhythmic expression of miRNAs identified in three breast cell lines. The heat maps depict the expression level of miRNAs over 28 h (hours 12–40 of the 48 h study) in (A) MCF-10A; (B) MCF-7; and (C) MDA-MB-231 cells. In addition, the heat maps show 6 different clusters of miRNAs that depict marked phases. Brown colors represent higher expression values, while yellow colors represent lower expression values. Expression values are z-scaled relative to each cell line; (D) Venn diagram of 143, 183, and 147 miRNAs that were rhythmically expressed over 28 h in MCF-10A, MCF-7, and MDA-MB-231. The diagram also shows miRNAs that exhibited rhythmicity across cell lines and were selected for RT-qPCR validation (red).
Figure 2
Figure 2
Rhythmic expression of miRNAs identified in three breast cell lines. The heat maps depict the expression level of miRNAs over 28 h (hours 12–40 of the 48 h study) in (A) MCF-10A; (B) MCF-7; and (C) MDA-MB-231 cells. In addition, the heat maps show 6 different clusters of miRNAs that depict marked phases. Brown colors represent higher expression values, while yellow colors represent lower expression values. Expression values are z-scaled relative to each cell line; (D) Venn diagram of 143, 183, and 147 miRNAs that were rhythmically expressed over 28 h in MCF-10A, MCF-7, and MDA-MB-231. The diagram also shows miRNAs that exhibited rhythmicity across cell lines and were selected for RT-qPCR validation (red).
Figure 3
Figure 3
Expression profiles of miR-141-5p, miR-1225-5p, and miR-17-5p across breast cell lines as determined by RT-qPCR. Their rhythmic expression was evaluated by RT-qPCR in serum-shocked MCF-10A, MCF-7, MDA-MB-231, ZR-7530, and HCC-1954 cells over 48 h (4 h intervals). (A) miR-141-5p exhibits rhythmic profiles in MCF-10A, MCF-7 and HCC-1954 cells; (B) miR-1225-5p exhibits rhythmic profiles in ZR-7530 and HCC-1954 cells; (C) miR-17-5p exhibits rhythmic profiles in MDA-MB-231 and HCC-1954 cells. Data points (means of three biological replicates ± standard error of the mean (SEM)) were normalized using miR-106a-5p relative to the first time point (t = 0). The p-value and period values of rhythmic profiles were obtained from the MetaCycle analysis and are illustrated at the top of each plot. Expression profiles with p-values less than 0.05 were considered rhythmic. For comparison purposes, the gray lines in the graphs concerning MCF-10A, MCF-7, and MDA-MB-231 illustrate the expression profiles obtained from the microarray data, which were scaled to the expression profile obtained from RT-qPCR assays. Dashed gray lines at 12 h and 40 h were added to show the period in which profiles were measured by microarray.
Figure 4
Figure 4
Expression profiles of miR-769-3p and miR-222-5p in three breast cell lines. Rhythmic expression was evaluated using RT-qPCR in serum-shocked MCF-10A, MCF-7, and MDA-MB-231 cells over 48 h (4 h intervals). (A) Rhythmic profiles of miR-769-3p obtained from microarray and RT-qPCR assays in MCF-7 and MDA-MB-231 cells; (B) Rhythmic profiles of miR-222-5p obtained from microarray and RT-qPCR assays in MCF-10A and MCF-7 cells. Data points (means of three biological replicates ± SEM) were normalized using miR-106a-5p relative to the first time point (t = 0). The p-values and period values of rhythmic profiles were obtained from MetaCycle analysis and are illustrated at the top of each plot. Expression profiles with p-values less than 0.05 were considered rhythmic. For comparison purposes, the more lightly colored lines illustrate the expression profiles obtained from microarray assays, which were scaled to the expression profiles obtained from RT-qPCR assays. Dashed gray lines at 12 and 40 h were added to show the periods in which the profiles were measured by microarrays.
Figure 5
Figure 5
Expression profiles of miR-548ay-3p across breast cell lines. Rhythmic expression was evaluated using RT-qPCR in serum-shocked MCF-10A, MCF-7, MDA-MB-231, ZR-7530, and HCC-1954 cells over 48 h (4 h intervals). Data points (means of three biological replicates ± SEM) were normalized using miR-106a-5p relative to the first time point (t = 0). The p-values and period values of rhythmic profiles were obtained from MetaCycle analysis and are illustrated at the top of each plot. For comparison purposes, the gray line illustrates the expression profiles obtained from microarray assays, which were scaled to the expression profiles obtained from RT-qPCR assays. Dashed gray lines at 12 and 40 h were added to show the period in which the profiles were measured by microarrays.
Figure 6
Figure 6
Overview of circadian control and the insight of the rhythmic miRNAs in this system. Continuous lines between concepts represent known facts. Dashed lines represent unknown information. Particularly, derived from our study it is still unknown what could be the role of rhythmic miRNAs to specific cell function and to circadian control. Circadian control inspired in [47].

References

    1. Golombek D.A., Rosenstein R.E. Physiology of circadian entrainment. Physiol. Rev. 2010;90:1063–1102. doi: 10.1152/physrev.00009.2009. - DOI - PubMed
    1. Rana S., Mahmood S. Circadian rhythm and its role in malignancy. J. Circadian Rhythm. 2010;8:1–13. doi: 10.1186/1740-3391-8-3. - DOI - PMC - PubMed
    1. Garbarino-Pico E., Green C.B. Posttranscriptional regulation of mammalian circadian clock output. Cold Spring Harb. 2007;72:145–156. doi: 10.1101/sqb.2007.72.022. - DOI - PubMed
    1. Buhr E.D., Takahashi J.S. Molecular components of the Mammalian circadian clock. Handb. Exp. Pharmacol. 2013;15:3–27. doi: 10.1007/978-3-642-25950-0_1. - DOI - PMC - PubMed
    1. Bray M.S., Young M.E. Circadian rhythms in the development of obesity: Potential role for the circadian clock within the adipocyte. Obes. Rev. 2007;8:169–181. doi: 10.1111/j.1467-789X.2006.00277.x. - DOI - PubMed

MeSH terms