. 2017 Jul 14;10(1):278.
doi: 10.1186/s13104-017-2607-8.

NAP: The Network Analysis Profiler, a web tool for easier topological analysis and comparison of medium-scale biological networks

Affiliations

NAP: The Network Analysis Profiler, a web tool for easier topological analysis and comparison of medium-scale biological networks

Theodosios Theodosiou et al. BMC Res Notes. .

Abstract

Objective: Nowadays, due to the technological advances of high-throughput techniques, Systems Biology has seen a tremendous growth of data generation. With network analysis, looking at biological systems at a higher level in order to better understand a system, its topology and the relationships between its components is of a great importance. Gene expression, signal transduction, protein/chemical interactions, biomedical literature co-occurrences, are few of the examples captured in biological network representations where nodes represent certain bioentities and edges represent the connections between them. Today, many tools for network visualization and analysis are available. Nevertheless, most of them are standalone applications that often (i) burden users with computing and calculation time depending on the network's size and (ii) focus on handling, editing and exploring a network interactively. While such functionality is of great importance, limited efforts have been made towards the comparison of the topological analysis of multiple networks.

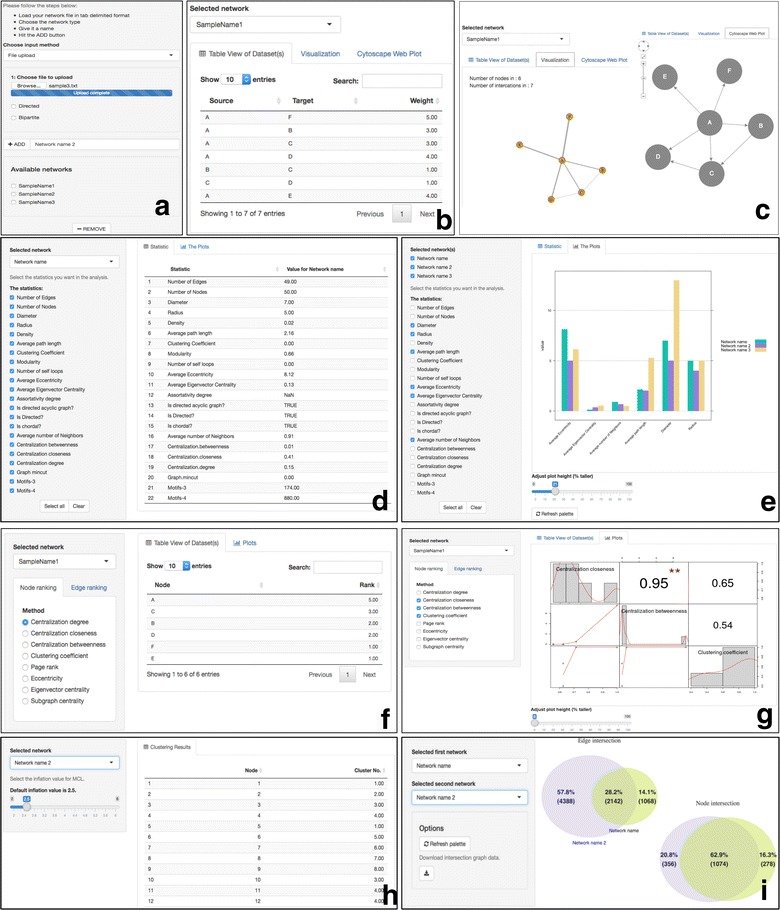
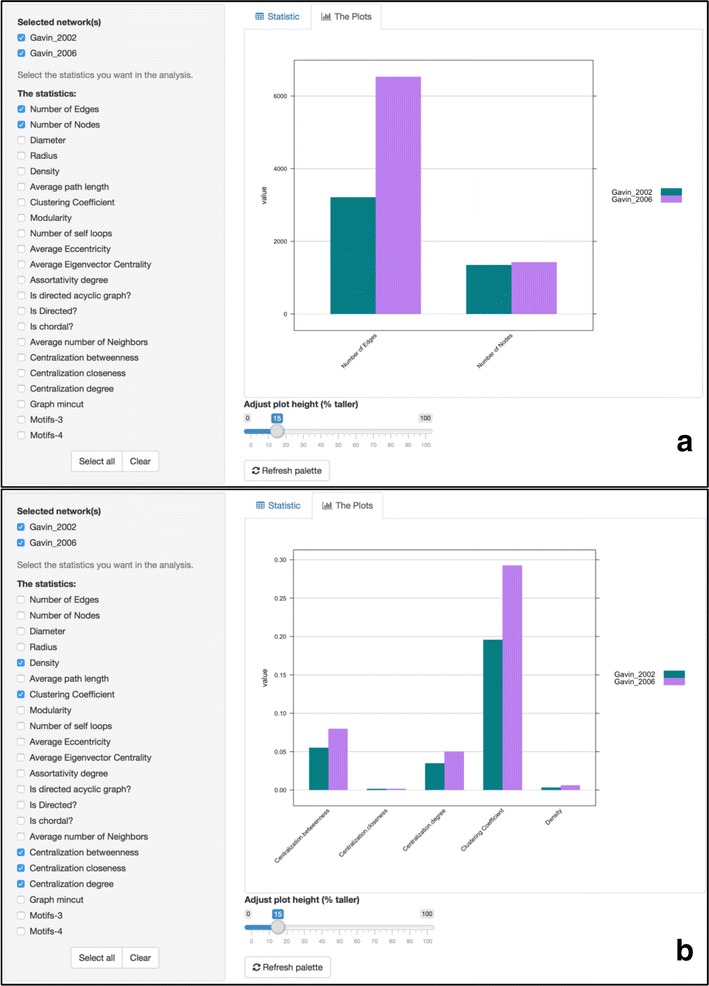
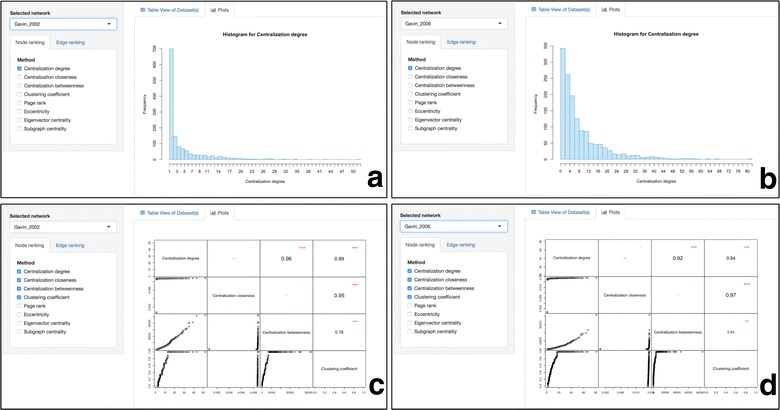
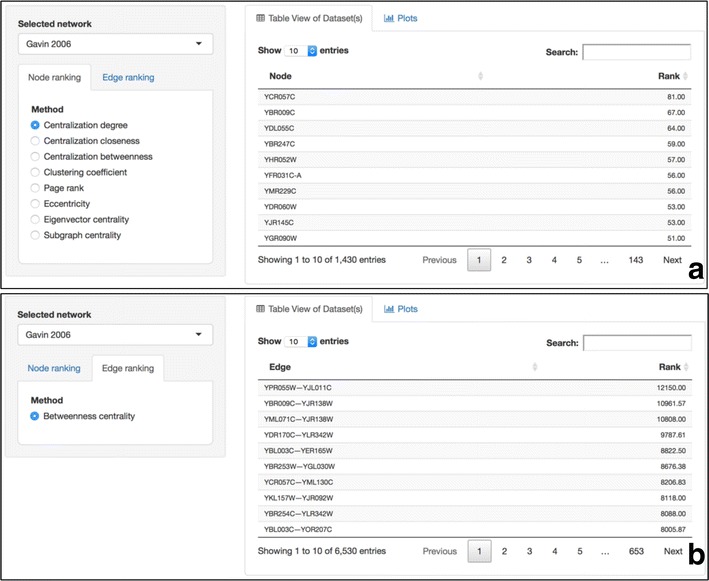
Results: Network Analysis Provider (NAP) is a comprehensive web tool to automate network profiling and intra/inter-network topology comparison. It is designed to bridge the gap between network analysis, statistics, graph theory and partially visualization in a user-friendly way. It is freely available and aims to become a very appealing tool for the broader community. It hosts a great plethora of topological analysis methods such as node and edge rankings. Few of its powerful characteristics are: its ability to enable easy profile comparisons across multiple networks, find their intersection and provide users with simplified, high quality plots of any of the offered topological characteristics against any other within the same network. It is written in R and Shiny, it is based on the igraph library and it is able to handle medium-scale weighted/unweighted, directed/undirected and bipartite graphs. NAP is available at http://bioinformatics.med.uoc.gr/NAP .

Keywords: Centralities; Network biology; Network comparison; Network topology; Node and edge ranking.


Figures

Fig. 1
Fig. 1
NAP’s web interface. a Users can upload several networks in the form of a list (pairwise connections) and subsequently name them. Users can also generate graphs of various sizes (50, 100, 1000, 10,000) based on the Barabási–Albert, Erdos–Renyi or Watts–Strogatz small-world model. Additionally, users can generate bipartite graphs of various sizes. b Network contents in the form of searchable and sortable tables. c-left Static network visualization. c-right Interactive Cytoscape.js network visualization. d Selection of topological features and their values. e Inter-network comparisons of topological features. f Node/edge ranking in the view of searchable tables. g Intra-network topological feature comparison in the form of a matrix. h Implementation of MCL clustering algorithm. i Intersection of any two chosen networks
Fig. 2
Fig. 2
Direct comparison of the topological features of two yeast protein–protein interaction datasets. a Gavin 2002 dataset [16] consists of 3210 edges and 1352 vertices, whereas Gavin 2006 [15] consists of 6531 edges and 1430 vertices. b Comparison of the networks’ clustering coefficient, density, closeness, betweenness and degree
Fig. 3
Fig. 3
Intra-network comparison of selected topological features within the Gavin 2002 yeast PPI dataset [16]. a The degree distribution for Gavin 2002 dataset. b The degree distribution for Gavin 2006 dataset. c An all-against-all distribution matrix comparing the degree, the closeness, the betweenness and the clustering coefficient for Gavin 2002 PPI network. d An all-against-all distribution matrix comparing the degree, the closeness, the betweenness and the clustering coefficient for Gavin 2006 PPI network
Fig. 4
Fig. 4
Node and edge ranking. a Proteins of the Gavin 2006 PPI datasets are sorted according to their degree. PWP2 (YCR057C) protein has many neighbors and might behave as hub. b Interactions of the Gavin 2006 PPI datasets are sorted according to their betweenness centrality. Edge between SEC8 (YPR055W) and RPC17 (YJL011C) behaves as a bridge between communities
Fig. 5
Fig. 5
NAP’s functionality to find the intersection between ant pair of selected networks. a Gavin 2006 and 2002 PPI datasets visualized by Cytoscape 3.4.0 using the Prefuse layout. b NAP’s generated Venn diagrams showing the overlapping nodes and edges of the two networks. c NAP’s intersection export function and visualization with Cytoscape

Similar articles

Cited by

References

    1. Koschutzki D, Schreiber F. Centrality analysis methods for biological networks and their application to gene regulatory networks. Gene Regul Syst Bio. 2008;2:193–201. - PMC - PubMed
    1. Yook SH, Oltvai ZN, Barabasi AL. Functional and topological characterization of protein interaction networks. Proteomics. 2004;4(4):928–942. doi: 10.1002/pmic.200300636. - DOI - PubMed
    1. Gehlenborg N, O’Donoghue SI, Baliga NS, Goesmann A, Hibbs MA, Kitano H, Kohlbacher O, Neuweger H, Schneider R, Tenenbaum D, et al. Visualization of omics data for systems biology. Nat Methods. 2010;7(3 Suppl):S56–S68. doi: 10.1038/nmeth.1436. - DOI - PubMed
    1. Pavlopoulos G, Iacucci E, iliopoulos I, Bagos P. Interpreting the omics ‘era’ data. In: Multimedia services in intelligent environments, vol. 25. New York: Springer International Publishing; 2013. p. 79–100.
    1. Pavlopoulos GA, Malliarakis D, Papanikolaou N, Theodosiou T, Enright AJ, Iliopoulos I. Visualizing genome and systems biology: technologies, tools, implementation techniques and trends, past, present and future. Gigascience. 2015;4:38. doi: 10.1186/s13742-015-0077-2. - DOI - PMC - PubMed