. 2017 Jul 14;16(1):286.
doi: 10.1186/s12936-017-1932-7.

Vector control with driving Y chromosomes: modelling the evolution of resistance

Affiliations

Vector control with driving Y chromosomes: modelling the evolution of resistance

Andrea Beaghton et al. Malar J. .

Abstract

Background: The introduction of new malaria control interventions has often led to the evolution of resistance, both of the parasite to new drugs and of the mosquito vector to new insecticides, compromising the efficacy of the interventions. Recent progress in molecular and population biology raises the possibility of new genetic-based interventions, and the potential for resistance to evolve against these should be considered. Here, population modelling is used to determine the main factors affecting the likelihood that resistance will evolve against a synthetic, nuclease-based driving Y chromosome that produces a male-biased sex ratio.

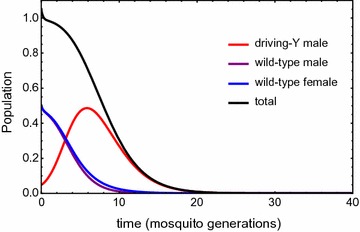
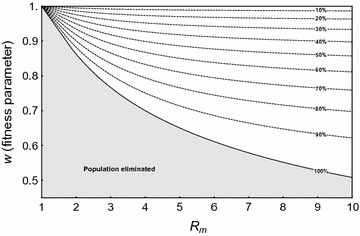
Methods: A combination of deterministic differential equation models and stochastic analyses involving branching processes and Gillespie simulations is utilized to assess the probability that resistance evolves against a driving Y that otherwise is strong enough to eliminate the target population. The model considers resistance due to changes at the target site such that they are no longer cleaved by the nuclease, and due to trans-acting autosomal suppressor alleles.

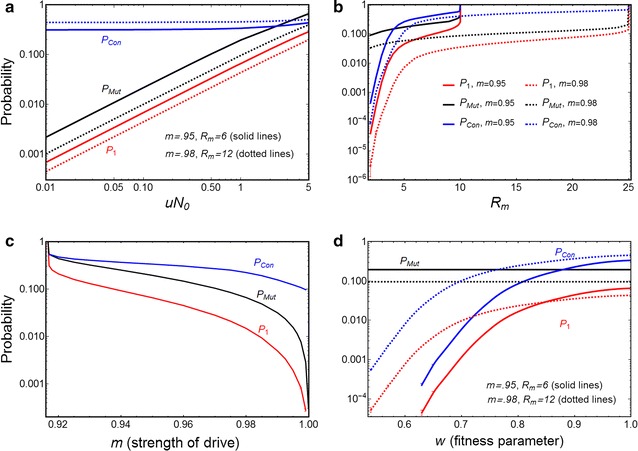
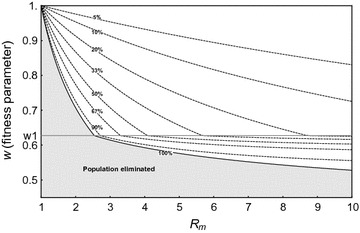
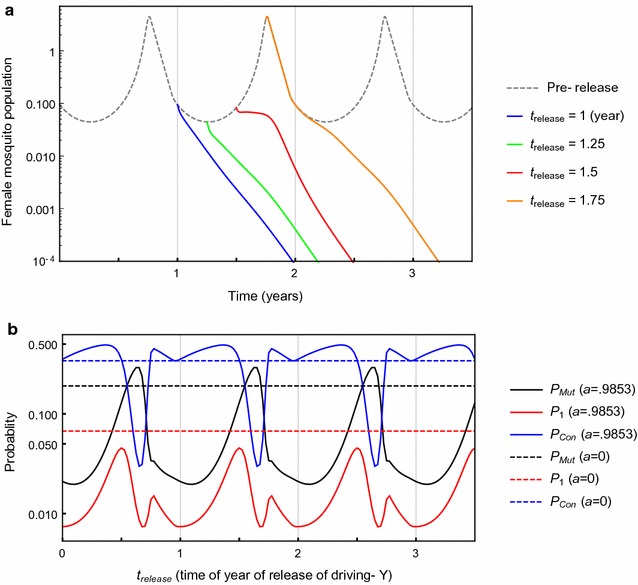
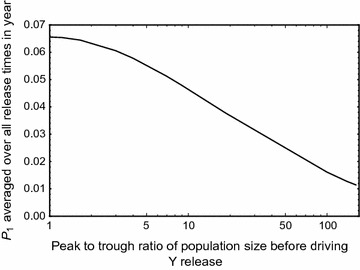
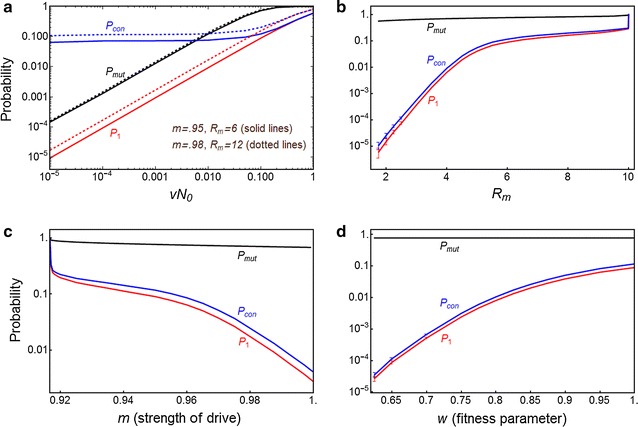
Results: The probability that resistance evolves increases with the mutation rate and the intrinsic rate of increase of the population, and decreases with the strength of drive and any pleiotropic fitness costs of the resistant allele. In seasonally varying environments, the time of release can also affect the probability of resistance evolving. Trans-acting suppressor alleles are more likely to suffer stochastic loss at low frequencies than target site resistant alleles.

Conclusions: As with any other intervention, there is a risk that resistance will evolve to new genetic approaches to vector control, and steps should be taken to minimize this probability. Two design features that should help in this regard are to reduce the rate at which resistant mutations arise, and to target sequences such that if they do arise, they impose a significant fitness cost on the mosquito.

Keywords: Anopheles gambiae; Branching process; Driving Y chromosome; Gene drive; Malaria; Resistance; Vector control.


Figures

Fig. 1
Fig. 1
Example time course for population elimination for the deterministic model in the absence of mutation, after introduction of a driving Y chromosome at t = 0. Populations are normalized by the wild-type pre-release population N 0, and parameter values are R m = 6, m = 0.95, h 0 = 0.05, γ = (R m − 1)/N 0
Fig. 2
Fig. 2
PMut (black lines), P 1 (red lines), and P con (blue lines) for resistant cost-free mutations. a Probabilities P1 and P Mut increase with increasing uN 0, for R m = 6 and m = 0.95 (solid lines) or R m = 12 and m = 0.98 (dotted lines). b All probabilities increase with increasing R m, for m = 0.95 (solid lines) and m=0.98 (dotted lines), with uN 0 = 1. Curves only extend as far as R m = 1/[2(1 − m)(1 − u)] (see Additional file 1: end of Section A1.1b) above which the strength of Y drive m < m crit and population elimination does not occur. c Probabilities decrease with increasing m (strength of Y drive), for R m = 6, uN 0 = 1. d Probabilities increase with increasing mutant fitness parameter w, for Rm=6,m=0.95 (solid lines) and Rm=12,m=0.98 (dotted lines), and uN0=1. The deterministic model shows that the population will be eliminated for w ≤ 0.563 for m = 0.95, and for w0.452 for m = 0.98. For all plots, h 0 = 0.05. Error bars at low Rm,w and high m show the standard error for simulations (averaged over 106 runs, N 0 = 106), when the branching process model does not apply; if not shown, error is within thickness of plot line
Fig. 3
Fig. 3
Deterministic equilibrium as a function of the fitness of the resistant mutation w (for heterozygous females, with fitness w 2 for homozygous females and hemizygous males) and the intrinsic rate of increase of the population (R m). The population is rescued in the white area, where dotted curves represent the percentage suppression of the total female population size, compared to its size when there is no fitness cost (N 0/2). The population is eliminated in the shaded area under the curve of 100% population suppression (w = w ex, solid black line). For w 1 = 0.627 < w ≤ 1, the resistant mutation tends to fixation, and in the white area the population is rescued (with reduced size equal to w2Rm-1w2γ), whereas in the shaded area, the population is eliminated. For 0 < w ≤ w 1, the resistant mutation tends to an intermediate equilibrium, which again rescues the population only in the white area. For R m ≥ 10.0001, the population is always nonzero, since the Y drive is not sufficient to eliminate the population. Parameters are m = 0.95, u = 10−6
Fig. 4
Fig. 4
a Time evolution of wild-type female mosquito population F(t) before driving Y release (dotted line), and for introduction of the driving Y at time T (blue line), 1.25T (green line), 1.5T (red line), and 1.75T (orange line). For R m = 6, m = 0.95, T = 18.25, h 0 = 0.05, w = 1, a = 0.9825 (amplitude selected for peak to trough ratio of 100:1). Note h 0 is the proportion of the time-averaged pre-release population size N¯a(=N0), so the absolute numbers released at different time points are assumed to be the same. b PMut, P 1, and PCon as a function of trelease, the time when the driving Y is released during the period T of the seasonally-varying wild-type population, for a = 0.9825 (solid lines) and a = 0 (dotted lines; no seasonality). For parameters R m = 6, m = 0.95, h 0 = 0.05, uN 0 = 1, w = 1, T = 18.25, and with γ0a adjusted as described as above, such that average wild-type populations over a period N¯a=N0
Fig. 5
Fig. 5
P 1,avg, the probability of at least one mutation arising and surviving, averaged over all driving Y release times in a seasonal cycle T (1 year), as a function of the peak to trough ratio of the periodically-varying pre-release wild-type population (i.e., varying amplitude a). For R m = 6, m = 0.95, h 0 = 0.05, uN 0 = 1, w = 1, T = 18.25 and γ0a adjusted such that average wild-type populations over a period are constant
Fig. 6
Fig. 6
PMut (black line), P1 (red line) and P Con (blue line) for the trans-acting suppressor mutation. a Probabilities increase with increasing vN 0 for R m = 6, m = 0.95 (solid lines) and for R m = 12, m = 0.98 (dotted lines), and w = 1. b Probabilities increase with increased intrinsic growth rate R m (for m = 0.95, w = 1, vN 0 = 0.1). c Probabilities decrease with increased Y-drive m (for R m = 6, w = 1, vN 0 = 0.1. For all plots, h 0 = 0.05. d Probabilities decrease with lower fitness w (for R m = 6, m = 0.95). The deterministic model shows that the population will be eliminated for w ≤ 0.61. For all plots, h 0 = 0.05, vN 0 = 0.1. The error bars at low R m and w show the standard error for simulations (averaged over 106 runs, N 0 = 106), when the branching process model does not apply; if not shown, error is within thickness of plot line
Fig. 7
Fig. 7
The percentage suppression of the total female population (dotted lines) as a function of the fitness of the resistant suppressor mutation (w for heterozygotes, w 2 for homozygotes) and the intrinsic rate of increase of the population (R m). The solid line shows the extinction curve w = w ex (100% suppression line), below which the population is eliminated (shaded area). For 1w>w1=1-10-7 (zone too narrow to appear on plot), the suppressor autosome tends to fixation; below w = w 1 (all visible areas of plot) it tends to an intermediate equilibrium, which rescues the population only in the non-shaded area. For m = 0.95, v = 10−7

Similar articles

Cited by

References

    1. White NJ. Antimalarial drug resistance. J Clin Invest. 2004;113:1084–1092. doi: 10.1172/JCI21682. - DOI - PMC - PubMed
    1. Cui L, Mharakurwa S, Ndiaye D, Rathod PK, Rosenthal PJ. Antimalarial drug resistance: literature review and activities and findings of the ICEMR network. Am J Trop Med Hyg. 2015;93(Suppl 3):57–68. doi: 10.4269/ajtmh.15-0007. - DOI - PMC - PubMed
    1. Barnes KG, Weedall GD, Ndula M, Irving H, Mzihalowa T, Hemingway J, et al. Genomic footprints of selective sweeps from metabolic resistance to pyrethroids in African malaria vectors are driven by scale up of insecticide-based vector control. PLoS Genet. 2017;13:e1006539. doi: 10.1371/journal.pgen.1006539. - DOI - PMC - PubMed
    1. Alphey L, McKemey A, Nimmo D, Neira Oviedo M, Lacroix R, Matzen K, et al. Genetic control of Aedes mosquitoes. Pathog Glob Health. 2013;107:170–179. doi: 10.1179/2047773213Y.0000000095. - DOI - PMC - PubMed
    1. Alphey L. Genetic control of mosquitoes. Annu Rev Entomol. 2014;59:205–224. doi: 10.1146/annurev-ento-011613-162002. - DOI - PubMed

Publication types