. 2017 Sep:158:378-396.
doi: 10.1016/j.neuroimage.2017.07.008. Epub 2017 Jul 11.

Quicksilver: Fast predictive image registration - A deep learning approach

Affiliations

Quicksilver: Fast predictive image registration - A deep learning approach

Xiao Yang et al. Neuroimage. 2017 Sep.

Abstract

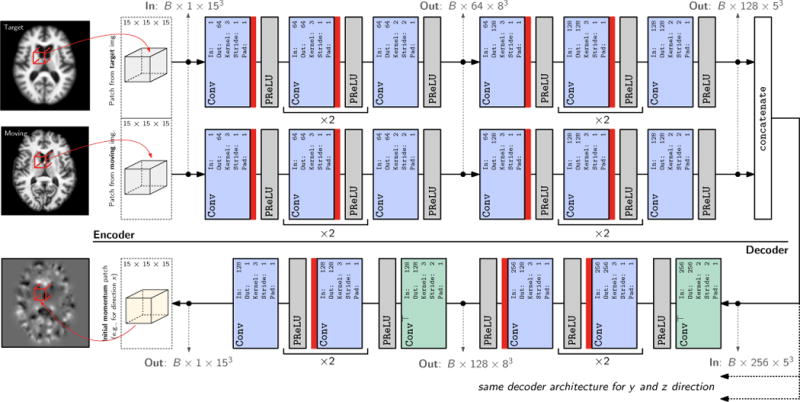
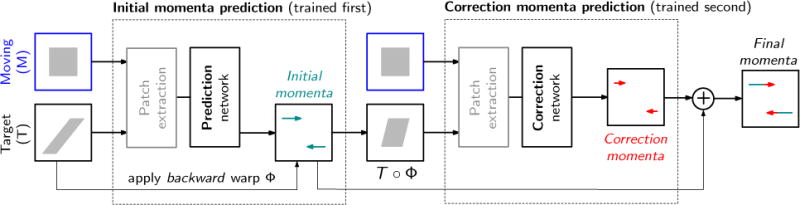
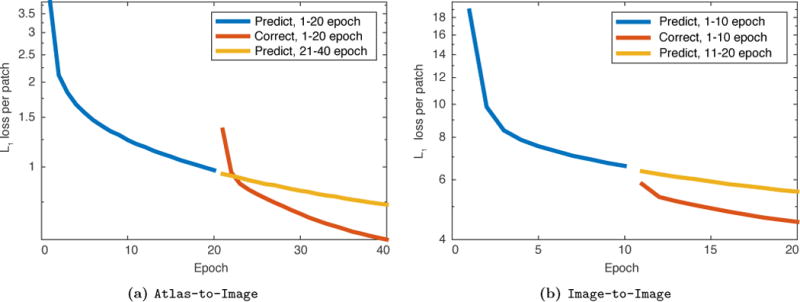
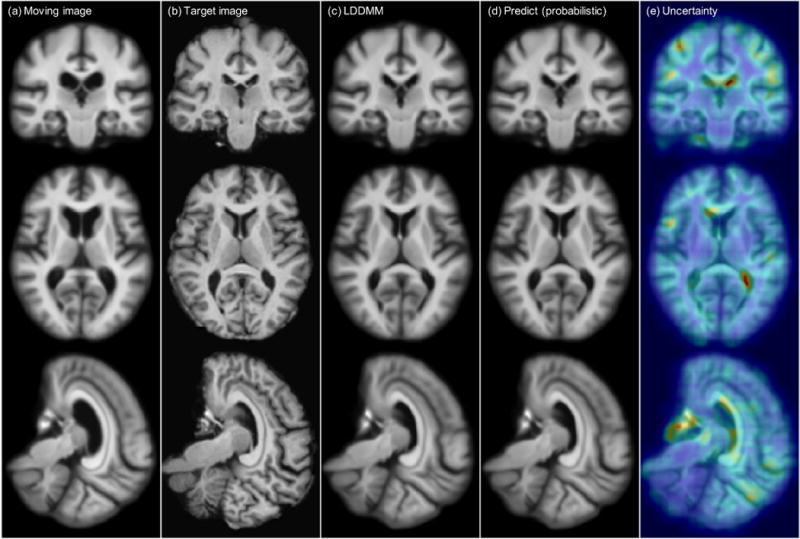
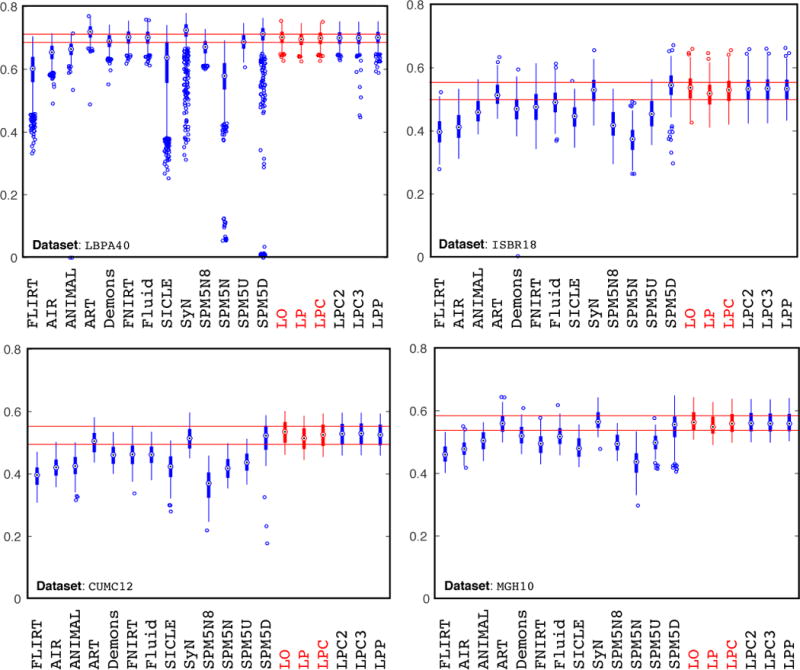
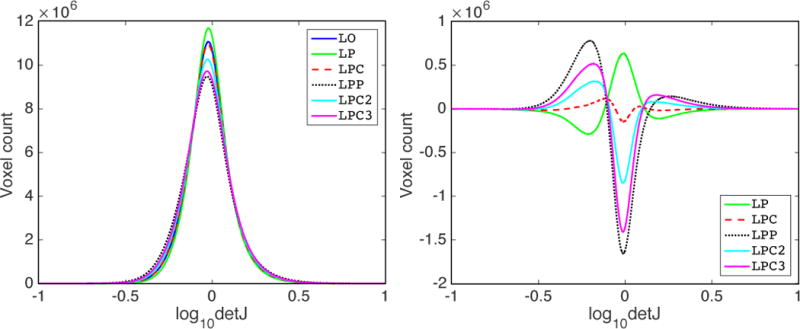
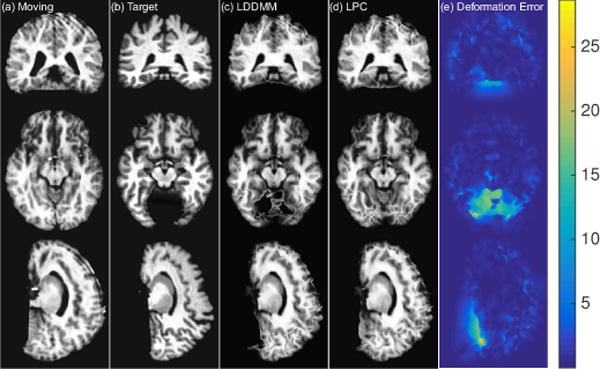
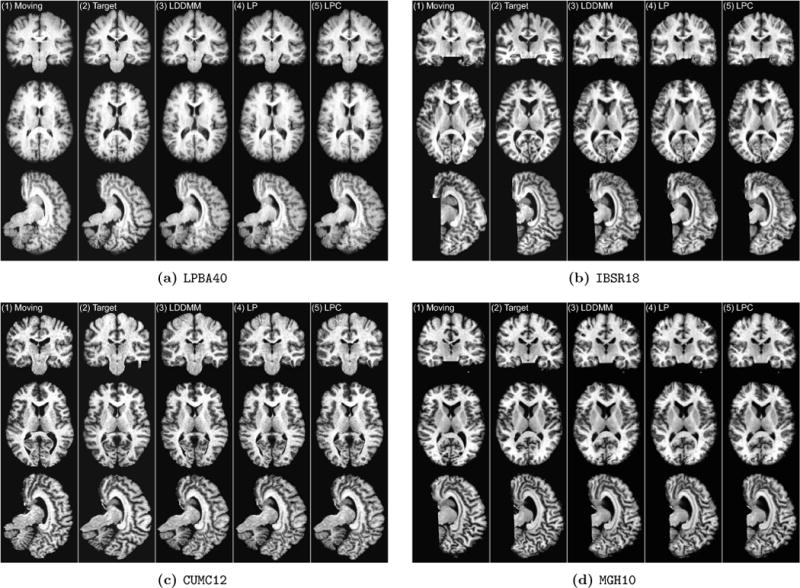
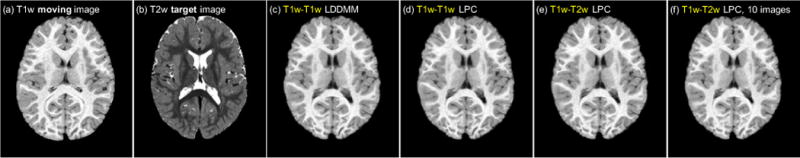
This paper introduces Quicksilver, a fast deformable image registration method. Quicksilver registration for image-pairs works by patch-wise prediction of a deformation model based directly on image appearance. A deep encoder-decoder network is used as the prediction model. While the prediction strategy is general, we focus on predictions for the Large Deformation Diffeomorphic Metric Mapping (LDDMM) model. Specifically, we predict the momentum-parameterization of LDDMM, which facilitates a patch-wise prediction strategy while maintaining the theoretical properties of LDDMM, such as guaranteed diffeomorphic mappings for sufficiently strong regularization. We also provide a probabilistic version of our prediction network which can be sampled during the testing time to calculate uncertainties in the predicted deformations. Finally, we introduce a new correction network which greatly increases the prediction accuracy of an already existing prediction network. We show experimental results for uni-modal atlas-to-image as well as uni-/multi-modal image-to-image registrations. These experiments demonstrate that our method accurately predicts registrations obtained by numerical optimization, is very fast, achieves state-of-the-art registration results on four standard validation datasets, and can jointly learn an image similarity measure. Quicksilver is freely available as an open-source software.

Keywords: Brain imaging; Deep learning; Image registration.


Figures

Figure 1
Figure 1
Left: The LDDMM momentum parameterization is ideal for patch-based prediction of image registrations. Consider registering a small square (left) to a large square (middle) with uniform intensity. Only the corner points suggest clear spatial correspondences. Edges also suggest spatial correspondences, however, correspondences between individual points on edges remain ambiguous. Lastly, points interior to the squares have ambiguous spatial correspondences, which are established purely based on regularization. Hence, predicting velocity or displacement fields (which are spatially dense) from patches is challenging in these interior areas (right), in the absence of sufficient spatial context. Predicting a displacement field as illustrated in the right image from an interior patch (illustrated by the red square) would be impossible if both the target and the source image patches are uniform in intensity. In this scenario, the patch information would not provide sufficient spatial context to capture aspects of the deformation. On the other hand, we know from LDDMM theory that the optimal momentum, m, to match images can be written as m(x,t) = λ(x,t)∇I(x,t), where λ(x,t) ⟼ ℝ is a spatio-temporal scalar field and I(x,t) is the image at time t [45, 19, 17]. Hence, in spatially uniform areas (where correspondences are ambiguous) ∇I = 0 and consequentially m(x, t) = 0. This is highly beneficial for prediction as the momentum only needs to be predicted at image edges. Right: Furthermore, as the momentum is not spatially smooth, the regression approach does not need to account for spatial smoothness, which allows predictions with non-overlapping or hardly-overlapping patches as illustrated in the figure by the red squares. This is not easily possible for the prediction of displacement or velocity fields since these are expected to be spatially dense and smooth, which would need to be considered in the prediction. Consequentially, predictions of velocity or displacement fields will inevitably result in discontinuities across patch boundaries (i.e., across the red square boundaries shown in the figure) if they are predicted independently of each other.
Figure 2
Figure 2
3D (probabilistic) network architecture. The network takes two 3D patches from the moving and target image as the input, and outputs 3 3D initial momentum patches (one for each of the x,y and z dimensions respectively; for readability, only one decoder branch is shown in the figure). In case of the deterministic network, see Sec. 2.2.1, the dropout layers, illustrated by formula image, are removed. Conv: 3D convolution layer. ConvT: 3D transposed convolution layer. Parameters for the Conv and ConvT layers: In: input channel. Out: output channel. Kernel: 3D filter kernel size in each dimension. Stride: stride for the 3D convolution. Pad: zero-padding added to the boundaries of the input patch. Note that in this illustration B denotes the batch size.
Figure 3
Figure 3
The full prediction + correction architecture for LDDMM momenta. First, a rough prediction of the initial momentum, mLP, is obtained by the prediction network (LP) based on the patches from the unaligned moving image, M and target image, T, respectively. The resulting deformation maps Φ−1 and Φ are computed by shooting. Φ is then applied to the target image to warp it to the space of the moving image. A second correction network is then applied to patches from the moving image M and the warped target image T ○ Φ to predict a correction of the initial momentum, mC in the space of the moving image, M. The final momentum is then simply the sum of the predicted momenta, m = mLP + mC, which parameterizes a geodesic between the moving image and the target image.
Figure 4
Figure 4
Log10 plot of l1 training loss per patch. The loss is averaged across all iterations for every epoch for both the Atlas-to-Image case and the Image-to-Image case. The combined prediction + correction networks obtain a lower loss per patch than the loss obtained by simply training the prediction networks for more epochs.
Figure 5
Figure 5
Atlas-to-image registration example. From left to right: (a): moving (atlas) image; (b): target image; (c): deformation from optimizing LDDMM energy; (d): deformation from using the mean of 50 samples from the probabilistic network with stride=14 and patch pruning; (e): the uncertainty map as square root of the sum of the variances of the deformation in x, y, and z directions mapped onto the predicted deformation result. The coloring indicates the level of uncertainty, with red = high uncertainty and blue = low uncertainty. Best-viewed in color.
Figure 6
Figure 6
Overlap by registration method for the image-to-image registration case. The boxplots illustrate the mean target overlap measures averaged over all subjects in each label set, where mean target overlap is the average of the fraction of the target region overlapping with the registered moving region over all labels. The proposed LDDMM-based methods in this paper are highlighted in red. LO = LDDMM optimization; LP = prediction network; LPC = prediction network + correction network. LPP: prediction network + using the prediction network for correction. LPC2/LPC3: prediction network + iteratively using the correction network 2/3 times. Horizontal red lines show the LPC performance in the lower quartile to upper quartile (best-viewed in color). The medians of the overlapping scores for [LPBA40, IBSR18, CUMC12, MGH10] for LO, LP and LPC are: LO: [0.702, 0.537, 0.536, 0.563]; LP: [0.696, 0.518, 0.515, 0.549]; LPC: [0.702, 0.533, 0.526, 0.559]. Best-viewed in color.
Figure 7
Figure 7
Distribution of the determinant of Jacobian of the deformations for LPBA40 dataset registrations. Left : histograms of the log-transformed determinant of Jacobian for the deformation maps (log10detJ) for all registration cases. Right : difference of the histograms of log10detJ between prediction models (LP, LPC, LPP, LPC2, LPC3) and LO. For the right figure, the closer a curve is to y = 0, the more similar the corresponding method is to LO. A value of 0 on the x-axis indicates no deformation, or a volume-preserving deformation, > 0 indicates shrinkage and < 0 indicates expansion. Best-viewed in color.
Figure 8
Figure 8
Failure case for IBSR18 dataset where LDDMM optimization generated very extreme deformations. From left to right: (a): moving image; (b): target image; (c): LDDMM optimization result; (d): prediction+correction result (LPC); (e): heatmap showing the di_erences between the optimization deformation and predicted deformation in millimeters. Most registration errors occur in the area of the cerebellum, which has been inconsistently preserved in the moving and the target images during brain extraction. Hence, not all the retained brain regions in the moving image have correspondences in the target image. Best-viewed in color.
Figure 9
Figure 9
Example test cases for the image-to-image registration. For every figure from left to right : (1): moving image; (2): target image; (3): registration result from optimizing LDDMM energy; (4): registration result from prediction network (LP); (5): registration result from prediction+correction network (LPC).
Figure 10
Figure 10
Example test case for multi-modal image-to-image tests. (a): T1w moving image; (b): T2w target image; (c): T1w-T1w LDDMM optimization (LO) result; (d)-(f): deformation prediction+correction (LPC) result using (d) T1w-T1w data; (e) T1w-T2w data; (f) T1w-T2w data using only 10 images as training data.
Figure 11
Figure 11
Average initial momentum prediction time (in seconds) for a single 229 × 193 × 193 3D brain image case using various number of GPUs.

References

    1. Modersitzki J. Numerical methods for image registration. Oxford University Press on Demand. 2004
    1. Biobank. website: www.ukbiobank.ac.uk.
    1. Van Essen DC, Smith SM, Barch DM, Behrens TE, Yacoub E, Ugurbil K, WU-Minn HCP Consortium The WU-Minn human connectome project: an overview. NeuroImage. 2013;80:62–79. - PMC - PubMed
    1. Chung K, Deisseroth K. CLARITY for mapping the nervous system. Nature methods. 2013;10(6):508–513. - PubMed
    1. Shams R, Sadeghi P, Kennedy RA, Hartley RI. A survey of medical image registration on multicore and the GPU. IEEE Signal Processing Magazine. 2010;27(2):50–60.

Publication types