. 2017 Oct 15:142:96-110.
doi: 10.1016/j.bcp.2017.07.005. Epub 2017 Jul 11.

Receptor activity-modifying protein dependent and independent activation mechanisms in the coupling of calcitonin gene-related peptide and adrenomedullin receptors to Gs

Affiliations

Receptor activity-modifying protein dependent and independent activation mechanisms in the coupling of calcitonin gene-related peptide and adrenomedullin receptors to Gs

Michael J Woolley et al. Biochem Pharmacol. .

Abstract

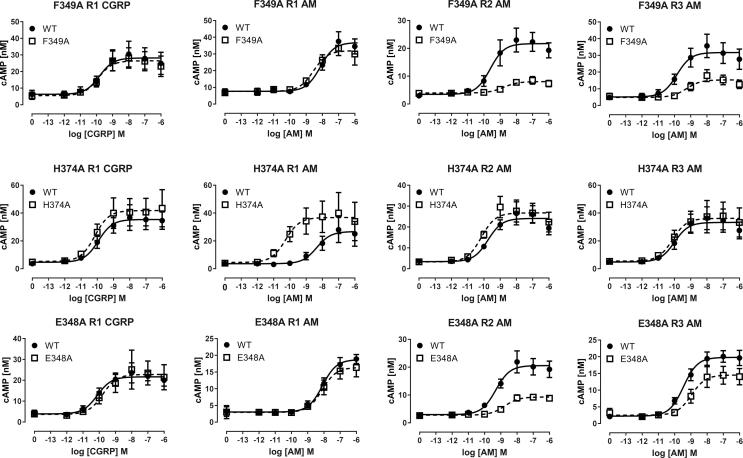
Calcitonin gene-related peptide (CGRP) or adrenomedullin (AM) receptors are heteromers of the calcitonin receptor-like receptor (CLR), a class B G protein-coupled receptor, and one of three receptor activity-modifying proteins (RAMPs). How CGRP and AM activate CLR and how this process is modulated by RAMPs is unclear. We have defined how CGRP and AM induce Gs-coupling in CLR-RAMP heteromers by measuring the effect of targeted mutagenesis in the CLR transmembrane domain on cAMP production, modeling the active state conformations of CGRP and AM receptors in complex with the Gs C-terminus and conducting molecular dynamics simulations in an explicitly hydrated lipidic bilayer. The largest effects on receptor signaling were seen with H295A5.40b, I298A5.43b, L302A5.47b, N305A5.50b, L345A6.49b and E348A6.52b, F349A6.53b and H374A7.47b (class B numbering in superscript). Many of these residues are likely to form part of a group in close proximity to the peptide binding site and link to a network of hydrophilic and hydrophobic residues, which undergo rearrangements to facilitate Gs binding. Residues closer to the extracellular loops displayed more pronounced RAMP or ligand-dependent effects. Mutation of H3747.47b to alanine increased AM potency 100-fold in the CGRP receptor. The molecular dynamics simulation showed that TM5 and TM6 pivoted around TM3. The data suggest that hydrophobic interactions are more important for CLR activation than other class B GPCRs, providing new insights into the mechanisms of activation of this class of receptor. Furthermore the data may aid in the understanding of how RAMPs modulate the signaling of other class B GPCRs.

Keywords: Adrenomedullin; Adrenomedullin (PubChem CID: 56841671); Calcitonin gene-related peptide; Calcitonin gene-related peptide (PubChem CID: 56841902); GPCR; Molecular dynamics; Molecular modeling; Receptor activity-modifying protein; cAMP (PubChem CID: 6076).


Figures

None
Graphical abstract
Fig. 1
Fig. 1
Snake plot of TM residues of CLR; residues selected for alanine substitution are shaded in grey. These residues are numbered according to their primary sequence, followed by the class A/class B numbering in superscript (e.g. V1902.56/2.63b).
Fig. 2
Fig. 2
Cell surface expression data for selected mutants showing CLR (HA) and RAMP1 (myc) or RAMP2 (FLAG) expression. Each bar is the combined mean ± s.e.m. from 3 to 6 independent experiments, each performed with triplicates or quadruplicates.
Fig. 3
Fig. 3
Δlog(RA) values for all ligands at all receptors tested, providing a global summary of the data. 95% CI are shown. Multiple comparisons of the values for each mutant are shown, where statistically significant.
Fig. 4
Fig. 4
Concentration-response curves for selected mutants with effects that were mostly independent of ligand or RAMP. Each point is the combined mean ± s.e.m. from 4 to 6 independent experiments, each performed with triplicates.
Fig. 5
Fig. 5
Concentration-response curves for mutants with RAMP or ligand-dependent effects. Each point is the combined mean ± s.e.m. from 3 to 5 independent experiments, each performed with triplicates.
Fig. 6
Fig. 6
Radioligand binding of mutants. Displacement of 125I-CGRP by CGRP at CLR/RAMP1 or displacement of 125I-AM by CGRP at CLR/RAMP2. For AM, binding with RAMP2 alone is also shown. Values are mean ± s.e.m. of 4–6 independent determinations for CGRP or 3 independent determinations for AM.
Fig. 7
Fig. 7
Interactions between transmembrane (TM) helices as seen in a molecular dynamics simulation of the TM domain of inactive CLR (red). Changes in inter-helical distances for the V190A (A) and H374A (B) mutants is associated with an increase in potency for some ligand/RAMP combinations. The TM2 – TM3 distance is shown for wild-type and V190A and for wild-type and H374A. The TM1 – TM7 distance is shown for wild-type and V190A and for wild-type and H374A. Also shown is hydrogen bond formation between S183 and N225 (C). (For interpretation of the references to color in this figure legend, the reader is referred to the web version of this article.)
Fig. 8
Fig. 8
Rotation of residues in the transition from the inactive (A, C) to the active (B, D) transmembrane bundle of CLR (purple). Views looking towards the extracellular face of the receptor are shown in A and B; views from the side of the receptor are shown in C and D. (For interpretation of the references to color in this figure legend, the reader is referred to the web version of this article.)
Fig. 9
Fig. 9
CLR residues that form the predicted G protein binding pocket and those which undergo a rearrangement upon activation. The surface of residues that form the G protein binding site in the active state model with RAMP 1 is colored purple, viewed from the receptor side in A and from the intracellular side in B. Residues that contact each other in the inactive state TMD model of CLR are shown in spacefill colored red (C,D), while those that contact each other in the active state model with RAMP 1 are in spacefill and colored green (E,F). The residues at the G protein interface are R173 (ICL1), H177 (TM2), Y236, L237, L240, (TM3), I241, V242, A244, V245, F246, (ICL2), I312, V315, L316 (TM5), K319, T323, L330 (ICL3), A332, K333, A337, L341 (TM6), F387, N388 (TM7), G389, E390 (H8). Residues in bold disrupt Gs coupling when mutated to alanine, residues in italics have no effect. (For interpretation of the references to color in this figure legend, the reader is referred to the web version of this article.)
Fig. 10
Fig. 10
Key residues within the TM bundle of the active CLR in complex with CGRP and RAMP1. CGRP is wheat colored, the RAMP TM helix is magenta. CLR is colored in rainbow mode from cyan (TM1) to red (TM7). Residue labels are colored for clarity only. A) The position of the ring residues within the CLR TM bundle. B and C). The position of selected CLR hydrophobic residues on TM3, TM5 and TM6 shown from opposite sides of the receptor. In B, the residues are shown from the same side of the receptor as in (A) and (D); in B and C the residues are colored by helix. The positions of P343 and G346 are marked in yellow on TM6 in B. Y227 and L345, formally equivalent to the class A connector region (I3.40 and F6.44 in the β2-AR), are in close proximity. D). The position of selected CLR hydrophilic residues on TM2, TM3, TM5, TM6 and TM7. CGRP is wheat colored; the RAMP TM helix is magenta. Residues are shown in stick form to allow the positions of potential coulombic interactions to be visualized; mutually interacting residues are shown in the same color. Residues that interact with RAMP1 in this average structure (structure with the lowest RMSD to the average structure, as determined by the visual molecular dynamics software) are shown in line form and colored according to the helix color; residues that form persistent interactions (i.e. <5 Å in more than 80% of the frames in all 4 MD simulations) are identified by their residue number. (For interpretation of the references to color in this figure legend, the reader is referred to the web version of this article.)
Fig. 11
Fig. 11
Comparison of the upper TM hydrophilic network in the CRF1 receptor (4K5Y, yellow), the glucagon receptor expressed as a fusion protein (4L6R, white) and the inactive structure of CLR (orange). (For interpretation of the references to color in this figure legend, the reader is referred to the web version of this article.)
Fig. 12
Fig. 12
Comparison of the TM domain of CLR (orange) with RAMP1 (red) with the cryo-EM structure of CTR (blue). (A), side view. (B), View from the extracellular side. The presence of the RAMP reorganizes the region around TM1, TM7 and TM6. (C). CLR model (orange) with RAMP1 (red) with superposed TM1 and TM7 of the CTR-EM (blue). The arrows indicate the necessary vector of movement of TM1 and TM7 of CTR to accommodate RAMP1 and prevent a clash. In consequence, TM7 of CLR is located closer to the TM bundle than in the CTR-EM structure. (D). The orientation of the CLR ECD with respect to the electron density of the ECD for the CTR. The surface of the electron density, contoured at 0.014 for the ECD and the top of the TM domain is shown in blue transparent. The starting structure of the CLR/RAMP1 complex, superimposed on the TM domain of the CTR (PDB code 5UZ7) is shown in wheat color (RMSD 2.6 Å over 190 TM domain residues); the final model from the second 500 ns CLR/RAMP1 simulation is shown in cyan (RMSD 3.1 Å over 203 TM domain residues). The final structure from the second 500 ns CLR/RAMP2/AM simulation is shown in purple (RMSD 3.6 Å over 210 TM domain residues). The superposition of the TM domains permits comparison of the ECD regions with respect to the CTR electron density. (For interpretation of the references to color in this figure legend, the reader is referred to the web version of this article.)

Similar articles

Cited by

References

    1. Alexander S.P., Davenport A.P., Kelly E., Marrion N., Peters J.A., Benson H.E., Faccenda E., Pawson A.J., Sharman J.L., Southan C., Davies J.A., Collaborators C. The concise guide to PHARMACOLOGY 2015/16: G protein-coupled receptors. Br. J. Pharmacol. 2015;172(24):5744–5869. - PMC - PubMed
    1. Archbold J.K., Flanagan J.U., Watkins H.A., Gingell J.J., Hay D.L. Structural insights into RAMP modification of secretin family G protein-coupled receptors: implications for drug development. Trends Pharmacol. Sci. 2011;32(10):591–600. - PubMed
    1. Bailey R.J., Hay D.L. Pharmacology of the human CGRP1 receptor in Cos 7 cells. Peptides. 2006;27(6):1367–1375. - PubMed
    1. Bailey R.J., Hay D.L. Agonist-dependent consequences of proline to alanine substitution in the transmembrane helices of the calcitonin receptor. Br. J. Pharmacol. 2007;151(5):678–687. - PMC - PubMed
    1. Bailey R.J., Walker C.S., Ferner A.H., Loomes K.M., Prijic G., Halim A., Whiting L., Phillips A.R., Hay D.L. Pharmacological characterization of rat amylin receptors: implications for the identification of amylin receptor subtypes. Br. J. Pharmacol. 2012;166(1):151–167. - PMC - PubMed

MeSH terms

Substances