. 2017 Nov 1;313(5):L807-L824.
doi: 10.1152/ajplung.00569.2016. Epub 2017 Jul 13.

TGF-β inhibits alveolar protein transport by promoting shedding, regulated intramembrane proteolysis, and transcriptional downregulation of megalin

Affiliations

TGF-β inhibits alveolar protein transport by promoting shedding, regulated intramembrane proteolysis, and transcriptional downregulation of megalin

Luciana C Mazzocchi et al. Am J Physiol Lung Cell Mol Physiol. .

Abstract

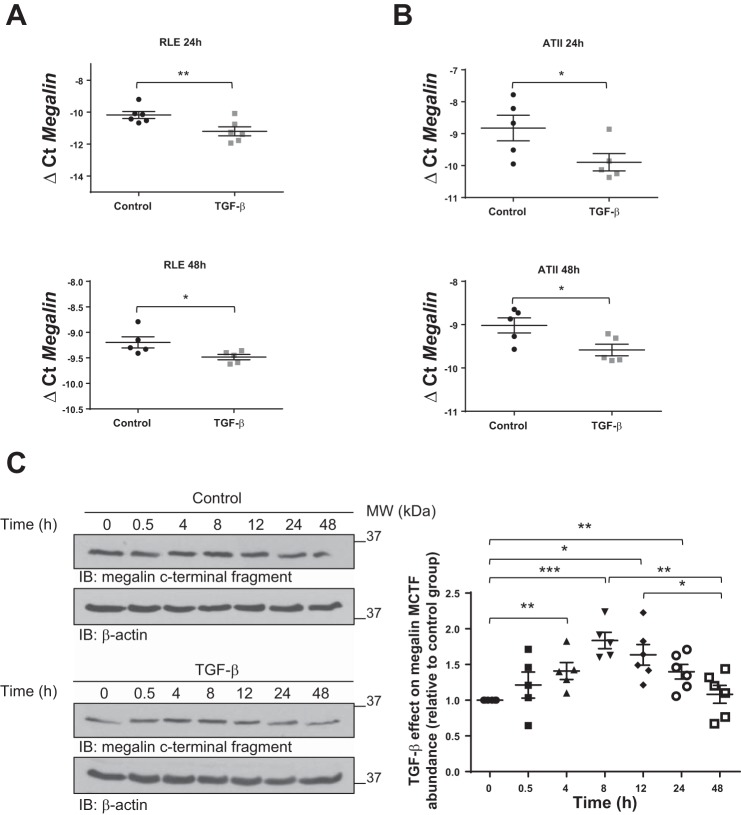
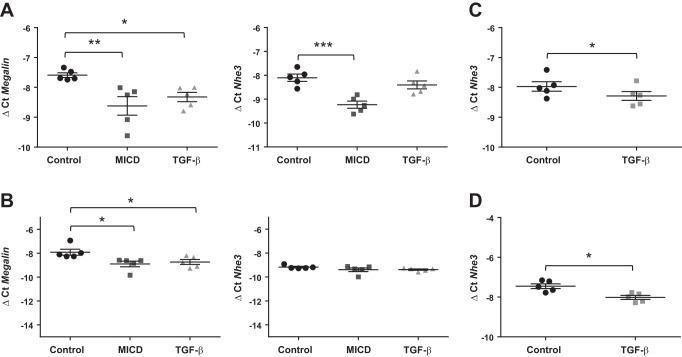
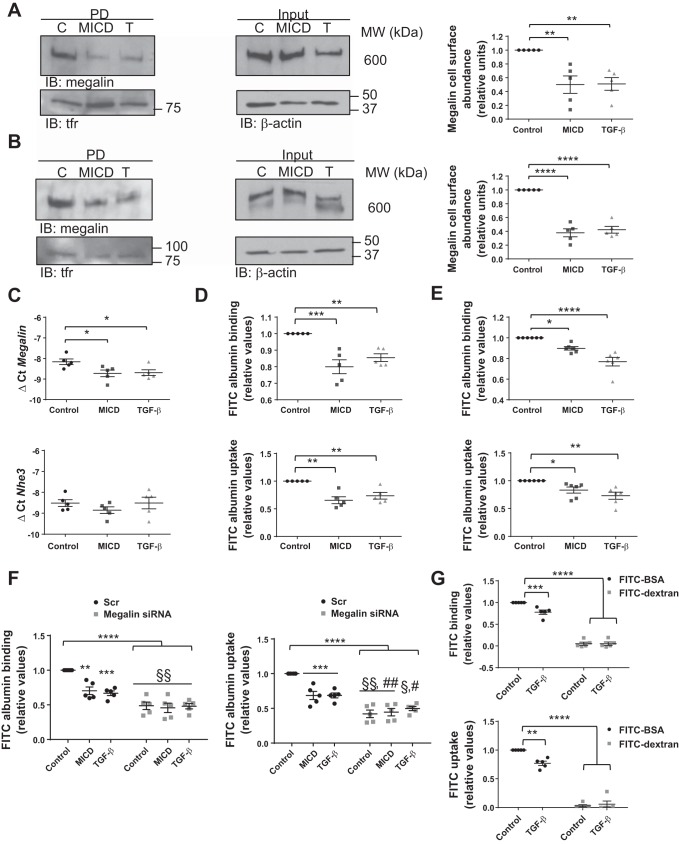
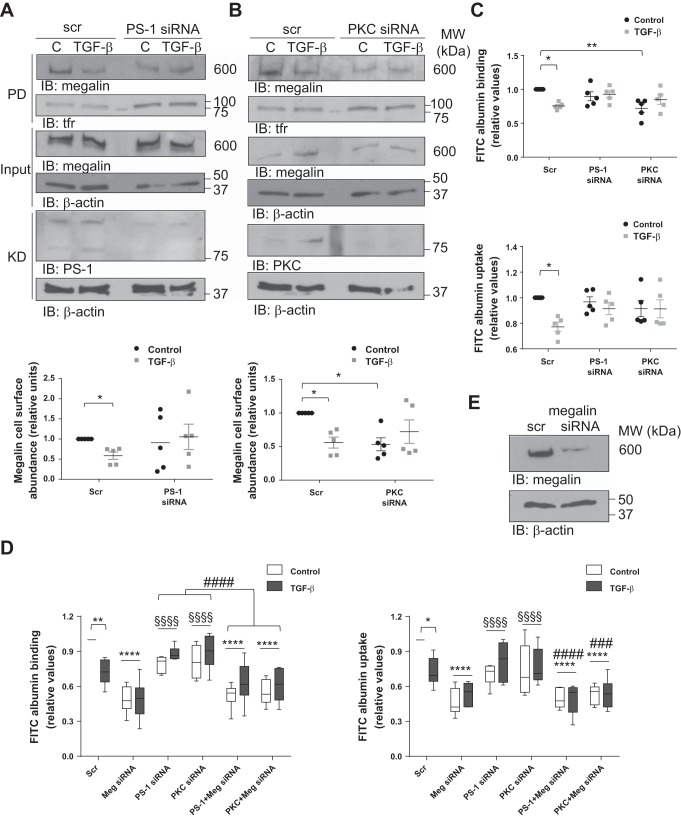
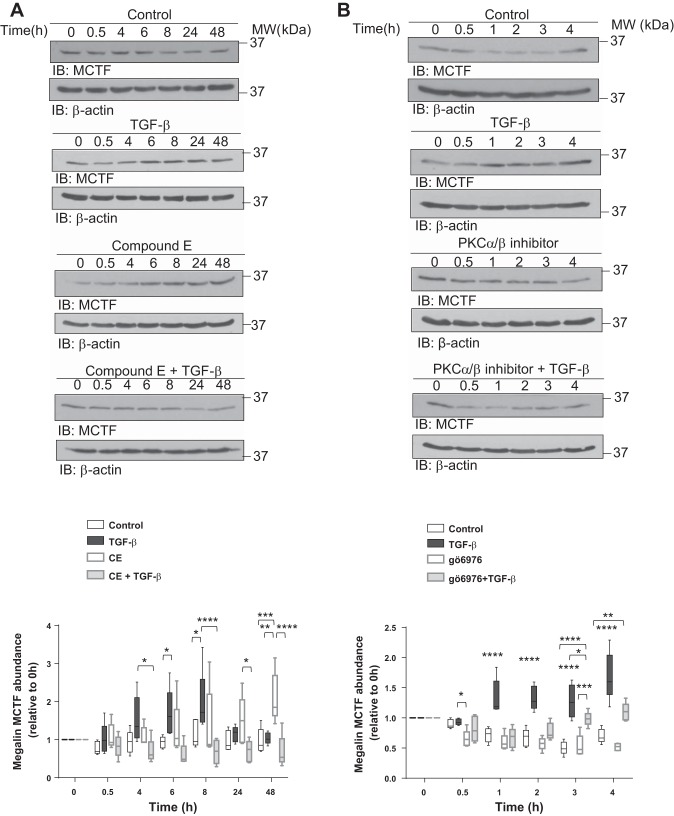
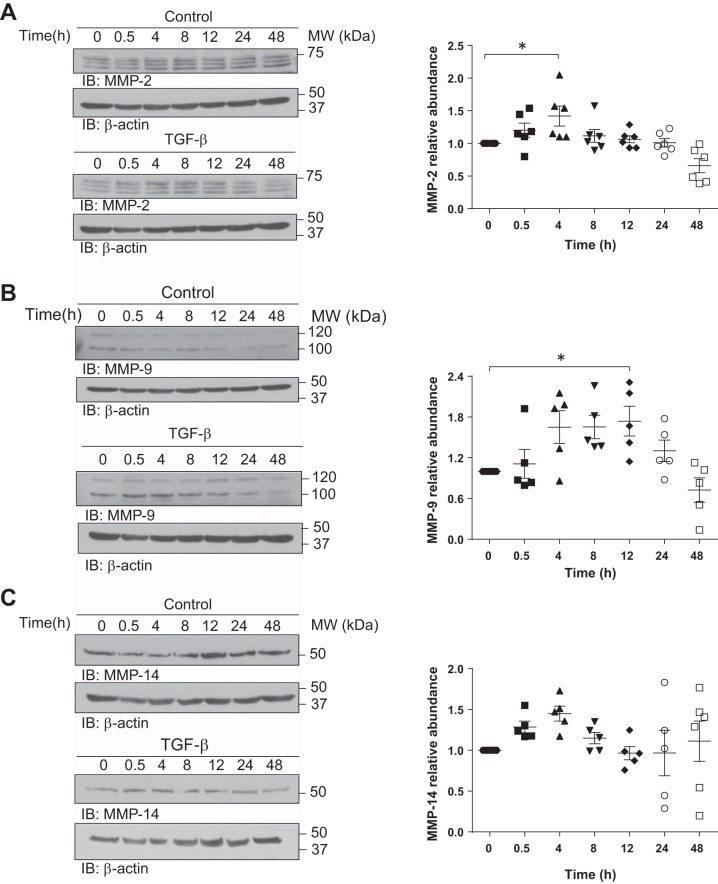
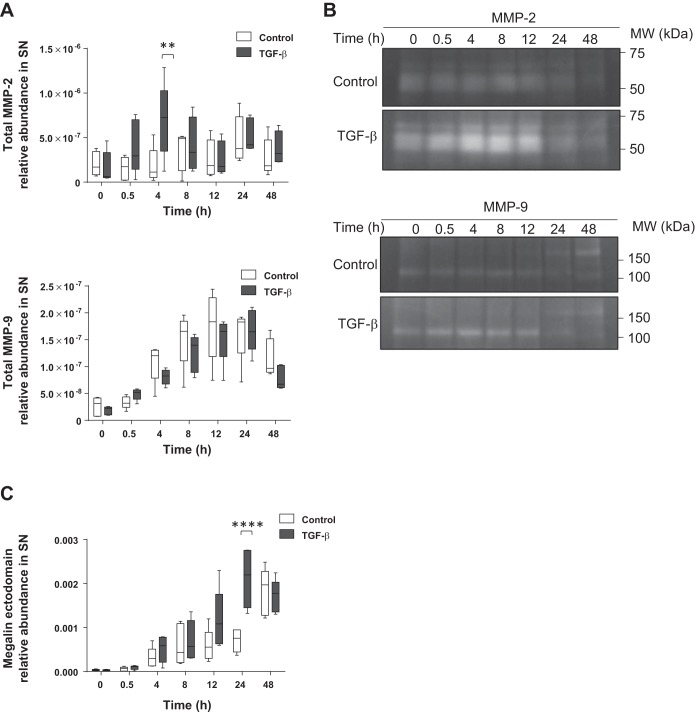
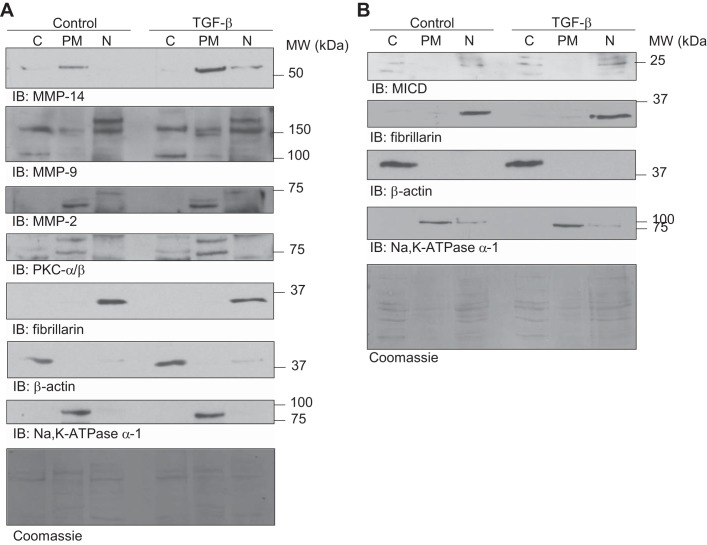
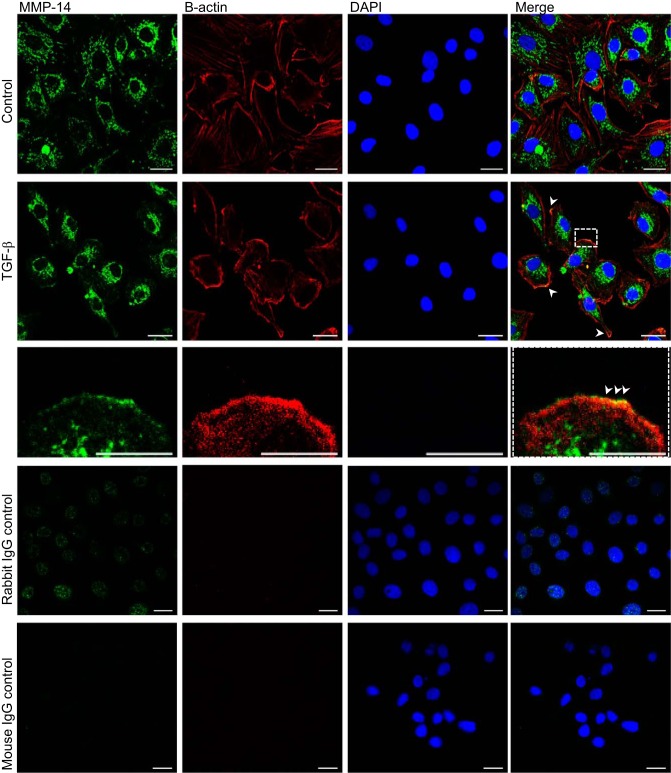
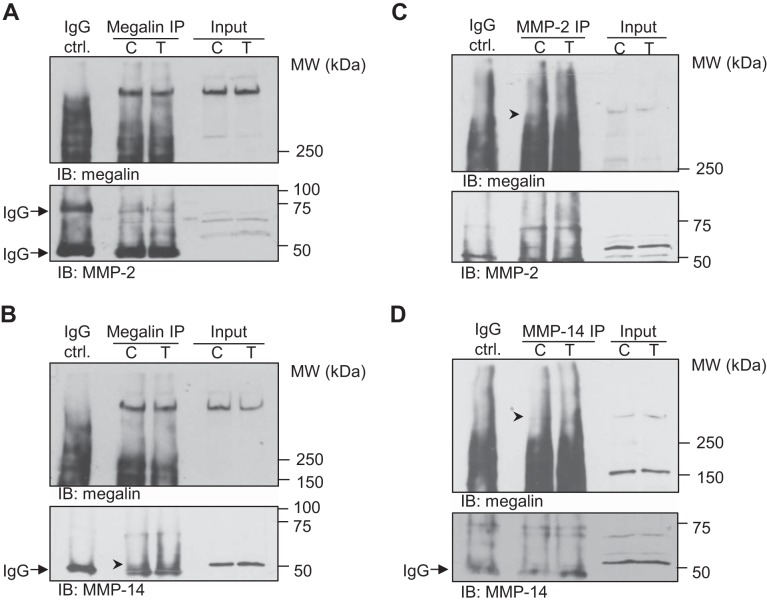
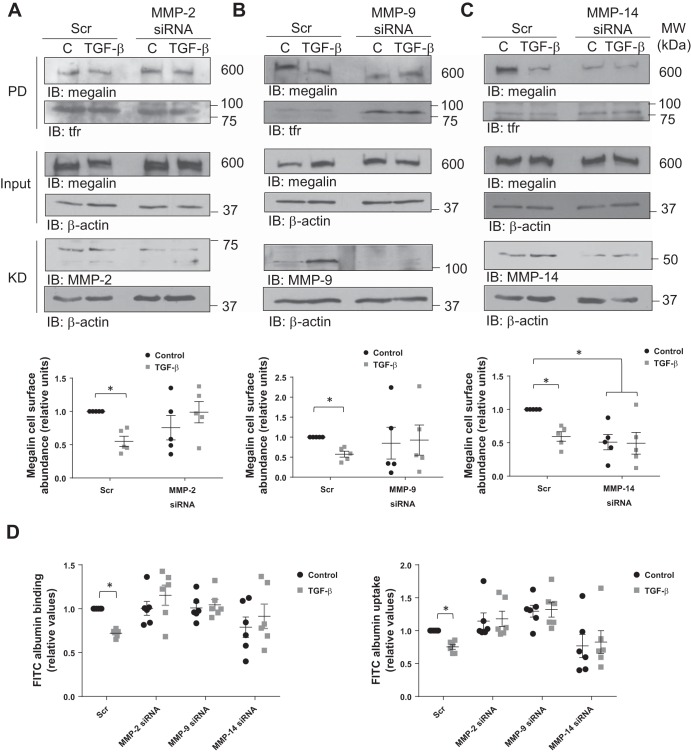
Disruption of the alveolar-capillary barrier is a hallmark of acute respiratory distress syndrome (ARDS) that leads to the accumulation of protein-rich edema in the alveolar space, often resulting in comparable protein concentrations in alveolar edema and plasma and causing deleterious remodeling. Patients who survive ARDS have approximately three times lower protein concentrations in the alveolar edema than nonsurvivors; thus the ability to remove excess protein from the alveolar space may be critical for a positive outcome. We have recently shown that clearance of albumin from the alveolar space is mediated by megalin, a 600-kDa transmembrane endocytic receptor and member of the low-density lipoprotein receptor superfamily. In the currents study, we investigate the molecular mechanisms by which transforming growth factor-β (TGF-β), a key molecule of ARDS pathogenesis, drives downregulation of megalin expression and function. TGF-β treatment led to shedding and regulated intramembrane proteolysis of megalin at the cell surface and to a subsequent increase in intracellular megalin COOH-terminal fragment abundance resulting in transcriptional downregulation of megalin. Activity of classical protein kinase C enzymes and γ-secretase was required for the TGF-β-induced megalin downregulation. Furthermore, TGF-β-induced shedding of megalin was mediated by matrix metalloproteinases (MMPs)-2, -9, and -14. Silencing of either of these MMPs stabilized megalin at the cell surface after TGF-β treatment and restored normal albumin transport. Moreover, a direct interaction of megalin with MMP-2 and -14 was demonstrated, suggesting that these MMPs may function as novel sheddases of megalin. Further understanding of these mechanisms may lead to novel therapeutic approaches for the treatment of ARDS.

Keywords: alveolar protein transport; matrix metalloproteinases; megalin; receptor shedding; regulated intramembrane proteolysis.


Figures

Fig. 1.
Fig. 1.
Transforming growth factor-β (TGF-β) reduces transcriptional expression of megalin and regulates megalin COOH-terminal fragment (MCTF) abundance. Total RNA from rat lung epithelial-T-antigen negative (RLE-6TN) (A) or primary rat ATII cells (B) was isolated after TGF-β (20 ng/ml) treatment for 24 or 48 h. Real-time PCR was performed after cDNA preparation. GAPDH was used as a housekeeping gene. Paired t-test, *P < 0.05; **P < 0.01; n = 5. C: RLE-6TN cells were treated with TGF-β (20 ng/ml) up to 48 h. Whole cell homogenates were processed by SDS-PAGE and immunoblot (IB). One-way ANOVA and Tukey’s multiple comparisons, *P < 0.05; **P < 0.01; ***P < 0.001; n ≥ 5. Results are shown as means ± SE. Representative blots are shown.
Fig. 2.
Fig. 2.
TGF-β impairs both megalin and Na+/H+ exchanger 3 (NHE3) mRNA expression by promoting megalin intracellular domain (MICD) release into the cytoplasm. A: RLE-6TN cells treated for 24 h, n = 5. B: ATII cells treated for 24 h, n = 5. C: NHE3 expression measured from RLE-6TN cells treated for 48 h, n = 5. D: NHE3 expression measured from ATII cells treated for 48 h, n = 5. Cells were treated with MICD (1.2 µg/µl) or TGF-β (20 ng/ml), and total RNA was isolated. Megalin and NHE3 expression was measured by real-time PCR with specific primers after reverse transcription. Results are shown as means ± SE. One-way ANOVA and Dunnett’s multiple comparisons, *P < 0.05; **P < 0.01; ***P < 0.001.
Fig. 3.
Fig. 3.
Application of exogenous MICD reduces megalin cell surface abundance thereby altering binding and uptake of albumin by alveolar epithelial cells. RLE-6TN (A) or primary ATII (B) cells were treated with a synthetic protein containing megalin intracellular domain (MICD) sequence (1.2 µg/µl) or with TGF-β (20 ng/ml) for 10 h. Cell surface proteins were labeled with biotin and pulled down (PD) with streptavidin beads. Pulled-down proteins were separated by SDS-PAGE and blotted with specific antibodies. C: RLE-6TN cells were treated as previously described, and total RNA was isolated. Megalin and NHE3 expression was measured by real-time PCR. RLE-6TN (D) or primary ATII (E) cells were treated with synthetic MICD (1.2 µg/µl) or with TGF-β (20 ng/ml) for 10 h and FITC-albumin binding, and uptake assays were performed. Fluorescence readouts were normalized to total protein amount from the taken-up fraction. Results (AE) are shown as means ± SE. One-way ANOVA and Tukey’s multiple comparisons, *P < 0.05; **P < 0.01; ***P < 0.001; ****P < 0.0001; n = 5. F: RLE-6TN cells were transfected with specific siRNA for megalin knockdown or with control siRNA (Scr) for 48 h before treatment with MICD or TGF-β as described above. FITC-albumin binding and uptake assays were performed as previously described. Results are shown as means ± SE. Two-way ANOVA and Tukey’s multiple comparisons, **P < 0.01 (compared with control Scr); ***P < 0.001; ****P < 0.0001; §P < 0.05 (compared with MICD Scr); §§P < 0.01; #P < 0.05 (compared with TGF-β Scr); ##P < 0.01; n = 5. G: control experiments showing specificity of TGF-β on albumin binding and uptake. RLE-6TN cells were incubated with TGF-β (20 ng/ml) for 10 h and assayed for binding and uptake of FITC-albumin or FITC-dextran. Results are shown as means ± SE. One-way ANOVA and Tukey’s multiple comparisons, **P < 0.01; ***P < 0.001; ****P < 0.0001; n = 5.
Fig. 4.
Fig. 4.
Inhibition of γ-secretase and classical PKCs prevent the effect of TGF-β on megalin cell surface stability increasing megalin functionality. RLE-6TN cells were transfected with presenilin-1 (PS-1) or PKCα/β siRNA for 72 h and treated with TGF-β (20 ng/ml) for 10 h. Cells were then processed to detect megalin cell surface abundance by biotin-streptavidin pulldown assay (A and B) or to measure FITC-albumin binding and uptake (C). Results are shown as means ± SE. Two-way ANOVA and Šidák’s multiple comparisons, *P < 0.05; **P < 0.01; n = 5. D: RLE-6TN cells were co-transfected with PS-1 or PKC siRNA in the presence or absence of megalin (Meg) siRNA and FITC-albumin binding, and uptake were assessed. Boxes represent the median + quartiles; the ends of the whiskers show the minimum and maximum of all data. Two-way ANOVA and Tukey’s multiple comparisons, *P < 0.05; **P < 0.01; ****P < 0.0001 (compared with Scr control); §§§§P < 0.0001 (compared with Meg siRNA); ###P < 0.001; ####P < 0.0001 (compared with the corresponding single knockdown); n = 5. E: a representative Western blot of megalin knockdown in RLE-6TN cells. Scr, scrambled siRNA; PD, pulldown; KD, knockdown.
Fig. 5.
Fig. 5.
Chemical inhibition of γ-secretase and PKC activities prevents the effects of TGF-β on MCTF abundance. A: RLE-6TN cells were pretreated for 4 h with 1 µM of a γ-secretase activity inhibitor, compound E (CE), and subsequently treated with TGF-β (20 ng/ml) in the presence of the inhibitor for up to 48 h. B: RLE-6TN cells were pretreated for 4 h with 1.3 µM of a PKC inhibitor, gö6976, and subsequently treated with TGF-β (20 ng/ml) in the presence of the inhibitor for up to 48 h. In all the cases, whole cell homogenates were processed by SDS-PAGE and IB. Boxes represent the median + quartiles; the ends of the whiskers show the minimum and maximum of all data. Two-way ANOVA Tukey’s multiple comparisons test, *P < 0.05; **P < 0.01; ***P < 0.001; ****P < 0.0001; n = 6.
Fig. 6.
Fig. 6.
TGF-β regulates intracellular expression of MMP-2, -9, and -14. RLE-6TN cells were treated with TGF-β (20 ng/ml) up to 48 h. Whole cell homogenates were processed by SDS-PAGE and IB for MMP-2 (A), MMP-9 (B), and MMP-14 (C). Representative blots are shown. Results are shown as means ± SE. One-way ANOVA and Šidák’s or Dunnett’s multiple comparisons, *P < 0.05; n = 6. Control and treated samples were derived from the same cellular passage and processed in parallel.
Fig. 7.
Fig. 7.
TGF-β regulates extracellular activation of MMP-2 and promotes shedding of megalin ectodomain. RLE-6TN cells were treated with TGF-β (20 ng/ml) up to 48 h. Supernatants (SN) were collected, centrifuged to remove debris, and concentrated for subsequent analysis. A: specific ELISA for MMP-2 or MMP-9. Chemiluminescent units were normalized to protein concentration in the SN. Boxes represent the median + quartiles; the ends of the whiskers show the minimum and maximum of all data. Two-way ANOVA and Šidák’s multiple comparisons, **P < 0.01; n = 5. B: representative zymography from SN processed in A. Control and treated samples were derived from the same cellular passage and processed in parallel. MMP-2 and MMP-9 blots proceed from the same gels, even if shown separately; n = 5. C: specific ELISA for megalin ectodomain. Boxes represent the median + quartiles; the ends of the whiskers show the minimum and maximum of all data. Two-way ANOVA and Šidák’s multiple comparisons, ****P < 0.0001; n = 5.
Fig. 8.
Fig. 8.
TGF-β promotes translocation of PKC, MMP-9, and MMP-14 to the plasma membrane and an increase of MICD in the nuclear fraction. A: co-localization of PKC, MMP-9, and MMP-14 with the purified plasma membrane fraction. B: co-localization of MICD with the purified nuclear fraction. Representative blots are shown; n = 5. RLE-6TN cells were treated with TGF-β (20 ng/ml) for 10 h, and whole cell homogenates were fractionated by isopycnic (sucrose gradient) and differential centrifugation. Cytoplasm (endosomes-free) (C), plasma membrane (PM), and nucleus (N) were purified. Fractions were processed by SDS-PAGE in 4–16% gradient gels followed by IB. Total proteins were stained with Coomassie brilliant blue.
Fig. 9.
Fig. 9.
MMP-14 co-localizes with the plasma membrane in the presence of TGF-β. RLE-6TN cells were treated with TGF-β for 10 h and processed for detection of MMP-14 by immunofluorescence staining and confocal microscopy. Staining of the cytoskeleton with β-actin specific antibodies was performed to detect the cellular boundaries. The nuclei were stained with DAPI. IgG controls were performed with naïve rabbit or mouse primary antibodies. Scale bar = 20 μm; scale bar of the zoom = 10 μm. Green: MMP-14; red: β-actin; blue: DAPI.
Fig. 10.
Fig. 10.
Megalin interacts with MMP-2 and MMP-14 at the plasma membrane. RLE-6TN cells were treated with TGF-β (20 ng/ml) for 10 h and crude plasma membrane fractions were obtained by centrifugation from whole cell lysates. Proteins from the crude plasma membrane fraction were extracted and immunoprecipitation (IP) with specific antibodies for megalin performed. Co-IP was assessed by immunoblotting with specific antibodies for MMP-2 (A) or MMP-14 (B). Reverse co-IP experiments were also performed as described above but with an IP with MMP-2 (C) or MMP-14 (D) specific antibodies. Co-IP was assessed by immunoblotting with a specific antibody for megalin. Representative blots are shown; n = 5.
Fig. 11.
Fig. 11.
Silencing of MMP-2, -9, or -14 prevents TGF-β-induced reduction of megalin cell surface abundance and restores albumin binding and uptake. RLE-6TN cells were transfected with MMP-2 (A), -9 (B), or -14 (C) siRNA for 72 h and treated with TGF-β (20 ng/ml) for 10 h. Megalin cell surface stability was measured by biotin-streptavidin pulldown assay and detected by SDS-PAGE and IB. D: RLE-6TN cells were treated as described above and subsequently incubated with FITC-albumin, cell surface-bound and taken-up fractions were collected, and FITC fluorescence was quantified. Fluorescence readouts were normalized to total protein amount from the taken-up fraction. Results are shown as means ± SE. Two-way ANOVA and Šidák’s multiple comparisons, *P < 0.05; n = 5. Scr, scrambled siRNA; PD, pulldown; KD, knockdown.

Similar articles

Cited by

References

    1. Bachofen M, Weibel ER. Structural alterations of lung parenchyma in the adult respiratory distress syndrome. Clin Chest Med : 35–56, 1982. - PubMed
    1. Berthiaume Y, Albertine KH, Grady M, Fick G, Matthay MA. Protein clearance from the air spaces and lungs of unanesthetized sheep over 144 h. J Appl Physiol (1985) : 1887–1897, 1989. - PubMed
    1. Biemesderfer D. Regulated intramembrane proteolysis of megalin: linking urinary protein and gene regulation in proximal tubule? Kidney Int : 1717–1721, 2006. doi:10.1038/sj.ki.5000298. - DOI - PubMed
    1. Biemesderfer D, DeGray B, Aronson PS. Active (9.6 s) and inactive (21 s) oligomers of NHE3 in microdomains of the renal brush border. J Biol Chem : 10161–10167, 2001. doi:10.1074/jbc.M008098200. - DOI - PubMed
    1. Biemesderfer D, Pizzonia J, Abu-Alfa A, Exner M, Reilly R, Igarashi P, Aronson PS. NHE3: a Na+/H+ exchanger isoform of renal brush border. Am J Physiol : F736–F742, 1993. - PubMed

MeSH terms

Substances

LinkOut - more resources