

Fatigability, Exercise Intolerance, and Abnormal Skeletal Muscle Energetics in Heart Failure
- PMID: 28705910
- PMCID: PMC5627361
- DOI: 10.1161/CIRCHEARTFAILURE.117.004129
Fatigability, Exercise Intolerance, and Abnormal Skeletal Muscle Energetics in Heart Failure
Abstract
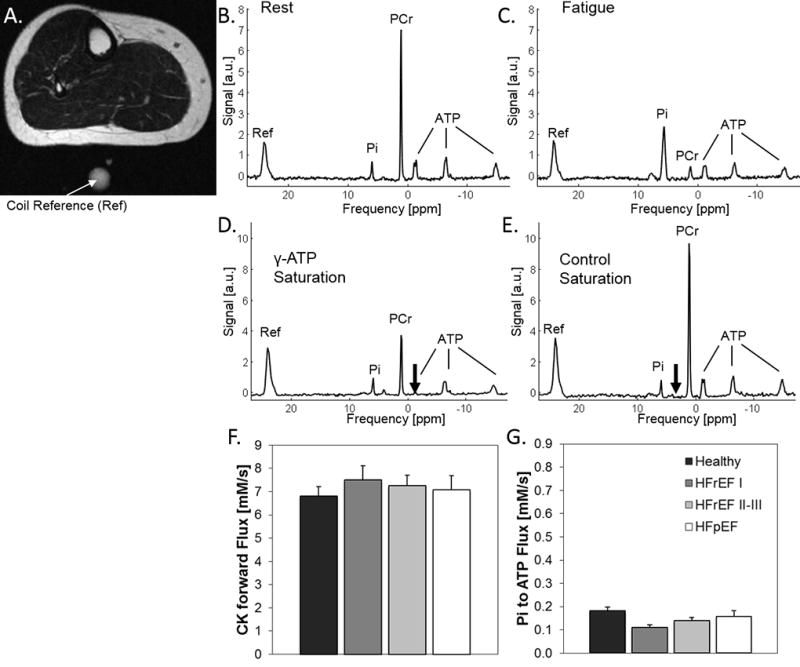
Background: Among central and peripheral factors contributing to exercise intolerance (EI) in heart failure (HF), the extent to which skeletal muscle (SM) energy metabolic abnormalities occur and contribute to EI and increased fatigability in HF patients with reduced or preserved ejection fraction (HFrEF and HFpEF, respectively) are not known. An energetic plantar flexion exercise fatigability test and magnetic resonance spectroscopy were used to probe the mechanistic in vivo relationships among SM high-energy phosphate concentrations, mitochondrial function, and EI in HFrEF and HFpEF patients and in healthy controls.
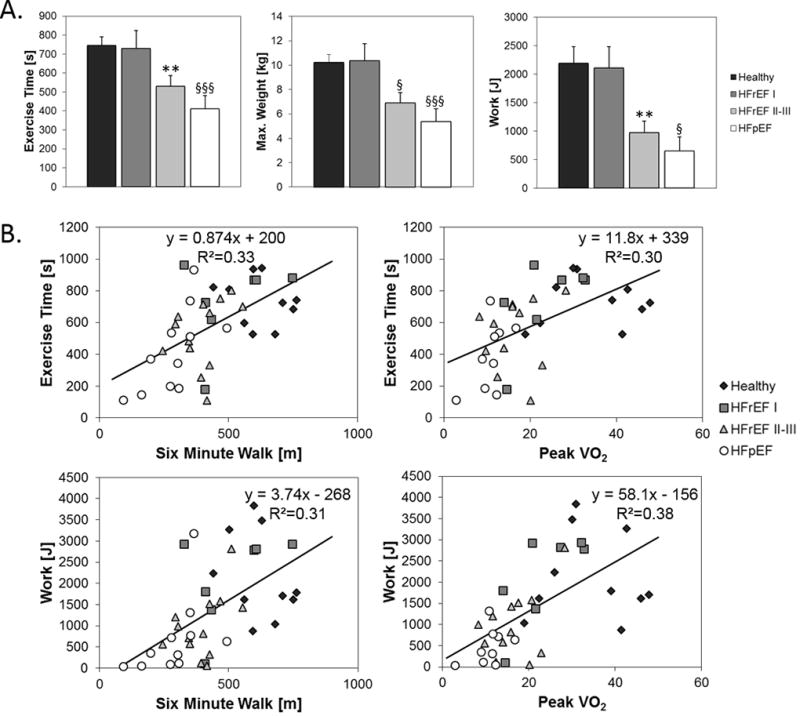
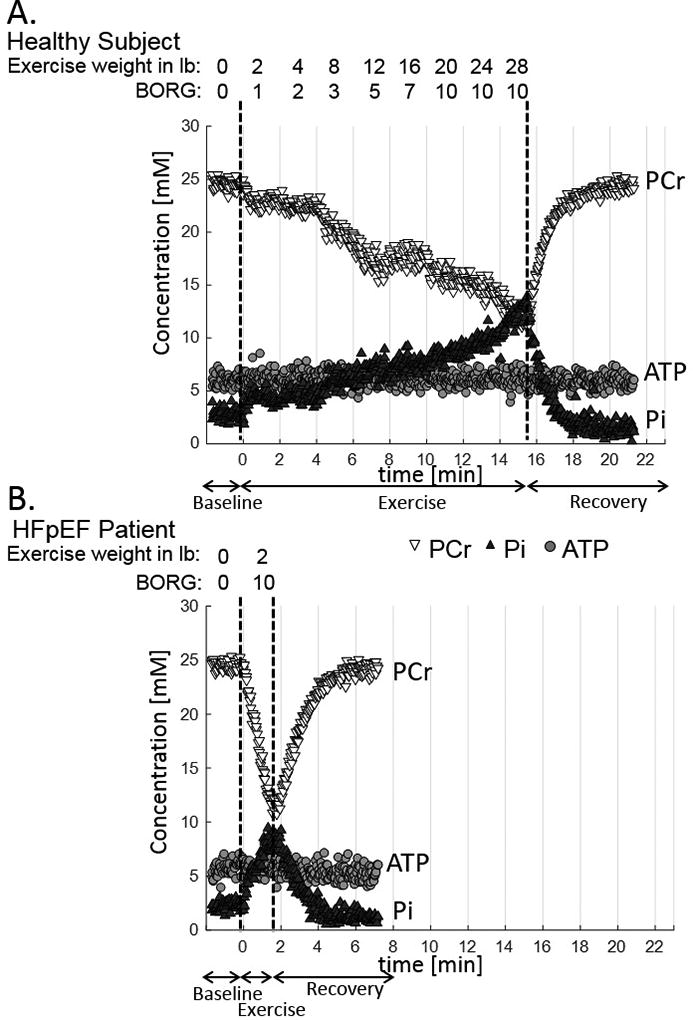
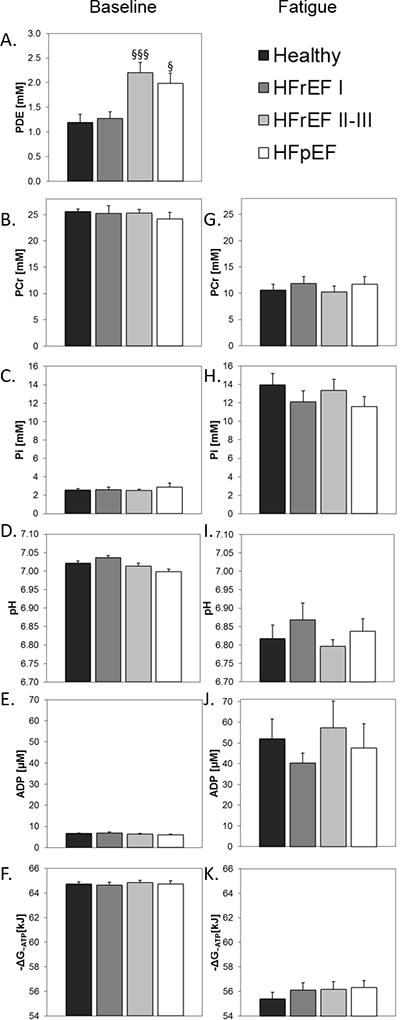
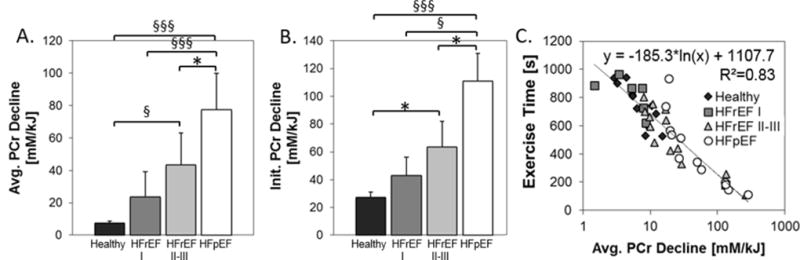
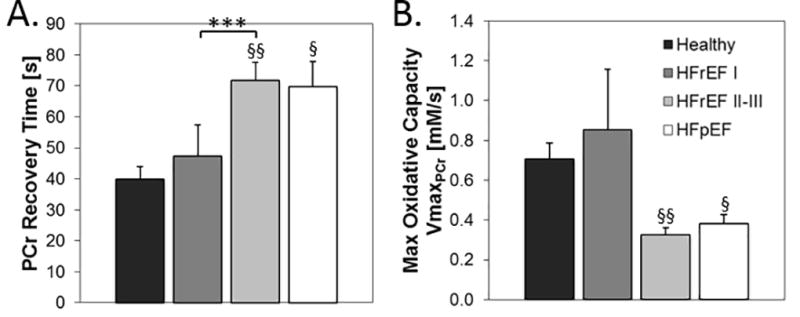
Methods and results: Resting SM high-energy phosphate concentrations and ATP flux rates were normal in HFrEF and HFpEF patients. Fatigue occurred at similar SM energetic levels in all subjects, consistent with a common SM energetic limit. Importantly, HFrEF New York Heart Association class II-III patients with EI and high fatigability exhibited significantly faster rates of exercise-induced high-energy phosphate decline than did HFrEF patients with low fatigability (New York Heart Association class I), despite similar left ventricular ejection fractions. HFpEF patients exhibited severe EI, the most rapid rates of high-energy phosphate depletion during exercise, and impaired maximal oxidative capacity.
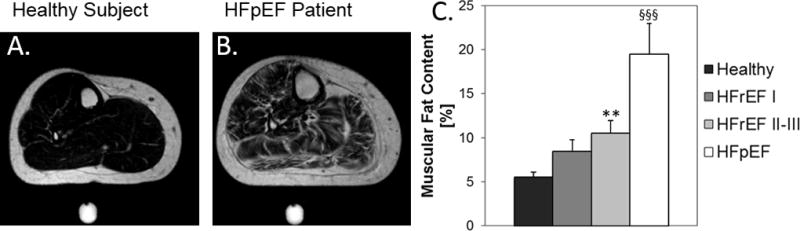
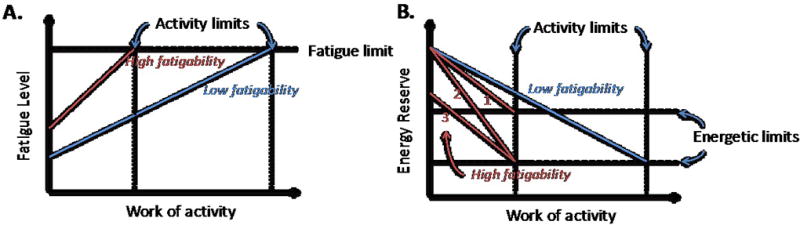
Conclusions: Symptomatic fatigue during plantar flexion exercise occurs at a common energetic limit in all subjects. HFrEF and HFpEF patients with EI and increased fatigability manifest early, rapid exercise-induced declines in SM high-energy phosphates and reduced oxidative capacity compared with healthy and low-fatigability HF patients, suggesting that SM metabolism is a potentially important target for future HF treatment strategies.
Keywords: magnetic resonance imaging; magnetic resonance spectroscopy; skeletal muscle.
© 2017 American Heart Association, Inc.
Figures
Comment in
-
Making the Case for Skeletal Muscle Myopathy and Its Contribution to Exercise Intolerance in Heart Failure With Preserved Ejection Fraction.Circ Heart Fail. 2017 Jul;10(7):e004281. doi: 10.1161/CIRCHEARTFAILURE.117.004281. Circ Heart Fail. 2017. PMID: 28705911 Free PMC article. No abstract available.
Similar articles
-
Skeletal Muscle Quantity Versus Quality in Heart Failure: Exercise Intolerance and Outcomes in Older Patients With HFpEF Are Related to Abnormal Skeletal Muscle Metabolism Rather Than Age-Related Skeletal Muscle Loss.Circ Heart Fail. 2025 Jul;18(7):e012512. doi: 10.1161/CIRCHEARTFAILURE.124.012512. Epub 2025 Jun 19. Circ Heart Fail. 2025. PMID: 40534551
-
Exercise intolerance and rapid skeletal muscle energetic decline in human age-associated frailty.JCI Insight. 2020 Oct 15;5(20):e141246. doi: 10.1172/jci.insight.141246. JCI Insight. 2020. PMID: 32941181 Free PMC article.
-
Skeletal muscle alterations in HFrEF vs. HFpEF.Curr Heart Fail Rep. 2017 Dec;14(6):489-497. doi: 10.1007/s11897-017-0361-9. Curr Heart Fail Rep. 2017. PMID: 28940089 Review.
-
Mechanisms of exercise intolerance in heart failure with preserved ejection fraction: the role of abnormal peripheral oxygen extraction.Circ Heart Fail. 2015 Mar;8(2):286-94. doi: 10.1161/CIRCHEARTFAILURE.114.001825. Epub 2014 Oct 24. Circ Heart Fail. 2015. PMID: 25344549 Free PMC article.
-
Skeletal muscle abnormalities in heart failure with preserved ejection fraction.Heart Fail Rev. 2023 Jan;28(1):157-168. doi: 10.1007/s10741-022-10219-9. Epub 2022 Mar 30. Heart Fail Rev. 2023. PMID: 35353269 Review.
Cited by
-
Left ventricular concentric remodeling and impaired cardiorespiratory fitness in patients with heart failure and preserved ejection fraction.Minerva Cardiol Angiol. 2021 Aug;69(4):438-445. doi: 10.23736/S2724-5683.20.05295-0. Epub 2020 Sep 30. Minerva Cardiol Angiol. 2021. PMID: 32996304 Free PMC article.
-
Cardiovascular Magnetic Resonance in the Oncology Patient.JACC Cardiovasc Imaging. 2018 Aug;11(8):1150-1172. doi: 10.1016/j.jcmg.2018.06.004. JACC Cardiovasc Imaging. 2018. PMID: 30092971 Free PMC article. Review.
-
Skeletal Muscle Myopathy in Heart Failure: the Role of Ejection Fraction.Curr Cardiol Rep. 2018 Sep 26;20(11):116. doi: 10.1007/s11886-018-1056-x. Curr Cardiol Rep. 2018. PMID: 30259199 Review.
-
Micronutrient deficiencies in heart failure: Mitochondrial dysfunction as a common pathophysiological mechanism?J Intern Med. 2022 Jun;291(6):713-731. doi: 10.1111/joim.13456. Epub 2022 Feb 9. J Intern Med. 2022. PMID: 35137472 Free PMC article. Review.
-
SGLT2 inhibitors: further evidence for heart failure with preserved ejection fraction as a metabolic disease?J Clin Invest. 2021 Dec 1;131(23):e156309. doi: 10.1172/JCI156309. J Clin Invest. 2021. PMID: 34850740 Free PMC article. No abstract available.
References
-
- Pina IL, Apstein CS, Balady GJ, Belardinelli R, Chaitman BR, Duscha BD, Fletcher BJ, Fleg JL, Myers JN, Sullivan MJ. Exercise and heart failure: A statement from the American Heart Association Committee on exercise, rehabilitation, and prevention. Circulation. 2003;107:1210–1225. - PubMed
-
- Stevenson LW, Sietsema K, Tillisch JH, Lem V, Walden J, Kobashigawa JA, Moriguchi J. Exercise capacity for survivors of cardiac transplantation or sustained medical therapy for stable heart failure. Circulation. 1990;81:78–85. - PubMed
-
- Haykowsky MJ, Brubaker PH, Stewart KP, Morgan TM, Eggebeen J, Kitzman DW. Effect of endurance training on the determinants of peak exercise oxygen consumption in elderly patients with stable compensated heart failure and preserved ejection fraction. J Am Coll Cardiol. 2012;60:120–128. - PMC - PubMed
-
- Kao AC, Van Trigt P, 3rd, Shaeffer-McCall GS, Shaw JP, Kuzil BB, Page RD, Higginbotham MB. Central and peripheral limitations to upright exercise in untrained cardiac transplant recipients. Circulation. 1994;89:2605–2615. - PubMed
-
- Eldadah BA. Fatigue and fatigability in older adults. PM R. 2010;2:406–413. - PubMed
MeSH terms
Substances
Grants and funding
LinkOut - more resources
Full Text Sources
Other Literature Sources
Medical
Research Materials
Miscellaneous
