. 2017 Oct;76(10):1764-1773.
doi: 10.1136/annrheumdis-2017-211396. Epub 2017 Jul 13.

Microarray analysis of bone marrow lesions in osteoarthritis demonstrates upregulation of genes implicated in osteochondral turnover, neurogenesis and inflammation

Affiliations

Microarray analysis of bone marrow lesions in osteoarthritis demonstrates upregulation of genes implicated in osteochondral turnover, neurogenesis and inflammation

Anasuya Kuttapitiya et al. Ann Rheum Dis. 2017 Oct.

Abstract

Objective: Bone marrow lesions (BMLs) are well described in osteoarthritis (OA) using MRI and are associated with pain, but little is known about their pathological characteristics and gene expression. We evaluated BMLs using novel tissue analysis tools to gain a deeper understanding of their cellular and molecular expression.

Methods: We recruited 98 participants, 72 with advanced OA requiring total knee replacement (TKR), 12 with mild OA and 14 non-OA controls. Participants were assessed for pain (using Western Ontario and McMaster Universities Osteoarthritis Index (WOMAC)) and with a knee MRI (using MOAKS). Tissue was then harvested at TKR for BML analysis using histology and tissue microarray.

Results: The mean (SD) WOMAC pain scores were significantly increased in advanced OA 59.4 (21.3) and mild OA 30.9 (20.3) compared with controls 0.5 (1.28) (p<0.0001). MOAKS showed all TKR tissue analysed had BMLs, and within these lesions, bone marrow volume was starkly reduced being replaced by dense fibrous connective tissue, new blood vessels, hyaline cartilage and fibrocartilage. Microarray comparing OA BML and normal bone found a significant difference in expression of 218 genes (p<0.05). The most upregulated genes included stathmin 2, thrombospondin 4, matrix metalloproteinase 13 and Wnt/Notch/catenin/chemokine signalling molecules that are known to constitute neuronal, osteogenic and chondrogenic pathways.

Conclusion: Our study is the first to employ detailed histological analysis and microarray techniques to investigate knee OA BMLs. BMLs demonstrated areas of high metabolic activity expressing pain sensitisation, neuronal, extracellular matrix and proinflammatory signalling genes that may explain their strong association with pain.

Keywords: Chemokines; Chondrocytes; Inflammation; Knee Osteoarthritis; Magnetic Resonance Imaging.


Conflict of interest statement

Competing interests: None declared.

Figures
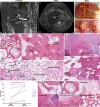
Figure 1
Figure 1
(A) Coronal plane of MRI scan visualising BML and associated cyst. (B) Axial plane of MRI scan presenting BML and associated cyst. (C) Macroscopic view of tibial BML and cystic area. (D) Image of cross section cut through BML and cyst localised by MRI revealing a gelatinous aggregate. (E) H&E staining of cystic region presenting cellular infiltrate in marrow spaces. (F) H&E staining of subchondral cyst forming. (G) H&E staining of BML region with vascular proliferation and cellular infiltration. (H) H&E staining of BML visualising a chondrification centre near the tidemark. (I) H&E staining of adipocyte in bone compartment with a soft tissue infiltrate working through osteoid network. (J) H&E staining of BML showing areas of thickened trabecular adjacent to thinning trabeculae. (K) H&E staining of BML demonstrating areas of fibrotic cartilage formation within the subchondral bone compartment. (L) Quantification of histology analysing 50 BML FOVs and 40 non-BML (NBML) FOVs for blood vessels (BV), cartilage within bone compartment (Cart), cysts (Cys), myxoid/fibrous tissue (M/F), cellular infiltrate (Inf) and trabecular thickening (TT) (n=4). A percentage for the presence of each histological feature was determined for each group. Significance was tested between the groups using Friedman test (*p<0.05). (M) Magnification of each histological change within the bone compartment: BV within subchondral bone, Cart within bone compartment with a chondrification centre, Cys within subchondral bone, M/F adjacent to subchondral bone, Inf within the osteoid network and TT. BML, bone marrow lesion; FOV, field of view.
Figure 2
Figure 2
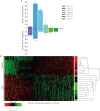
(A) Bar chart presenting the most significantly upregulated and downregulated entities by fold change (FC). One hundred twenty-eight entities were found to be upregulated and 90 were downregulated. The mean WOMAC pain score in the OA microarray group was 61.4, and all subjects in the OA array group had a MOAKS BML score of at least 1, with cartilage and synovitis scores of at least 2. (B) Pearson’s correlation hierarchical clustering of 218 genes clearly segregating the OA BML group from the control group.
Figure 3
Figure 3
(A) Gene ontology analysis of 218 differentially expressed entities found 166 genes associated with 59 canonical pathways. Pie chart of the 24 predominant pathways identified. The main significant correlation for WOMAC pain with gene correlation was for MMP-13 (p<0.05). (B) Network analysis was performed on the differentially expressed genes by ingenuity pathway analysis (IPA). MMP-13, matrix metalloproteinase 13; WOMAC, Western Ontario and McMaster Universities Osteoarthritis Index.
Figure 4
Figure 4
qPCR validation for stathmin 2 (STMN2), thrombospondin 4 (THBS4), matrix metalloproteinase 13 (MMP-13) and osteomodulin (OMD) of OA BML compared non-BML tissue and control bone. STMN2, THBS4 and MMP-13 were selected as they were among the most upregulated genes from the microarray. Osteomodulin was selected as a bone-specific marker as it is involved in bone homeostasis (**p<0.005, ***p<0.0005). BML, bone marrow lesion; NBML, non-bone marrow lesion; OA, osteoarthritis.

References

    1. Lawrence RC, Felson DT, Helmick CG, et al. . Estimates of the prevalence of arthritis and other rheumatic conditions in the United States. Part II. Arthritis Rheum 2008;58:26–35. 10.1002/art.23176 - DOI - PMC - PubMed
    1. Nicholls E, Thomas E, van der Windt DA, et al. . Pain trajectory groups in persons with, or at high risk of, knee osteoarthritis: findings from the knee clinical Assessment Study and the Osteoarthritis Initiative. Osteoarthritis Cartilage 2014;22:2041–50. 10.1016/j.joca.2014.09.026 - DOI - PMC - PubMed
    1. Sofat N, Ejindu V, Kiely P. What makes OA painful? The evidence for peripheral and central pain processing Rheumatology. Rheumatology 2011;50:2157–65. - PubMed
    1. Roemer FW, Kassim Javaid M, Guermazi A, et al. . Anatomical distribution of synovitis in knee osteoarthritis and its association with joint effusion assessed on non-enhanced and contrast-enhanced MRI. Osteoarthritis Cartilage 2010;18:1269–74. 10.1016/j.joca.2010.07.008 - DOI - PubMed
    1. Roy S, Meachim G. Chondrocyte ultrastructure in adult human articular cartilage. Ann Rheum Dis 1968;27:544–58. 10.1136/ard.27.6.544 - DOI - PMC - PubMed

MeSH terms