. 2017 Jul 14;357(6347):168-175.
doi: 10.1126/science.aan0693.

Global analysis of protein folding using massively parallel design, synthesis, and testing

Affiliations

Global analysis of protein folding using massively parallel design, synthesis, and testing

Gabriel J Rocklin et al. Science. .

Abstract

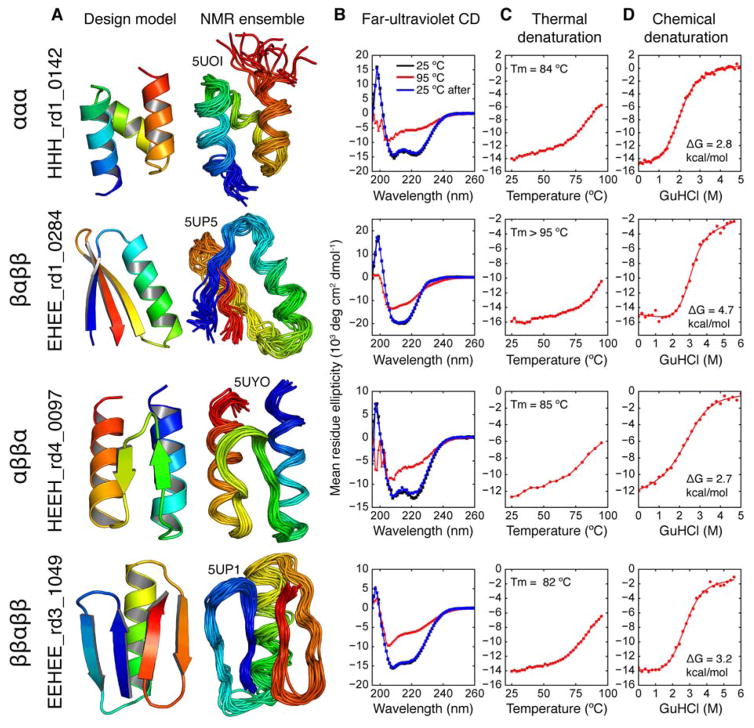
Proteins fold into unique native structures stabilized by thousands of weak interactions that collectively overcome the entropic cost of folding. Although these forces are "encoded" in the thousands of known protein structures, "decoding" them is challenging because of the complexity of natural proteins that have evolved for function, not stability. We combined computational protein design, next-generation gene synthesis, and a high-throughput protease susceptibility assay to measure folding and stability for more than 15,000 de novo designed miniproteins, 1000 natural proteins, 10,000 point mutants, and 30,000 negative control sequences. This analysis identified more than 2500 stable designed proteins in four basic folds-a number sufficient to enable us to systematically examine how sequence determines folding and stability in uncharted protein space. Iteration between design and experiment increased the design success rate from 6% to 47%, produced stable proteins unlike those found in nature for topologies where design was initially unsuccessful, and revealed subtle contributions to stability as designs became increasingly optimized. Our approach achieves the long-standing goal of a tight feedback cycle between computation and experiment and has the potential to transform computational protein design into a data-driven science.


Figures

Fig. 1
Fig. 1. Yeast display enables massively parallel measurement of protein stability
(A) Each yeast cell displays many copies of one test protein fused to Aga2. The c-terminal c-Myc tag is labeled with a fluorescent antibody. Protease cleavage of the test protein (or other cleavage) leads to loss of the tag and loss of fluorescence. (B) Libraries of 104 unique sequences are sorted by flow cytometry. Most cells show high protein expression (measured by fluorescence) before proteolysis (blue). Only some cells retain fluorescence after proteolysis; those above a threshold (shaded green region) are collected for deep sequencing analysis. (C) Sequential sorting at increasing protease concentrations separates proteins by stability. Each sequence in a library of 19,726 proteins is shown as a gray line tracking the change in population fraction (enrichment) of that sequence, normalized to each sequence’s population in the starting (pre-selection) library. Enrichment traces for seven proteins at different stability levels are highlighted in color. (D) EC50s for the seven highlighted proteins in (C) are plotted on top of the overall density of the 46,187 highest-confidence EC50 measurements from design rounds 1–4. (E) Same data as at left, showing that stability scores (EC50 values corrected for intrinsic proteolysis rates) correlate better than raw EC50s between the proteases. (F–I) Stability scores measured in high-throughput correlate with individual folding stability measurements for mutants of four small proteins. The wild-type sequence in each set is highlighted as a red circle. Credible intervals for all EC50 measurements are provided in supplementary materials. (F) Pin1 ΔGunf data at 40°C from (31) by thermal denaturation (G) hYAP65 Tm data from (5, 10) (H) Villin HP35 ΔGunf data at 25°C from (7, 11) by urea denaturation (I) BBL ΔGunf data at 10°C from (8) by thermal denaturation.
Fig. 2
Fig. 2. Iterative, high-throughput computational design generates thousands of stable proteins and reveals stability determinants
(A) Stability data for designs and control sequences separated by topology (ααα, βαββ, αββα, and ββαββ) and by design round (–4). For each round and topology, the upper plot shows the total number of designed proteins (y-axis) exceeding a given stability score threshold (x-axis, stability increases left to right). The number of designs tested (top left) may be lower than the number originally ordered (described in the text) due to removal of low-confidence data (see Methods: EC50 estimation). Lower plots show the relative amounts of the three categories of sequences (y-axis) exceeding a given stability score threshold (x-axis), as above. Round 1 categories were designed sequences (colors), fully scrambled sequences (“Scramb.”, light grey), and hydrophobic-polar pattern-preserving scrambled sequences (“Pattern”, dark grey). Round 2–4 categories were designs, patterned scrambles, and point mutants of designs with single Asp mutations expected to be destabilizing (“BuryAsp”, yellow). (BG) Determinants of stability from Rounds 1–3 (as labeled in A). Colored histograms show the number of tested designs (left y-axis) in each bin for the structural metric on the x-axis. Black lines show the success rate (fraction of designs tested with stability score > 1.0, right y-axis) within a moving window the size of the histogram bin-width, with a shaded 95% confidence interval from bootstrapping. (B,D,E,F) Design success as a function of buried nonpolar surface area (NPSA) from hydrophobic residues. (C) Design success as a function of geometric agreement between 9-residue fragments of similar sequences in the design models and natural proteins (see text and Methods: Fragment analysis), measured in average root-mean-squared deviation (RMSD). (G) Design success as a function of Rosetta total energy. (H) Overall success rate and number of successful designs per round (stability score > 1.0 with both proteases) for all topologies across all rounds. (I) Design success as a function of predicted success according to the topology-specific logistic regression models used to select Round 4 designs for testing (trained on data from Rounds 1–3). As in B–G, colored histograms indicate the number of tested designs at each level of predicted success (left y-axis), and the black line indicates the success rate (right y-axis). Individual success rates for each topology shown in Fig. S8.
Fig. 3
Fig. 3. Biophysical characterization of designed minimal proteins
(A) Design models and NMR solution ensembles for designed minimal proteins. PDB codes are given above each NMR ensemble. (B) Far-ultraviolet circular dichroism (CD) spectra at 25°C (black), 95°C (red), and 25°C following melting (blue). (C) Thermal melting curves measured by CD at 220 nm. Melting temperatures determined using the derivative of the curve. (D) Chemical denaturation in GuHCl measured by CD at 220 nm and 25°C. Unfolding free energies determined by fitting to a two-state model (red solid line). CD data for all 22 purified proteins are given in Table S1 and Fig. S6.
Fig. 4
Fig. 4. Comprehensive mutational analysis of stability in designed and natural proteins
(A) Average change in stability due to mutating each position in thirteen designed proteins, depicted on the design model structures. Positions where mutations are most destabilizing are colored yellow and shown in stick representation, positions where mutations have little effect are colored blue. Each protein’s color scale is different to emphasize the relative importance of positions; full data for all proteins is shown in Fig. S10. (B) As in (A) for villin HP35. In red, W64, K70, L75, and F76 (HP35 consists of residues 42–76) have little effect on stability but are conserved for function (F-actin binding). (C) As in (A) for pin1 WW-domain, shown bound to a doubly-phosphorylated peptide. In red, S16 is conserved and critical for function but is destabilizing compared with mutations at that position. (D) As in (A) for hYAP65 L30K, shown bound to a Smad7 derived peptide. In red, H32, T37, and W39 form the peptide recognition motif and are conserved but unimportant for stability. (E–L) Average stability effect of each amino acid at different categories of surface positions, in units of stability score (positive meaning stabilizing and negative destabilizing). The average stability of all amino acids in each panel was set to zero. The number of individual positions examined in each category is listed in parentheses with the category name. The average stability effect of the original “wild-type” designed residue (unique to each particular site within a category) is shown by a black star. Error bars indicate the 50% confidence interval for the average stability effect, calculated using bootstrapping. See Methods: Mutational stability effects for a full description of the analysis.
Fig. 5
Fig. 5. Comparison of naturally occurring and designed protein stability
Designed and naturally occurring proteins are separated into bins by stability score (y-axis). The total number of designed proteins in each bin is shown by the colored bar, subdivided by topology from left to right as follows: ααα (green), βαββ (blue), αββα (violet), ββαββ (red). The total number of naturally occurring proteins with PDB structures (lacking disulfides) in each bin is shown by the black bar.

Comment in

  • How do miniproteins fold?
    Woolfson DN, Baker EG, Bartlett GJ. Woolfson DN, et al. Science. 2017 Jul 14;357(6347):133-134. doi: 10.1126/science.aan6864. Science. 2017. PMID: 28706028 No abstract available.
  • Protein design: I like to fold it, fold it.
    Deane C. Deane C. Nat Chem Biol. 2017 Aug 18;13(9):923. doi: 10.1038/nchembio.2467. Nat Chem Biol. 2017. PMID: 28820874 No abstract available.

References

    1. Dill KA. Dominant forces in protein folding. Biochemistry. 1990;29:7133–7155. - PubMed
    1. Robertson AD, Murphy KP. Protein Structure and the Energetics of Protein Stability. Chem Rev. 1997;97:1251–1268. - PubMed
    1. Nick Pace C, Martin Scholtz J, Grimsley RG. Forces stabilizing proteins. FEBS Lett. 2014;588:2177–2184. - PMC - PubMed
    1. Gelman H, Gruebele M. Fast protein folding kinetics. Q Rev Biophys. 2014;47:95–142. - PMC - PubMed
    1. Jiang X, Kowalski J, Kelly JW. Increasing protein stability using a rational approach combining sequence homology and structural alignment: Stabilizing the WW domain. Protein Sci. 2001;10:1454–1465. - PMC - PubMed

Publication types