. 2017 Jul 13;7(1):5311.
doi: 10.1038/s41598-017-05667-5.

Suppressed autophagic response underlies augmentation of renal ischemia/reperfusion injury by type 2 diabetes

Affiliations

Suppressed autophagic response underlies augmentation of renal ischemia/reperfusion injury by type 2 diabetes

Shingo Muratsubaki et al. Sci Rep. .

Abstract

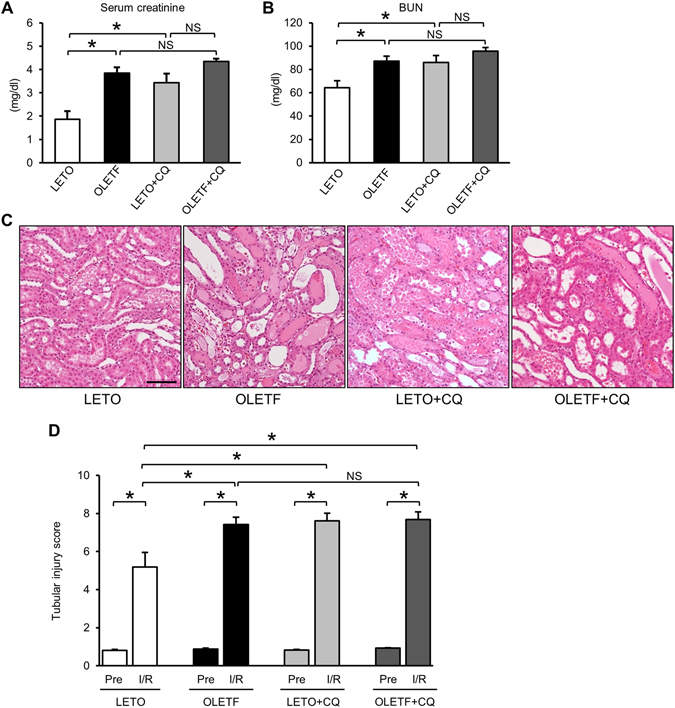
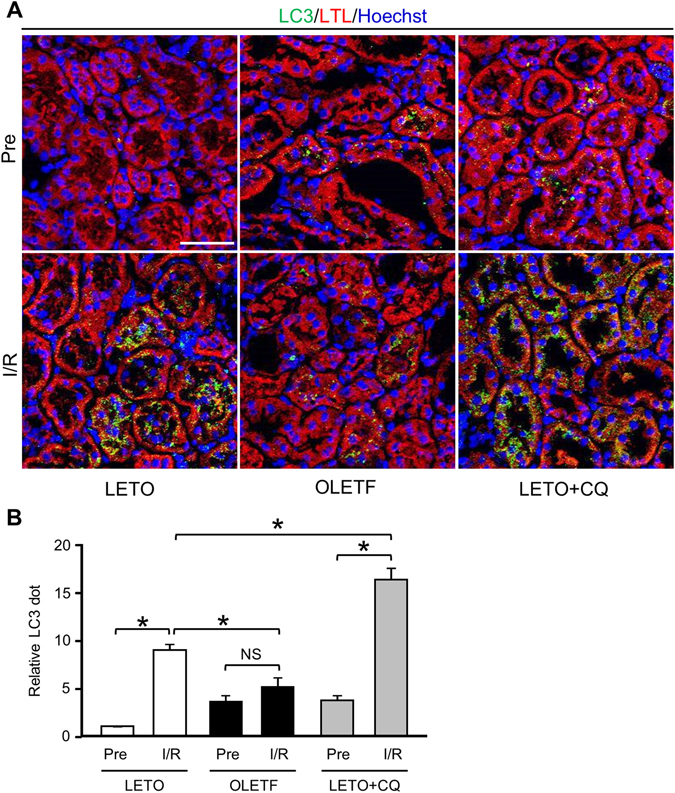
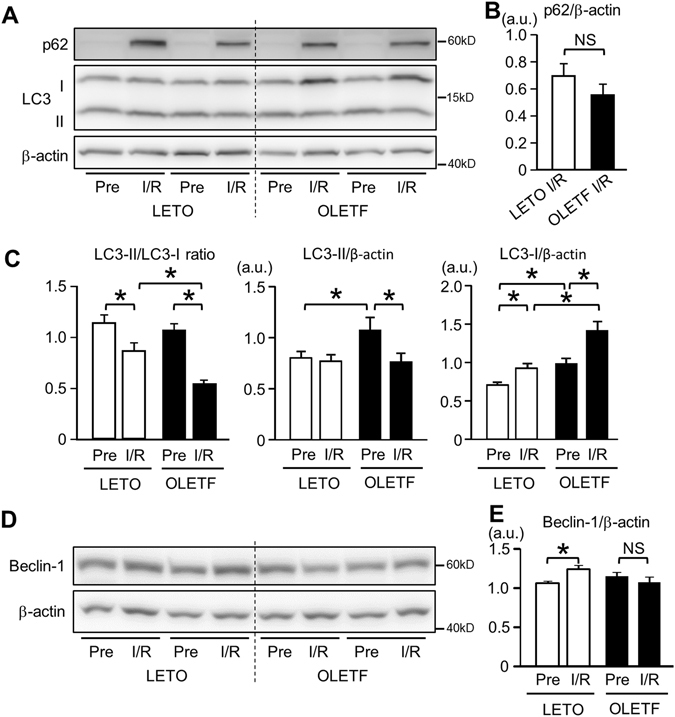
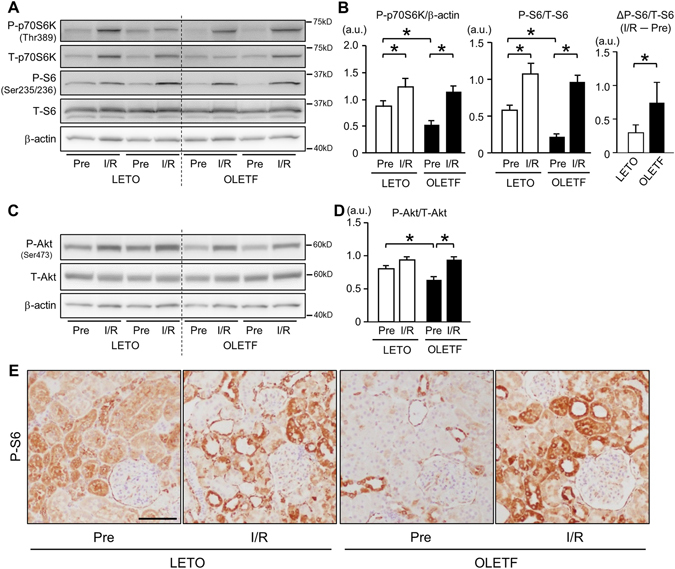
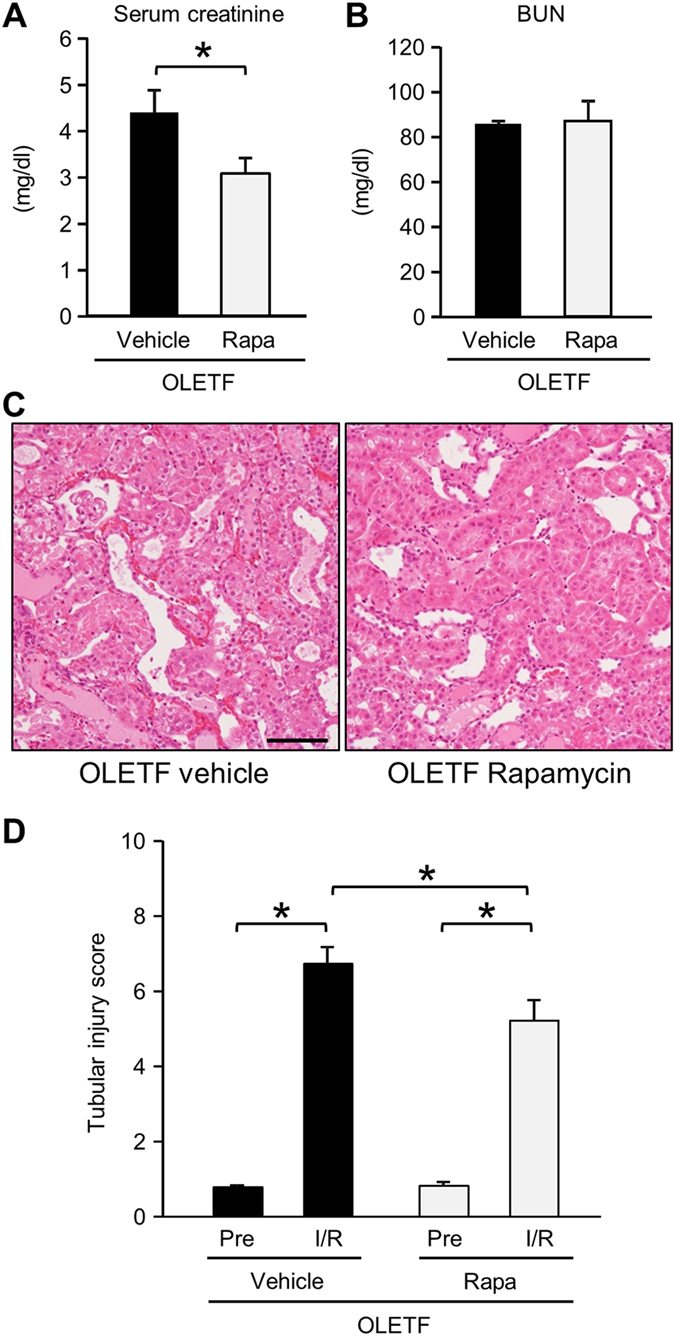
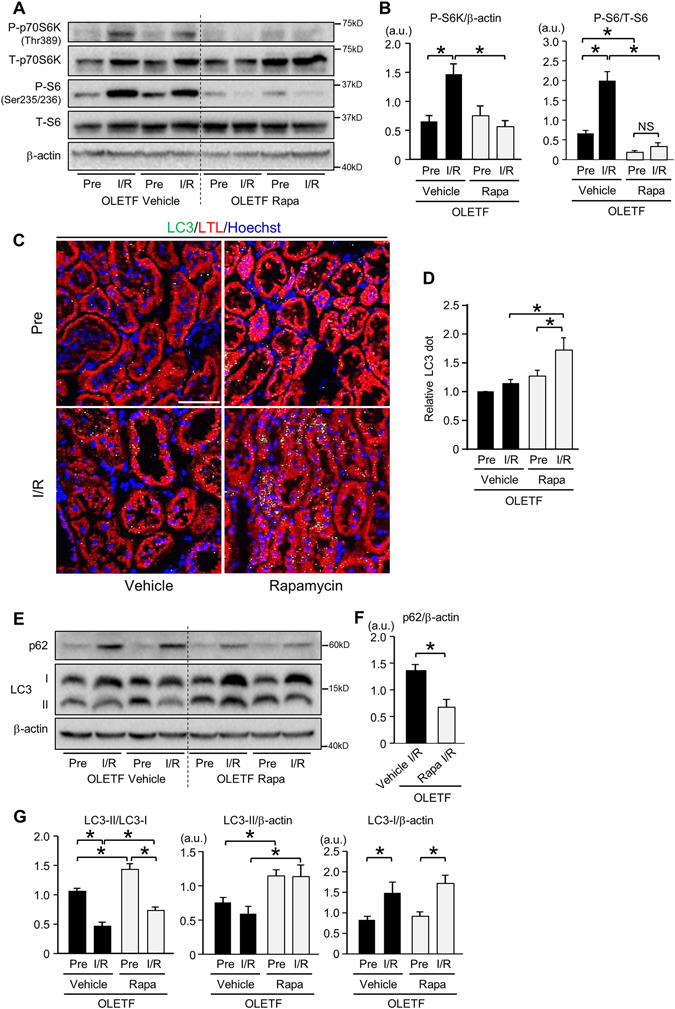
Diabetes mellitus is a major risk factor for acute kidney injury (AKI). Here, we hypothesized that suppression of autophagic response underlies aggravation of renal ischemia/reperfusion (I/R) injury by type 2 diabetes mellitus (T2DM). In OLETF, a rat model of T2DM, and its non-diabetic control, LETO, AKI was induced by unilateral nephrectomy and 30-min occlusion and 24-h reperfusion of the renal artery in the contralateral kidney. Levels of serum creatinine and blood urea nitrogen and tubular injury score after I/R were significantly higher in OLETF than in LETO. Administration of chloroquine, a widely used autophagy inhibitor, aggravated I/R-induced renal injury in LETO, but not in OLETF. In contrast to LETO, OLETF exhibited no increase in autophagosomes in the proximal tubules after I/R. Immunoblotting showed that I/R activated the AMPK/ULK1 pathway in LETO but not in OLETF, and mTORC1 activation after I/R was enhanced in OLETF. Treatment of OLETF with rapamycin, an mTORC1 inhibitor, partially restored autophagic activation in response to I/R and significantly attenuated I/R-induced renal injury. Collectively, these findings indicate that suppressed autophagic activation in proximal tubules by impaired AMPK/ULK1 signaling and upregulated mTORC1 activation underlies T2DM-induced worsening of renal I/R injury.


Conflict of interest statement

The authors declare that they have no competing interests.

Figures

Figure 1
Figure 1
Type 2 diabetes and chloroquine increased susceptibility of the kidney to ischemia/reperfusion injury. Serum creatinine (A) and blood urea nitrogen (BUN) (B) levels of LETO (N = 12), OLETF (N = 12), LETO treated with chloroquine (LETO+CQ, N = 8), and OLETF treated with chloroquine (OLETF+CQ, N = 10) at 24 h after ischemia and reperfusion. (C) Representative images of hematoxylin-eosin staining of renal tissues at 24 h after ischemia/reperfusion. (D) Tubular injury score of renal tissues of before ischemia (Pre) and 24 h after ischemia/reperfusion (I/R) in the four groups. *P < 0.05. Scale bar, 100 μm. NS = not significant.
Figure 2
Figure 2
Autophagic response in proximal tubular cells after ischemia/reperfusion was attenuated in OLETF. (A) Representative immunofluorescence images of LC3 (green) and the proximal tubular marker lotus tetragonolobus lectin conjugated with Texas Red (LTL; red) in the kidneys of LETO, OLETF, and LETO treated with chloroquine (LETO+CQ). Nuclei were stained with Hoechst33342. Pre: pre-ischemia, I/R: 24 h after ischemia/reperfusion. (B) Summary data of LC3 dot numbers. N = 4 in each group. *P < 0.05, NS = not significant. Scale bar, 50 μm.
Figure 3
Figure 3
Activation of renal autophagy after ischemia/reperfusion was reduced in OLETF. (A) Representative immunoblot images for p62 and LC3 in the kidney. Summary data for p62 (B) and LC3-II/LC3-I ratio, LC3-II, and LC3-I (C) in total kidney tissues before ischemia (Pre) and 24 h after ischemia/reperfusion (I/R). Ratio of LC3-II to LC3-I after I/R was significantly reduced in OLETF. Representative immunoblots for beclin-1 (D) and summary data (E) in kidney tissues. Beclin-1 protein level was increased after I/R only in LETO. N = 8 in each group. *P < 0.05, NS = not significant.
Figure 4
Figure 4
Analysis of AMPK/ULK1 signal pathways. (A) Representative immunoblots for phospho-Thr172 and total AMPKα in renal tissues before ischemia and 24 h after reperfusion in LETO and OLETF. Pre: pre-ischemia, I/R: 24 h after ischemia/reperfusion. (B) Summary data for phospho-Thr172 AMPKα level normalized by β-actin. Phospho-AMPKα level was significantly increased after I/R in LETO but not in OLETF. (C) Representative blots for phospho-Ser555 and total ULK1. The blot of β-actin is identical to that in Fig. 3D because blots of both beclin-1 and ULK1 were from the same membrane. (D) Summary data for phospho-ULK1 level normalized by total ULK1. Phospho-ULK1 level was also elevated after I/R only in LETO. N = 8 in each group. (E) Representative blots for SIRT1 in renal tissues. (F) Summary data for SIRT1 protein level normalized by β-actin. In contrast to LETO, I/R failed to increase SIRT1 protein level in OLETF. N = 6 in each group. *P < 0.05. NS = not significant.
Figure 5
Figure 5
Analysis of Akt/mTORC1 signal pathways. Representative immunoblots (A) and summary data (B) for phospho-Thr389 and total p70S6 kinase (p70S6K), phospho-Ser235/236 and total S6, and actin in renal tissues before ischemia and 24 h after reperfusion in LETO and OLETF. Pre: pre-ischemia, I/R: 24 h after ischemia/reperfusion. (B) Before ischemia, phospho-p70S6K and phospho-S6 levels were reduced in OLETF. Levels of phospho-p70S6K and phospho-S6 were increased after I/R in both groups. The change in phospho-S6 level (ΔP-S6/T-S6) from the pre-ischemic period to 24 h after I/R was greater in OLETF than in LETO. (C) Representative immunoblots for phospho-Ser473 and total Akt. (D) Phospho-Akt level before ischemia was lower in OLETF than in LETO. I/R increased phospho-Akt levels in both OLETF and LETO, and phospho-Akt levels after I/R were similar in LETO and OLETF. N = 8 in each group. (E) Representative images of immunostaining for phospho-S6 in kidney sections before and 24 h after ischemia/reperfusion in LETO and OLETF. Scale bar, 100 μm. *P < 0.05.
Figure 6
Figure 6
Effects of rapamycin on kidney injury after ischemia/reperfusion in OLETF. Levels of serum creatinine (A) and blood urea nitrogen (BUN) (B) 24 h after renal ischemia/reperfusion in OLETF treated with a vehicle (N = 7) or rapamycin (Rapa, 0.25 mg/kg, N = 7) 30 min prior to ischemia in OLETF. (C) Representative images of hematoxylin-eosin staining of renal tissues at 24 h after ischemia/reperfusion. (D) Tubular injury score before ischemia and 24 h after reperfusion in OLETF treated with vehicle or rapamycin. Pre: pre-ischemia, I/R: 24 h after ischemia/reperfusion. *P < 0.05. Scale bar, 100 μm.
Figure 7
Figure 7
Restoration of autophagic response by rapamycin in OLETF. (A) Representative images of immunoblotting for phospho-Thr389 and total p70S6 kinase (p70S6K) and for phospho-Ser235/236 and total S6 of kidney tissues before ischemia and 24 h after reperfusion in OLETF pretreated with a vehicle (N = 7) or rapamycin (N = 7). Pre: pre-ischemia, I/R: 24 h after ischemia/reperfusion, Rapa; rapamycin-treated group. (B) I/R-induced increases in phospho-p70S6K and phospho-S6 levels were completely suppressed by rapamycin. (C) Representative immunofluorescence images of LC3 (green) and the proximal tubular marker lotus tetragonolobus lectin conjugated with Texas Red (LTL; red) in the kidneys from OLETF administered a vehicle or rapamycin. Nuclei were stained with Hoechst33342. (D) Summary data for LC3 dot level. (E) Representative blots for p62 and LC3. (F) Protein level of p62 after I/R was significantly reduced by rapamycin in OLETF. (G) LC3-II/LC3-I ratio after I/R was significantly increased by rapamycin, and the change was associated with a significant increase in LC3-II protein level. Scale bar, 50 μm. *P < 0.05.

Similar articles

Cited by

References

    1. Bagshaw SM, et al. Prognosis for long-term survival and renal recovery in critically ill patients with severe acute renal failure: a population-based study. Crit Care. 2005;9:R700–9. doi: 10.1186/cc3879. - DOI - PMC - PubMed
    1. Hsu CY, et al. The risk of acute renal failure in patients with chronic kidney disease. Kidney Int. 2008;74:101–7. doi: 10.1038/ki.2008.107. - DOI - PMC - PubMed
    1. Barrantes F, et al. Acute kidney injury predicts outcomes of non-critically ill patients. Mayo Clin Proc. 2009;84:410–6. doi: 10.1016/S0025-6196(11)60559-4. - DOI - PMC - PubMed
    1. Chertow GM, Burdick E, Honour M, Bonventre JV, Bates DW. Acute kidney injury, mortality, length of stay, and costs in hospitalized patients. J Am Soc Nephrol. 2005;16:3365–70. doi: 10.1681/ASN.2004090740. - DOI - PubMed
    1. Mehta RL, et al. Spectrum of acute renal failure in the intensive care unit: the PICARD experience. Kidney Int. 2004;66:1613–21. doi: 10.1111/j.1523-1755.2004.00927.x. - DOI - PubMed

Publication types

MeSH terms

Substances