. 2017 Jul 14:8:16101.
doi: 10.1038/ncomms16101.

The unprecedented 2015/16 Tasman Sea marine heatwave

Affiliations

The unprecedented 2015/16 Tasman Sea marine heatwave

Eric C J Oliver et al. Nat Commun. .

Abstract

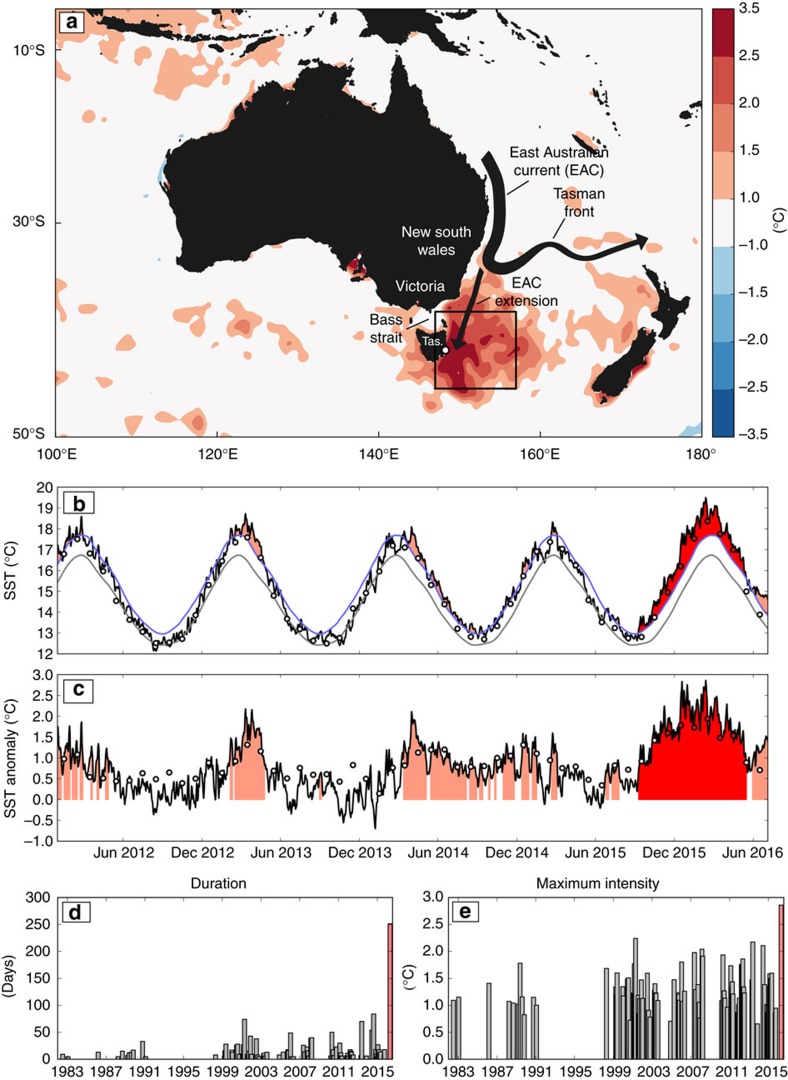
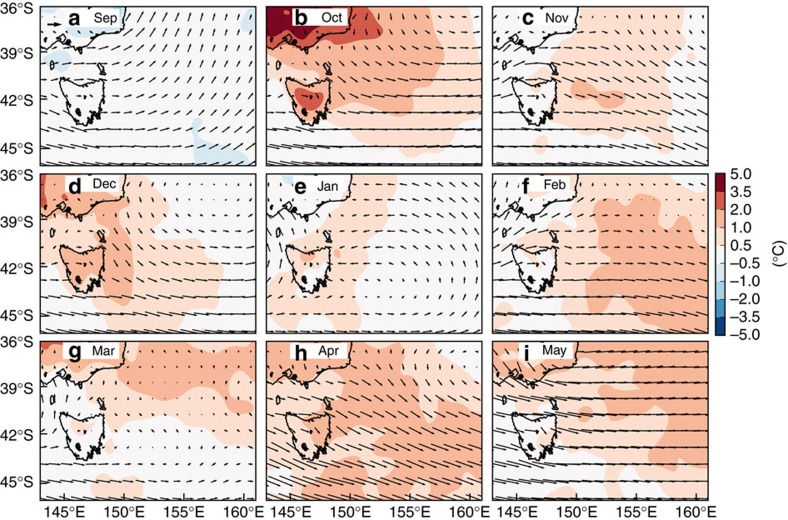
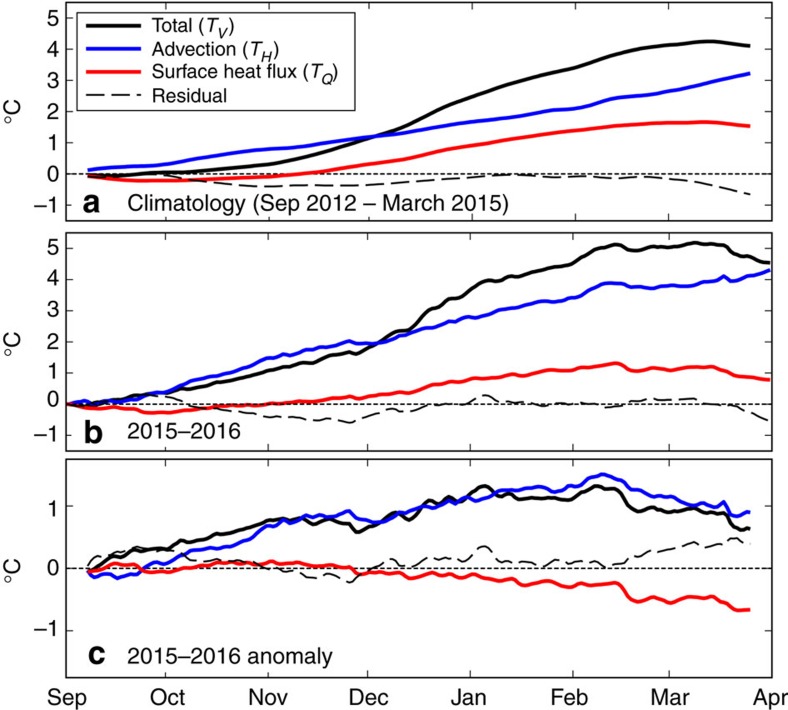
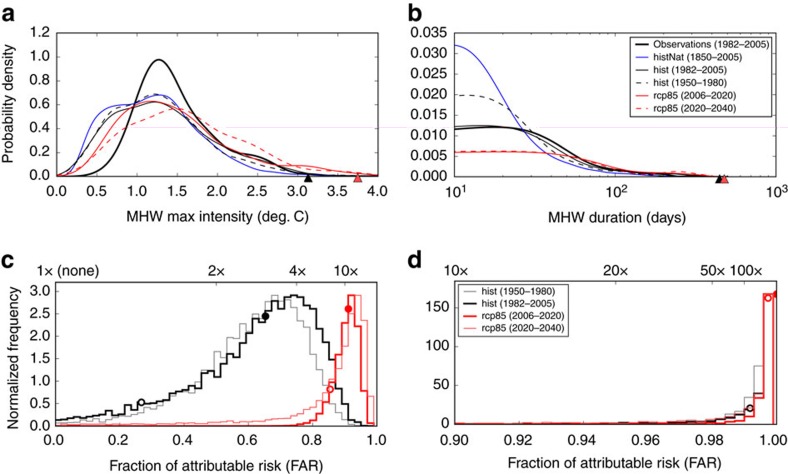
The Tasman Sea off southeast Australia exhibited its longest and most intense marine heatwave ever recorded in 2015/16. Here we report on several inter-related aspects of this event: observed characteristics, physical drivers, ecological impacts and the role of climate change. This marine heatwave lasted for 251 days reaching a maximum intensity of 2.9 °C above climatology. The anomalous warming is dominated by anomalous convergence of heat linked to the southward flowing East Australian Current. Ecosystem impacts range from new disease outbreaks in farmed shellfish, mortality of wild molluscs and out-of-range species observations. Global climate models indicate it is very likely to be that the occurrence of an extreme warming event of this duration or intensity in this region is respectively ≥330 times and ≥6.8 times as likely to be due to the influence of anthropogenic climate change. Climate projections indicate that event likelihoods will increase in the future, due to increasing anthropogenic influences.


Conflict of interest statement

The authors declare no competing financial interests.

Figures

Figure 1
Figure 1. The 2015/16 MHW off southeast Australia.
(a) The mean 2015/16 austral summer (December to February) mean SST anomalies from NOAA OI SST, the box used to define the southeast Austraila (SEAus) region (black lines) and the location of the Maria Island Time Series (open circle). Anomalies are relative to the 1982–2005 climatology. Also shown are time series of (b) SST and (c) SST anomalies averaged over the SEAus region since 2012 from NOAA OI SST (black lines) and HadISST (circles). The red-filled circles in b,c indicate which months during the event were among the top ten on record since 1880. The grey and blue lines in b indicate the climatological mean and 90th percentile threshold, respectively, calculated from NOAA OI SST. The pink-shaded regions in b,c indicate all MHWs detected using the Hobday et al. definition and the red-shaded region is the 2015/16 event. The (d) duration and (e) maximum intensity are shown for this event as red bars along with values for all previous events on record back to 1982.
Figure 2
Figure 2. Near-shore temperature and velocity records around Tasmania.
(am) Temperature anomalies are shown for 13 sites along Tasmania’s eastern shelf. The shaded regions indicate each MHW detected using the Hobday et al. definition, the red-shaded region is the largest event (by maximum intensity) and the blue line indicates the longest event. (n) Depth-averaged meridional velocity measured with an Acoustic Doppler current profiler (ADCP) at the Maria Island Australian National Mooring location (daily means as grey line, monthly means as open circles).
Figure 3
Figure 3. Monthly mean SST anomalies off southeastern Australia from September 2015 to May 2016.
Sea surface temperature data is NOAA OI SST. Only positive anomalies are shown, monthly for (a-i) Sep 2015 through May 2016; anomalies are relative to the 1982–2005 base period. Black contours enclose areas where at least 90% of the days in that month were part of an identified MHW.
Figure 4
Figure 4. Monthly mean surface currents off southeastern Australia from September 2015 to May 2016.
Ocean current data is IMOS OceanCurrent. Currents are shown monthly for (a-i) Sep 2015 through May 2016. A reference arrow of 0.5 m s−1 shown in upper left of (a) and colours indicate current speed.
Figure 5
Figure 5. Monthly mean surface air temperature anomalies and surface winds off southeastern Australia from September 2015 to May 2016.
Atmospheric data is from NCEP CFSv2. Air temperatures and winds are shown monthly for (a-i) Sep 2015 through May 2016. Colours indicate air temperature anomalies and arrows indicate surface winds. Anomalies are relative to the 2012–2016 period. A reference arrow of 5 m s−1 shown in upper left of a.
Figure 6
Figure 6. Temperature budget during the 2015/16 MHW.
(a) The climatology of the volume-averaged (0–100 m, SEAus region) temperature (TV, black line) along with contributions due to horizontal advection (TH, blue line), air–sea heat flux through the surface (TQ, red line) and the residual (dashed line). The climatology was calculated over three consecutive September–March periods (2012/13, 2013/14, 2014/15). (b) The temperature budget, as in a, but for 2015/16 only. (c) The anomalous temperature budget during 2015–2016, calculated as the difference between b,a.
Figure 7
Figure 7. Attribution of the 2015/16 Tasman Sea marine heatwave event using global climate models.
The PDFs of the (a) maximum intensity and (b) duration of all MHWs detected from the observations (thick black line) and the ensemble of CMIP5 historical simulations over 1982–2005 (thin black line) and over 1950–1980 (dashed black line), historicalNat simulations (blue line), and RCP8.5 simulations over 2006–2020 (red line) and over 2020–2040 (dashed red line), using a baseline climatology of 1881–1910. The black and red triangles indicate the properties of the event being attributed and of the 2015/16 event, respectively. The distribution of FAR values for a MHW of (c) maximum intensity 3.1 °C or (d) duration of 446 days from the historical and RCP8.5 runs over four separate time periods. 1 × (None) indicates no change in likelihood. The best estimate (median) and 10th percentile FAR values are indicated for the 1982–2005 and 2006–2020 periods by filled and open circles, respectively.

References

    1. Lima F. P. & Wethey D. S. Three decades of high-resolution coastal sea surface temperatures reveal more than warming. Nat. Commun. 3, 704 (2012). - PubMed
    1. Hobday A. et al.. A hierarchical approach to defining marine heatwaves. Prog. Oceanogr. 141, 227–238 (2016).
    1. Olita A., Sorgente R., Ribotti A., Natale S. & Gaberšek S. Effects of the 2003 European heatwave on the Central Mediterranean Sea surface layer: a numerical simulation. Ocean Sci. Discuss. 3, 85–125 (2006).
    1. Sparnocchia S., Schiano M. E., Picco P., Bozzano R. & Cappelletti A. The anomalous warming of summer 2003 in the surface layer of the Central Ligurian Sea (Western Mediterranean). Ann. Geophys. 24, 443–452 (2006).
    1. Benthuysen J., Feng M. & Zhong L. Spatial patterns of warming off Western Australia during the 2011 Ningaloo Niño: quantifying impacts of remote and local forcing. Cont. Shelf Res. 91, 232–246 (2014).

Publication types

LinkOut - more resources