. 2017 Jun 29:11:47.
doi: 10.3389/fncir.2017.00047. eCollection 2017.

Focal Stroke in the Developing Rat Motor Cortex Induces Age- and Experience-Dependent Maladaptive Plasticity of Corticospinal System

Affiliations

Focal Stroke in the Developing Rat Motor Cortex Induces Age- and Experience-Dependent Maladaptive Plasticity of Corticospinal System

Mariangela Gennaro et al. Front Neural Circuits. .

Abstract

Motor system development is characterized by an activity-dependent competition between ipsilateral and contralateral corticospinal tracts (CST). Clinical evidence suggests that age is crucial for developmental stroke outcome, with early lesions inducing a "maladaptive" strengthening of ipsilateral projections from the healthy hemisphere and worse motor impairment. Here, we investigated in developing rats the relation between lesion timing, motor outcome and CST remodeling pattern. We induced a focal ischemia into forelimb motor cortex (fM1) at two distinct pre-weaning ages: P14 and P21. We compared long-term motor outcome with changes in axonal sprouting of contralesional CST at red nucleus and spinal cord level using anterograde tracing. We found that P14 stroke caused a more severe long-term motor impairment than at P21, and induced a strong and aberrant contralesional CST sprouting onto denervated spinal cord and red nucleus. The mistargeted sprouting of CST, and the worse motor outcome of the P14 stroke rats were reversed by an early skilled motor training, underscoring the potential of early activity-dependent plasticity in modulating lesion outcome. Thus, changes in the mechanisms controlling CST plasticity occurring during the third postnatal week are associated with age-dependent regulation of the motor outcome after stroke.

Keywords: corticospinal system; critical period; development; maladaptive plasticity; stroke.


Figures
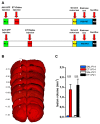
Figure 1
Figure 1
ET1 ischemic injury provoked in developing rats. (A) Experimental design. Rat pups were injected with AAV-green fluorescent protein (GFP) anterograde tracer, then lesioned at P14 or P21. Control animals were injected with saline. Once adults, animals performed behavioral tests and finally sacrificed. (B) Images sampled along the A-P axis (A-P level on the left hand side) showing ET1 ischemic lesion of the forelimb area. Lesion was induced at P21 and the rat was perfused at P70. Asterisks denote ET1 lesion. Scale bar, 1 mm. (C) Lesion volume quantified in ET1-P14/SAL-P14 and ET1-P21/SAL-P21 groups. Data are expressed as mean ± standard error of the mean (SEM). Asterisks denote significant differences respectively between ET1-P14 vs. SAL-P14 and ET1-P21 vs. SAL-P21. ***p < 0.001.
Figure 2
Figure 2
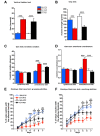
Timing of ET1 lesion during development determines long-term motor outcome. Age-independent effect of ET1 lesion on sensorimotor coordination (A), muscle strength (B) and abduction of affected forelimb (C). Age-dependent effect of ET1 lesion on interlimb coordination (D), success rates in the grasping task (E) and reaching abilities (F). (A–D) Asterisks denote significant differences between groups, ***p < 0.001. (E,F) Asterisks denote significant differences between ET1-P14 and ET1-P21, *p < 0.05; ***p < 0.001. $ denotes significant differences between ET1-P14 and SAL-P14, $p < 0.05; $$p < 0.01; $$$p < 0.001. & denotes significant differences between ET1-P21 and SAL-P21, &p < 0.05; &&p < 0.01. (A–F) Data are expressed as mean ± SEM.
Figure 3
Figure 3
Age-dependent effect of lesion on cortico-rubral plasticity. (A) Experimental design. Rats were lesioned at P14 or P21, then were injected at P40 in the contralesional cortex with biotinylated dextran amine (BDA) anterograde tracer, and finally sacrificed at P60. (B) Representative 10× magnification images of innervated (contralesional) and denervated (ipsilesional) red nucleus from animals of different groups. Vertical white line indicates midline. Scale bar, 200 μm. (C1) Quantification of BDA-labeled axons projecting to the denervated side of red nucleus across the midline (average from at least four sections per case). (C2) Ratio of fiber density of the denervated (ipsilesional) and innervated (contralesional) red nucleus (averaged from at least four sections per case). (C1,C2) *p < 0.05; **p < 0.01. Data are expressed as mean ± SEM.
Figure 4
Figure 4
AAV1-GFP viral labeling of contralesional corticospinal tracts (CST). (A) Representative image of motor cortex from a P14 lesioned animal characterized by lesion (*) on one hemisphere and a strong GFP signal in deep layers of the opposite cortex. Cortical areas were outlined according to Paxinos and Watson atlas. Scale bar, 1 mm. (B) Mosaic image of caudal medulla oblongata containing GFP labeled medullar pyramid. Scale bar, 1 mm. Insets: 5× (upper) and 63× (bottom) magnifications of GFP+ axons in medullar pyramid. Scale bars, 100 μm and 50 μm, respectively. (C) Coronal section of C6 spinal cord stained with PI. Vertical white line indicates dorso-ventral midline. Note the ventral part of dorsal funiculus (dorsal CST, dCST) and the medial part of ventral funiculus (ventral CST, vCST) labeled with GFP. Scale bar, 500 μm.
Figure 5
Figure 5
Developmental ET1 lesion prevents pruning of ipsilateral vCST in an age-independent manner. (A) Representative 10× magnification images of dCST (left) and vCST (right) from animals of different groups. Scale bar, 100 μm. Analysis of GFP+ signal from dCST (B) and vCST (C) funiculi was performed on non-saturated images: brightness and contrast parameters were optimized for detection of dCST and vCST bulks respectively, preventing visualization of axonal sprouts into the gray matter of denervated spinal cord. (B) No differences between groups. (C) Both ET1 lesioned groups had a greater ipsilateral ventral funiculus vs. control animals, suggesting that, at both ages, lesion affects developmental pruning. **p < 0.01. (B,C) Data are expressed as mean ± SEM.
Figure 6
Figure 6
Lesion timing determines patterns of axonal sprouting in an age-dependent manner. (A) Representative images of denervated side of spinal cord showing dCST and vCST axonal sprouting towards spinal gray matter. Scale bars 200 μm. (B) dCST axonal sprouting. ET1-P14 animals show a greater degree of axonal sprouting from GFP+ dCST compared to ET1-P21 rats. Two-Way repeated measure ANOVA, factor group × distance p < 0.001, post hoc Holm-Sidak test. Asterisks indicates significance between groups: *p < 0.05, **p < 0.01, ***p < 0.001. (C) vCST axonal sprouting. ET1-P14 animals showed a greater number of axons from GFP+ vCST crossing white-gray matter border vs. ET1-P21 rats. Two-Way ANOVA, factor treatment × age p < 0.001, post hoc Holm-Sidak. Asterisks indicates significance between groups: *p < 0.05, **p < 0.01, ***p < 0.001. (B,C) Data are expressed as mean ± SEM.
Figure 7
Figure 7
Mistargeted sprouting of CST after P14 lesion. (A) Micrographs showing different sprouting patterns of GFP+ fibers from the contralesional cortex towards dorsal (left), intermediate (middle) and ventral (right) zones of the denervated cervical spinal cord (C7) in different groups. Scale bars, 50 μm. (B1–B3) ET1-P14 animals exhibits a higher axonal complexity index (ACI) in dorsal and ventral laminae compared to controls and ET1-P21 animals. (B1) Two-Way ANOVA on ranks for dorsal laminae, factor treatment × age p < 0.01, post hoc Holm-Sidak. (B2) Two-Way ANOVA on ranks for intermediate lamina, factor treatment × age p < 0.05, post hoc Holm-Sidak. (B3) Two-Way ANOVA on ranks for ventral laminae, factor treatment × age p < 0.01, post hoc Holm-Sidak. Asterisks indicates significance between groups: *p < 0.05, ***p < 0.001. (B1–B3) Data are expressed as mean ± SEM.
Figure 8
Figure 8
Early skilled motor learning corrects maladaptive CST rewiring after ET1-P14 lesion. (A1) Experimental design. (A2) Lesion volumes quantified in ET1-P14/ET1-P14 TRAINING groups, t-test, p > 0.05. (B) dCST axonal sprouting. ET1-P14 TRAINING group showed a significant reduction of aberrant spontaneous sprouting to the same levels as controls. Two-Way repeated measure ANOVA, factor group × distance p < 0.001, post hoc Holm-Sidak test. (C) vCST axonal sprouting. ET1-P14 TRAINING group showed a significant reduction of number of axons from GFP+ vCST crossing white-gray matter border vs. ET1-P14 rats and the same level of innervation as controls. One-Way ANOVA p < 0.001, post hoc Holm-Sidak. (D) Mosaic images representing the effect of early training on different sprouting patterns of GFP+ fibers from the contralesional cortex towards the denervated cervical spinal cord (C6) of different groups. Scale bars, 200 μm. (E1–E3) Early skilled motor learning promoted a significant drop in ACI of sprouted axons in ET1-P14 TRAINING group to the same levels as controls. (E1) One-Way ANOVA p < 0.01. (E2) One-Way ANOVA p = 0.004. (E3) One-Way ANOVA p = 0.01. Multiple comparisons between groups were performed through post hoc Holm-Sidak. Asterisks indicates significance between groups: *p < 0.05, **p < 0.01, ***p < 0.001. (A2–C,E1–E3) Data are expressed as mean ± SEM.
Figure 9
Figure 9
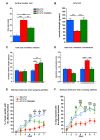
Early activity-dependent modulation of CST plasticity after ET1-P14 injury mitigates the onset of long-term motor impairments. (A) Partial amelioration of sensorimotor coordination promoted by early skilled motor training. (B) Complete recovery on both muscle strength and (D) interlimb coordination of lesioned side after early skilled motor training. Lack of the effect of early skilled motor training on abduction of lesioned forelimb (C). Early skilled motor training partially ameliorated grasping (E) and fully restored reaching abilities (F) up to adult age. (A–D) One-Way ANOVA, post hoc Holm-Sidak. Asterisks denote significant differences between groups, **p < 0.01; ***p < 0.001. (E,F) Two-Way RM ANOVA, post hoc Holm-Sidak. Asterisks denote significant differences between ET1-P14 and ET1-P14 TRAINING, *p < 0.05; **p < 0.01; ***p < 0.001. $ Denotes Significant Differences Between ET1-P14 and SAL-P14, $p < 0.05; $$p < 0.01; $$$p < 0.001. &Denotes significant differences between SAL-P14 and ET1-P14 TRAINING, &p < 0.05, &&p < 0.01. (A–F) Data are expressed as mean ± SEM.

Similar articles

Cited by

References

    1. Alstermark B., Ogawa J., Isa T. (2004). Lack of monosynaptic corticomotoneuronal EPSPs in rats: disynaptic EPSPs mediated via reticulospinal neurons and polysynaptic EPSPs via segmental interneurons. J. Neurophysiol. 91, 1832–1839. 10.1152/jn.00820.2003 - DOI - PubMed
    1. Alves J. N., Muir E. M., Andrews M. R., Ward A., Michelmore N., Dasgupta D., et al. . (2014). AAV vector-mediated secretion of chondroitinase provides a sensitive tracer for axonal arborisations. J. Neurosci. Methods 227, 107–120. 10.1016/j.jneumeth.2014.02.010 - DOI - PubMed
    1. Arlotta P., Molyneaux B. J., Chen J., Inoue J., Kominami R., Macklis J. D. (2005). Neuronal subtype-specific genes that control corticospinal motor neuron development in vivo. Neuron 45, 207–221. 10.1016/j.neuron.2004.12.036 - DOI - PubMed
    1. Asante C. O., Martin J. H. (2013). Differential joint-specific corticospinal tract projections within the cervical enlargement. PloS One 8:e74454. 10.1371/journal.pone.0074454 - DOI - PMC - PubMed
    1. Azim E., Jiang J., Alstermark B., Jessell T. M. (2014). Skilled reaching relies on a V2a propriospinal internal copy circuit. Nature 508, 357–363. 10.1038/nature13021 - DOI - PMC - PubMed

MeSH terms