. 2017 Jun 29:8:1087.
doi: 10.3389/fpsyg.2017.01087. eCollection 2017.

Valence-Dependent Belief Updating: Computational Validation

Affiliations

Valence-Dependent Belief Updating: Computational Validation

Bojana Kuzmanovic et al. Front Psychol. .

Abstract

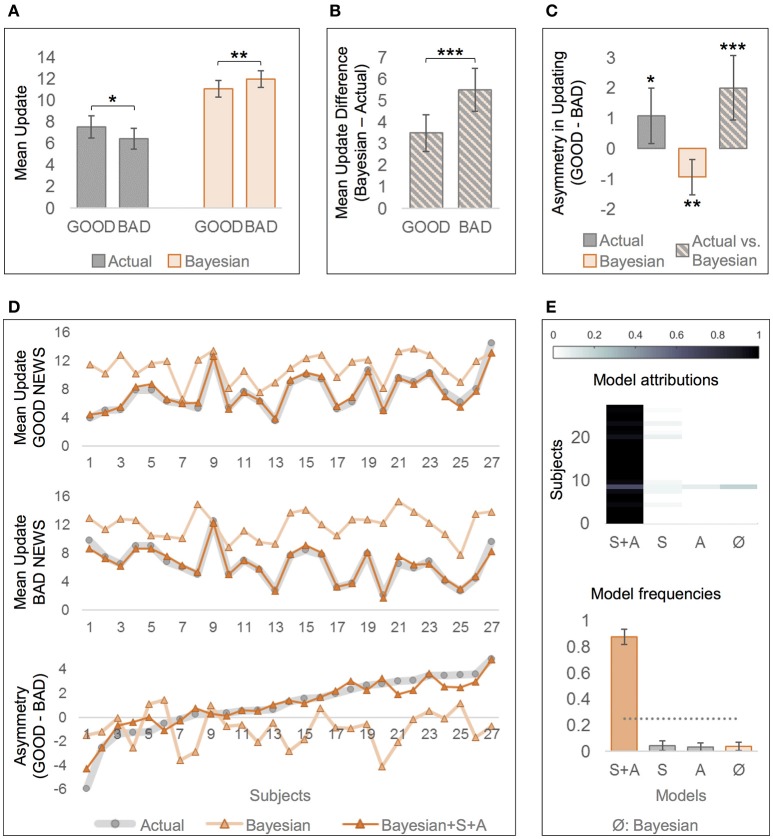
People tend to update beliefs about their future outcomes in a valence-dependent way: they are likely to incorporate good news and to neglect bad news. However, belief formation is a complex process which depends not only on motivational factors such as the desire for favorable conclusions, but also on multiple cognitive variables such as prior beliefs, knowledge about personal vulnerabilities and resources, and the size of the probabilities and estimation errors. Thus, we applied computational modeling in order to test for valence-induced biases in updating while formally controlling for relevant cognitive factors. We compared biased and unbiased Bayesian models of belief updating, and specified alternative models based on reinforcement learning. The experiment consisted of 80 trials with 80 different adverse future life events. In each trial, participants estimated the base rate of one of these events and estimated their own risk of experiencing the event before and after being confronted with the actual base rate. Belief updates corresponded to the difference between the two self-risk estimates. Valence-dependent updating was assessed by comparing trials with good news (better-than-expected base rates) with trials with bad news (worse-than-expected base rates). After receiving bad relative to good news, participants' updates were smaller and deviated more strongly from rational Bayesian predictions, indicating a valence-induced bias. Model comparison revealed that the biased (i.e., optimistic) Bayesian model of belief updating better accounted for data than the unbiased (i.e., rational) Bayesian model, confirming that the valence of the new information influenced the amount of updating. Moreover, alternative computational modeling based on reinforcement learning demonstrated higher learning rates for good than for bad news, as well as a moderating role of personal knowledge. Finally, in this specific experimental context, the approach based on reinforcement learning was superior to the Bayesian approach. The computational validation of valence-dependent belief updating represents a novel support for a genuine optimism bias in human belief formation. Moreover, the precise control of relevant cognitive variables justifies the conclusion that the motivation to adopt the most favorable self-referential conclusions biases human judgments.

Keywords: Bayesian theorem; belief updating; computational modeling; desirability; motivation; optimism bias; probability; risk judgments.


Figures

Figure 1
Figure 1
The general structure of the experimental design (A) and example trials with good and bad news (B). (A) In each trial and with respect to each of the 80 stimulus events, participants (i) estimated the base rate (eBR), (ii) estimated their lifetime risk (E1), (iii) were provided with the “actual” base rate (BR), and (iv) re-estimated their lifetime risk (E2). Estimation errors (EE) were computed as the absolute difference between eBR and BR, and updates (UPD) as the expected shift from E1 to E2 (i.e., E1–E2 when BR < eBR, and E2–E1 when BR > eBR). The difference between eBR and E1 indicates how much the participant believes that he or she deviates from the average (personal knowledge, P). (B) In the upper row, a participant is presented with a lower base rate than expected (BR < eBR), providing her with good news. In the upper row, the presented base rate is higher than expected, indicating bad news.
Figure 2
Figure 2
Comparison of actual and Bayesian updates, and of “rational” and “optimistic” Bayesian models of belief updating. (A) Actual updates were larger after good news (GOOD) than after bad news (BAD), indicating an optimism bias, but Bayesian updates were larger after bad than after good news. (B) The difference between the Bayesian and the actual update was greater for BAD than for GOOD trials. Note that Bayesian updates were generally higher than actual updates. (C) Measures of asymmetric updating (mean update in GOOD—mean update in BAD), that are derived from (A,B). While there is an optimistic asymmetry in actual updates, and an opposite asymmetry in Bayesian updates, contrasting the asymmetry in actual updates with the one in Bayesian updates reveals a larger optimism bias than when considering the actual updates alone. (A–C) Error bars show 95% CI. (D) Differences in mean updates and asymmetry in updating between the actual data and the predictions by the two computational models: “rational” Bayesian (according to Shah et al., 2016), and “optimistic” Bayesian including the free parameters Asymmetry (A) and Scaling (S, Bayesian+A+S). Subjects are sorted by asymmetry in updating based on actual data (bottom, gray line) in ascending order. (E) “Optimistic” Bayesian model (“A+S”) accounts better for actual data than the “rational” Bayesian model (“Ø,” according to Shah et al., 2016), or other less complex models (“S” and “A”). Labels at the x-axis indicate which parameters are left free. Posterior model attribution (top): Each colored cell gives the posterior probability that a given subject (y-axis) is best explained by a specific model (x-axis). The more contrasted a line, the better the confidence in the attribution. Posterior model frequencies (bottom): Each bar represents the expected frequency of a model in the tested sample, i.e., how many subjects are expected to be best described by a model (error bars show standard deviation). The gray dashed line represents the null hypothesis, namely that all models are equally likely in the population (chance level). *p < 0.05, **p < 0.01, ***p < 0.001.
Figure 3
Figure 3
Alternative model of belief updating based on classical reinforcement learning. (A) The alternative model that incorporated the effects of learning rate (α ≠ 1), valence (Asymmetry, A ≠ 0) and personal knowledge (W ≠ 0) best accounted for the actual data (“α+A+W,” m1). Thus, it provided a formal test that all three factors are influential components in belief updating. Labels α, A and W indicate which parameters are left free. Ø indicates the null hypothesis, namely that there is no effect of learning rate (α = 1), valence (A = 0) or personal knowledge (W = 0), and thus that update is simply proportional to estimation error. (B) The simpler version of the alternative model that fixes W to 1 (m2; i.e., personal knowledge is influential, but equally across subjects) outperformed m1 (W formalized as a free parameter with a prior of 0). Thus, m2 is the finally resulting alternative model of belief updating. (C) The winning alternative model (m2) accounts better for the actual data than the winning “optimistic” Bayesian model (“Bayesian: S+A”). (A–C) Posterior model attribution (top): Each colored cell gives the posterior probability that a given subject (y-axis) is best explained by a specific model (x-axis). Posterior model frequencies (bottom): Each bar represents the expected frequency of a model in the tested sample, i.e., how many subjects are expected to be best described by a model (error bars show standard deviation). The gray dashed line represents the null hypothesis, namely that all models are equally likely in the population (chance level). (D) Mean posterior parameter estimates of the learning rate resulting from model m2. Alpha (α) was significantly smaller than 1, indicating that updates were lower than the estimation error (weighted by personal knowledge). Asymmetry (A) was significantly greater than 0, supporting the effect of valence as learning rates were larger for good than for bad news. (E) Learning rates resulting from model m2 were larger in response to good than to bad news (GOOD and BAD trials), confirming the effect of valence on belief updating. (D,E) Error bars show 95% CI. (F) Across subjects, estimated Asymmetry in learning rate (A) derived from m2 correlated with the asymmetry in updating derived from the actual data. **p < 0.01, **p < 0.001.

References

    1. Cumming G. (2014). The new statistics: why and how. Psychol. Sci. 25, 7–29. 10.1177/0956797613504966 - DOI - PubMed
    1. Daunizeau J., Adam V., Rigoux L. (2014). VBA: a probabilistic treatment of nonlinear models for neurobiological and behavioural data. PLoS Comput. Biol. 10:e1003441. 10.1371/journal.pcbi.1003441 - DOI - PMC - PubMed
    1. Eil D., Rao J. M. (2011). The good news-bad news effect: asymmetric processing of objective information about yourself. Am. Econ. J. Microecon. 3, 114–138. 10.1257/mic.3.2.114 - DOI
    1. Friston K., Schwartenbeck P., Fitzgerald T., Moutoussis M., Behrens T., Dolan R. J. (2013). The anatomy of choice: active inference and agency. Front. Hum. Neurosci. 7:598. 10.3389/fnhum.2013.00598 - DOI - PMC - PubMed
    1. Garrett N., Sharot T. (2014). How robust is the optimistic update bias for estimating self-risk and population base rates? PLoS ONE 9:e98848. 10.1371/journal.pone.0098848 - DOI - PMC - PubMed