. 2017 Jun 29:8:1161.
doi: 10.3389/fpls.2017.01161. eCollection 2017.

Inhibition of Histone H3K9 Methylation by BIX-01294 Promotes Stress-Induced Microspore Totipotency and Enhances Embryogenesis Initiation

Affiliations

Inhibition of Histone H3K9 Methylation by BIX-01294 Promotes Stress-Induced Microspore Totipotency and Enhances Embryogenesis Initiation

Eduardo Berenguer et al. Front Plant Sci. .

Abstract

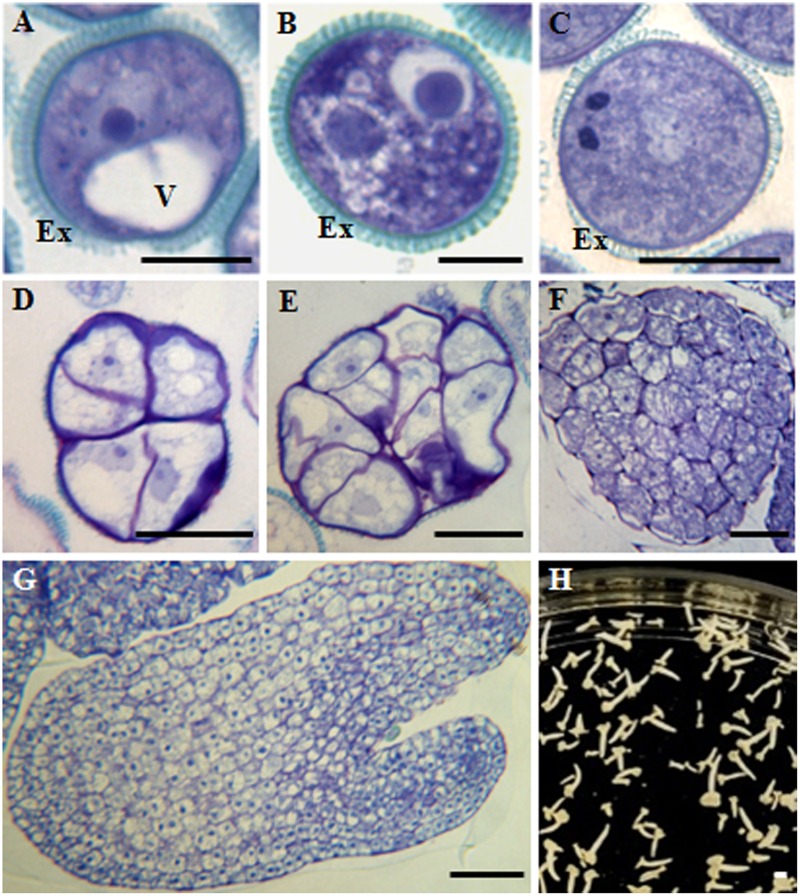
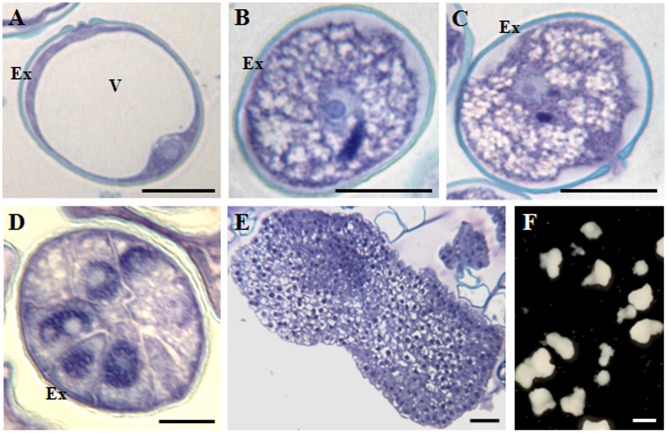
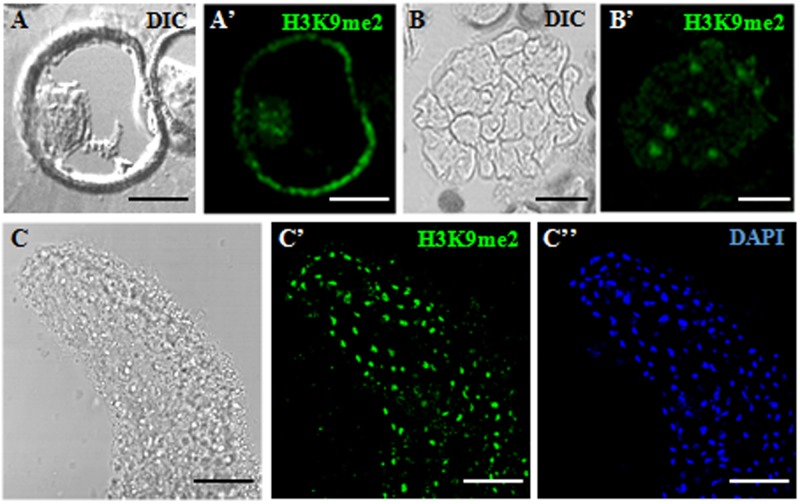
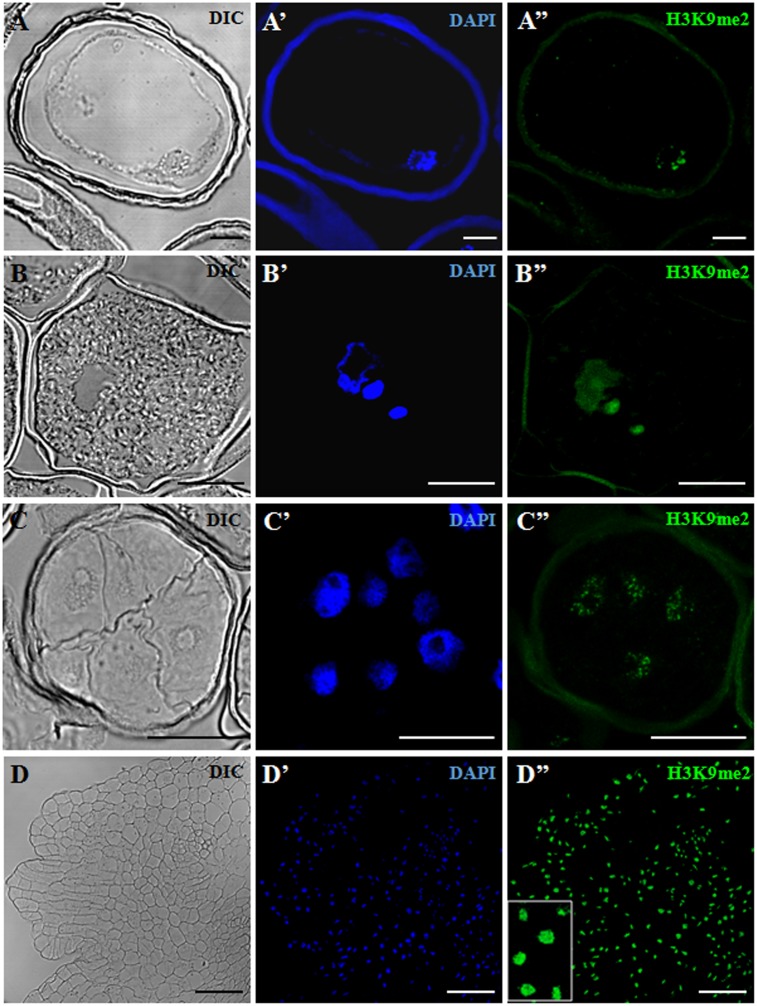
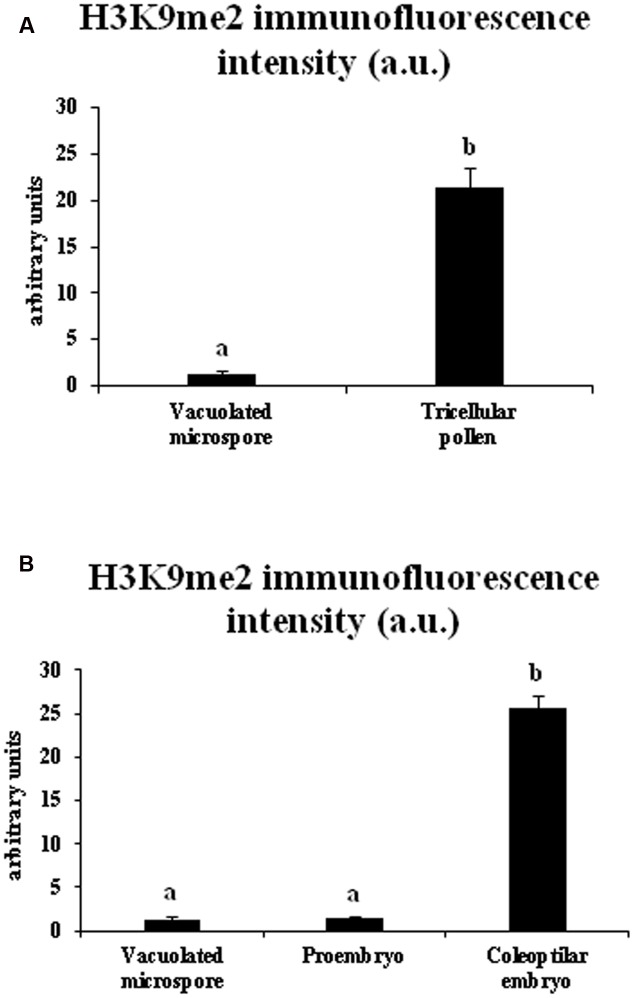
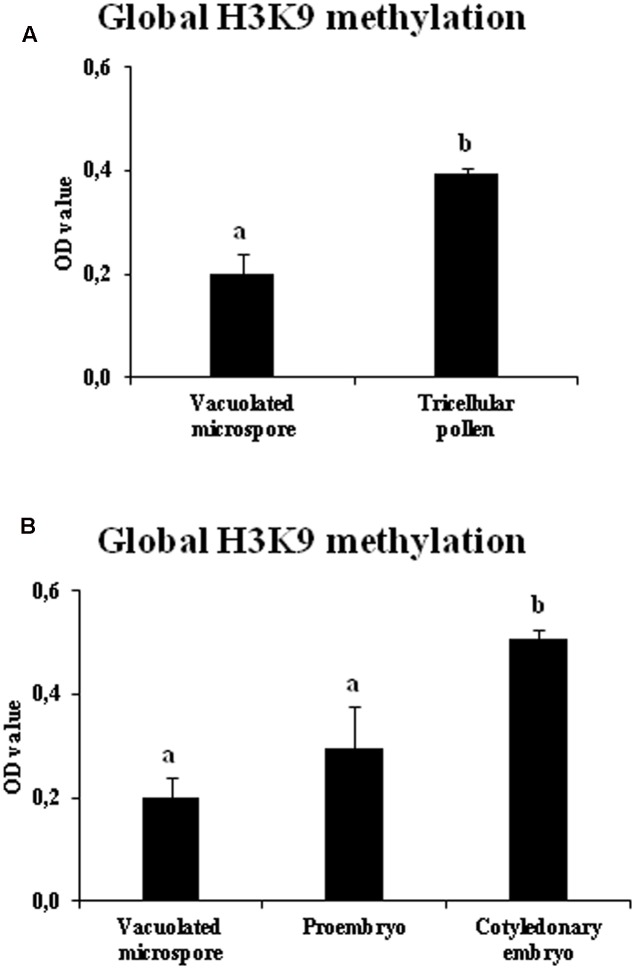
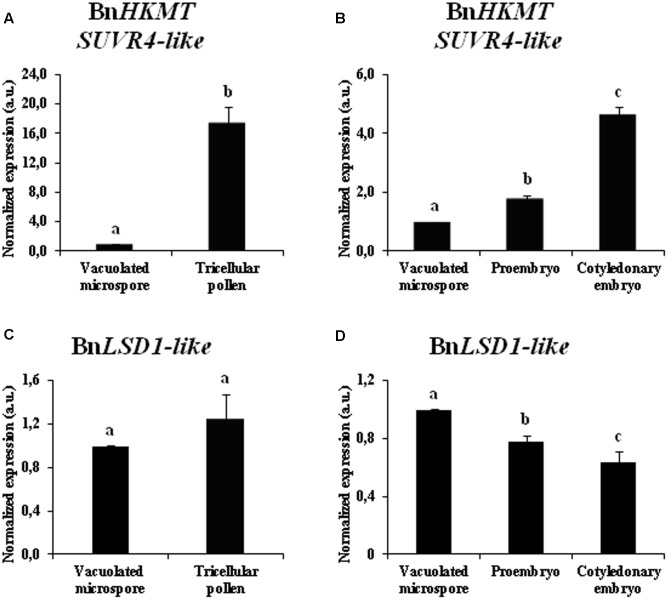
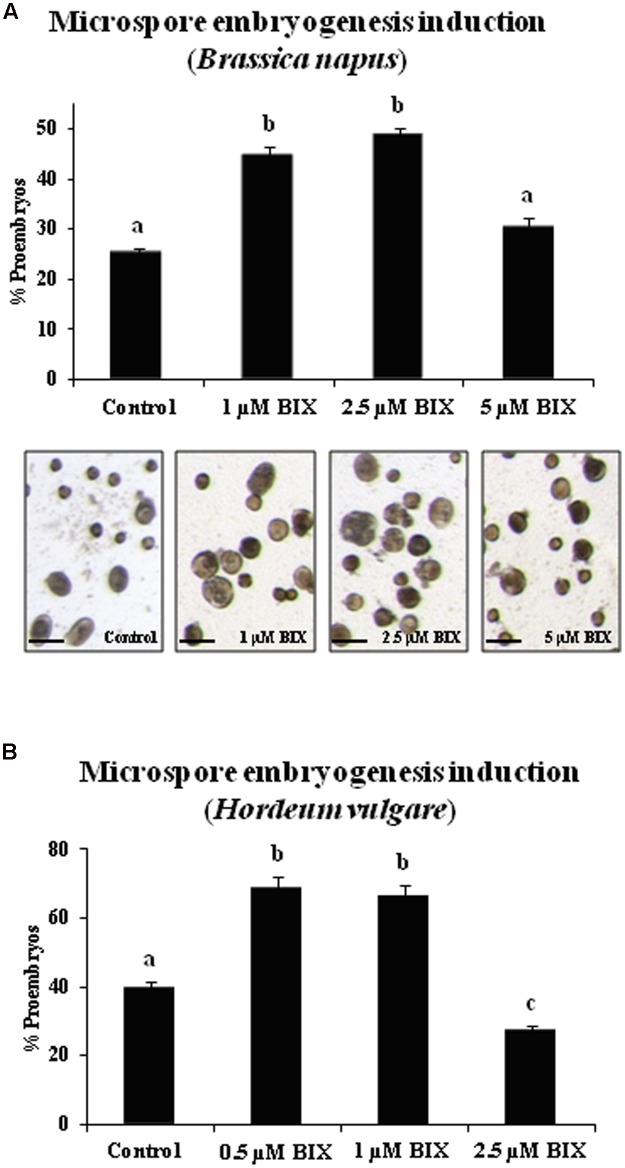
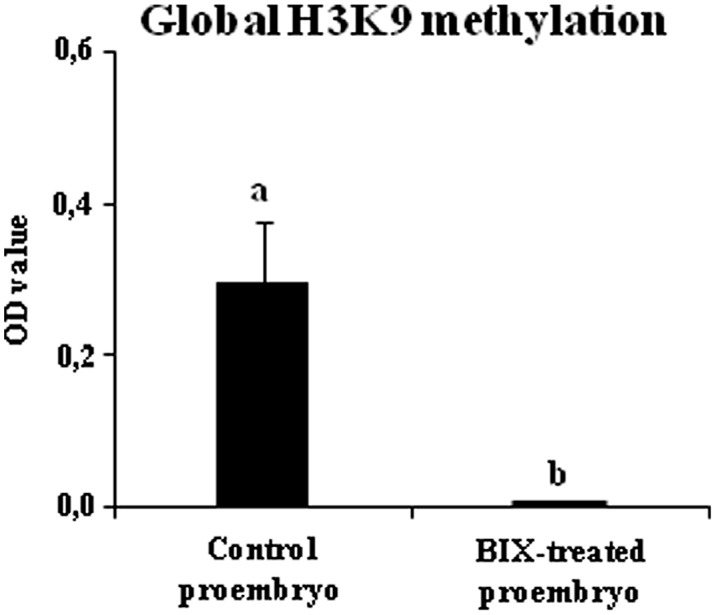
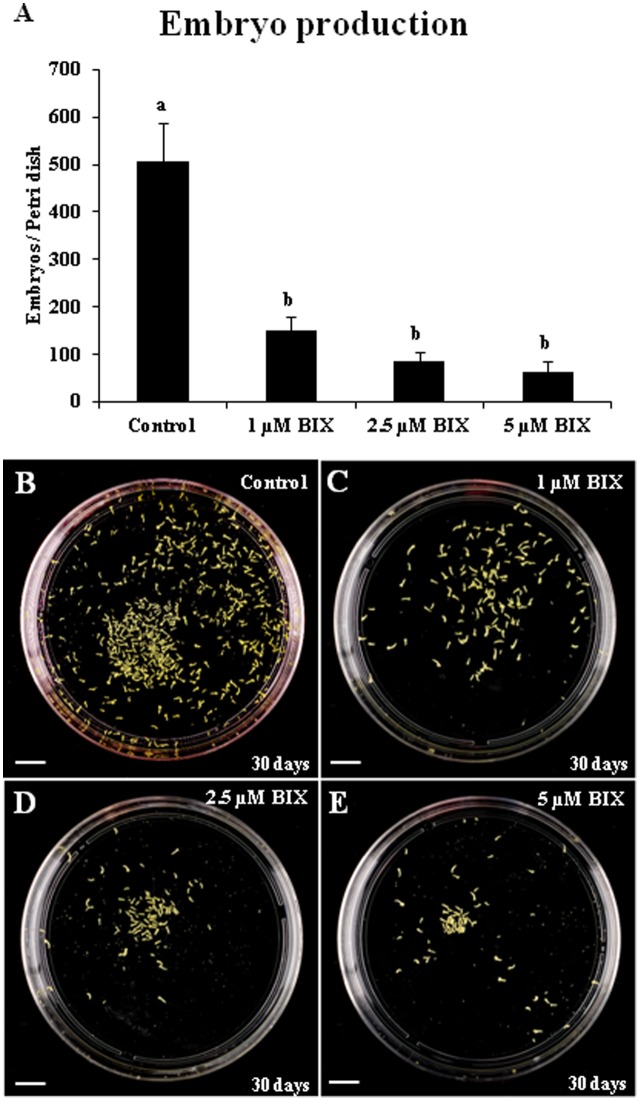
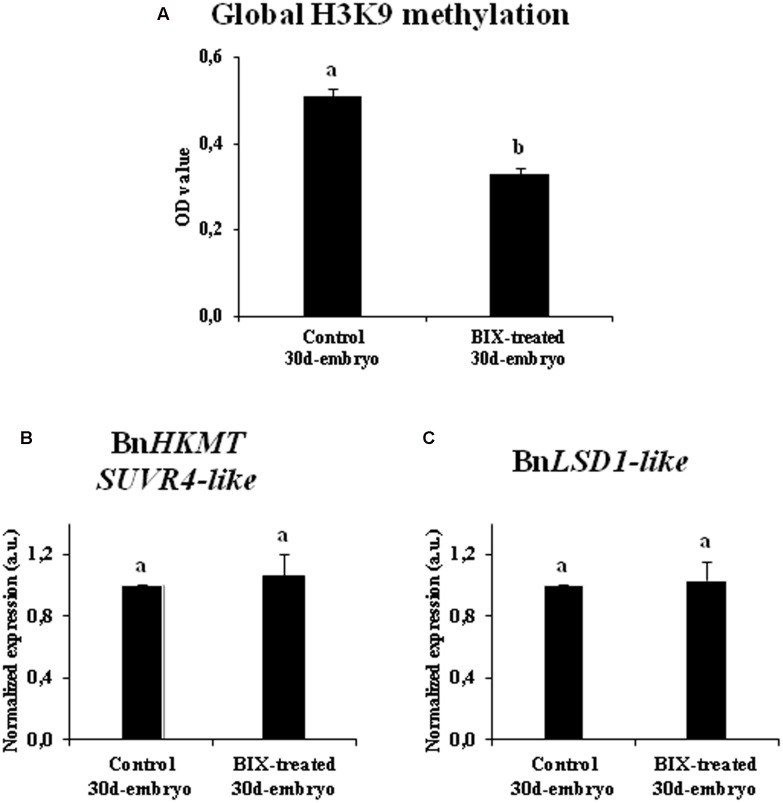
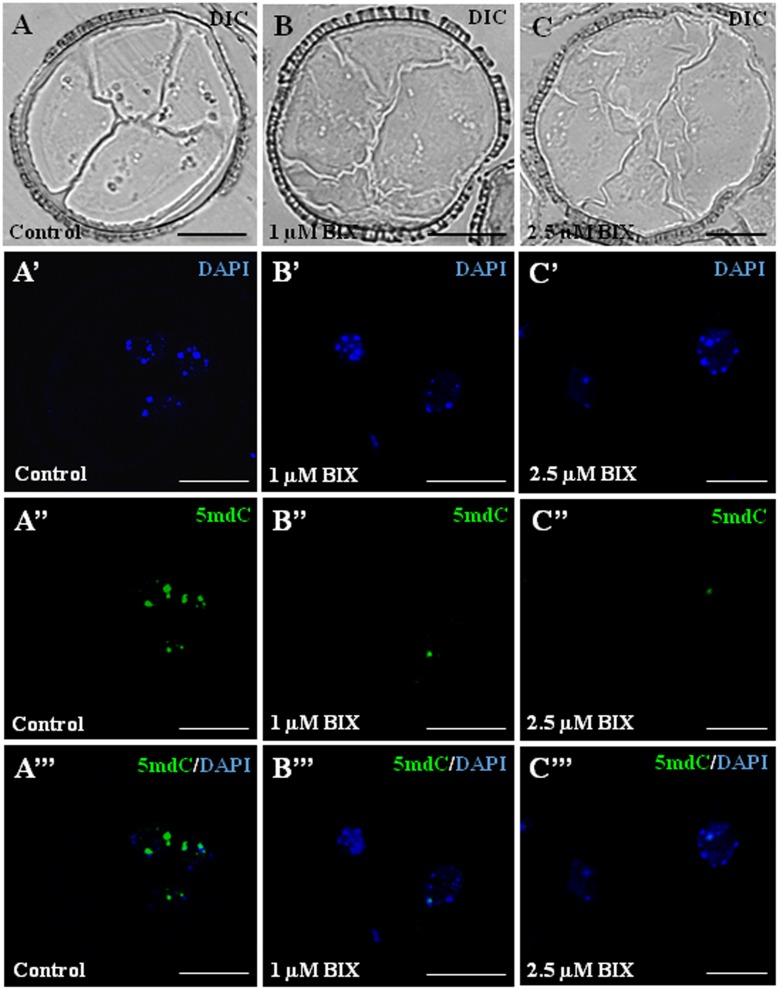
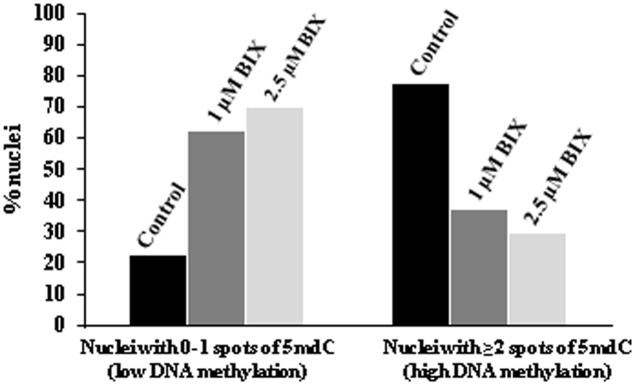
Microspore embryogenesis is a process of cell reprogramming, totipotency acquisition and embryogenesis initiation, induced in vitro by stress treatments and widely used in plant breeding for rapid production of doubled-haploids, but its regulating mechanisms are still largely unknown. Increasing evidence has revealed epigenetic reprogramming during microspore embryogenesis, through DNA methylation, but less is known about the involvement of histone modifications. In this study, we have analyzed the dynamics and possible role of histone H3K9 methylation, a major repressive modification, as well as the effects on microspore embryogenesis initiation of BIX-01294, an inhibitor of histone methylation, tested for the first time in plants, in Brassica napus and Hordeum vulgare. Results revealed that microspore reprogramming and initiation of embryogenesis involved a low level of H3K9 methylation. With the progression of embryogenesis, methylation of H3K9 increased, correlating with gene expression profiles of BnHKMT SUVR4-like and BnLSD1-like (writer and eraser enzymes of H3K9me2). At early stages, BIX-01294 promoted cell reprogramming, totipotency and embryogenesis induction, while diminishing bulk H3K9 methylation. DNA methylation was also reduced by short-term BIX-01294 treatment. By contrast, long BIX-01294 treatments hindered embryogenesis progression, indicating that H3K9 methylation is required for embryo differentiation. These findings open up new possibilities to enhance microspore embryogenesis efficiency in recalcitrant species through pharmacological modulation of histone methylation by using BIX-01294.

Keywords: BIX-01294; H3K9me2; barley; cell totipotency; histone methylation; microspore embryogenesis; rapeseed; stress-induced microspore reprogramming.


Figures

FIGURE 1
FIGURE 1
Main stages of pollen development and microspore embryogenesis of Brassica napus. Micrographs of semithin sections stained by Toluidine blue showing the cellular organization. (A) Vacuolated microspore. (B,C) Gametophytic development. (B) Bicellular pollen grain. (C) Tricellular pollen grain. (D–H) Microspore embryogenesis. (D,E) Proembryos. (F) Globular embryo. (G) Torpedo embryo. (H) Cotyledonary embryos, panoramic view of a Petri dish of a microspore embryogenesis culture after 30 days. Ex, exine; V, vacuole. Bars represent: (A–C): 10 μm, (D–F): 20 μm, (G): 50 μm, (H): 1 mm.
FIGURE 2
FIGURE 2
Main stages of pollen development and microspore embryogenesis of Hordeum vulgare. Micrographs of semithin sections stained by Toluidine blue showing the cellular organization. (A) Vacuolated microspore. (B,C) Gametophytic development. (B) Bicellular pollne. (C) Tricellular pollen. (D–F) Microspore embryogenesis. (D) Proembryo. (E) Transitional embryo. (F) Coleoptilar embryos, with different degrees of development, panoramic view of a Petri dish of a microspore embryogenesis culture after 30 days. Ex, exine; V, vacuole. Bars represent: (A–C): 10 μm, (D): 20 μm, (E): 100 μm, (F): 1 mm.
FIGURE 3
FIGURE 3
Immunofluorescence of H3K9me2 during microspore embryogenesis initiation and progression of Brassica napus. Confocal laser scanning microscopy analysis of vacuolated microspores (A,A’), proembryos (B,B’) and cotyledonary embryos (C–C”). (A–C): Nomarsky’s differential interference contrast (DIC) images showing the cellular organization of the different structures. (A’–C’): H3K9me2 immunofluorescence signal over nuclei (green). (C”): DAPI staining of nuclei (blue) of a region of the cotyledon. The same structures are visualized under different microscopy modes in (A,A’), (B,B’) and (C–C”). The exine showed unspecific autofluorescence in some images (A’). Bars represent: (A,A’): 10 μm, (B,B’): 20 μm, (C–C”): 50 μm.
FIGURE 4
FIGURE 4
Immunofluorescence of H3K9me2 during pollen development and microspore embryogenesis of Hordeum vulgare. Confocal laser scanning microscopy analysis of vacuolated microspores, starting point of the two developmental pathways (A–A”), tricellular pollen, advanced stage of gametophytic development (B–B”), proembryos, early stage after reprogramming (C–C”) and coleoptilar embryo, advanced embryogenesis stage (D–D”). (A–D): Nomarsky’s differential interference contrast (DIC) images showing the cellular organization of the different structures. (A’–D’): DAPI staining of nuclei (blue). (A”–D”): H3K9me2 immunofluorescence signal over nuclei (green). The same structures are visualized under different microscopy modes in (A–A”), (B–B”), (C–C”) and (D–D”). Inset shows a detail of (D”) at higher magnification. The exine showed unspecific autofluorescence in some images (A’,A”,B”,C”). Bars represent: (A–A”), (B–B”): 10 μm, (C–C”): 20 μm, (D–D”): 75 μm.
FIGURE 5
FIGURE 5
Quantification of H3K9me2 immunofluorescence signal intensity during pollen development and microspore embryogenesis in Hordeum vulgare. Histograms represent the level of immunofluorescence intensity, in arbitrary units, as measured by ImageJ software tools over confocal maximum projections images, in different stages of the two microspore pathways, gametophytic development (A: vacuolated microspore and tricellular pollen), and microspore embryogenesis (B: vacuolated microspore, proembryo and coleoptilar embryo). Columns represent mean fluorescence intensity (±SEM). Different letters indicate significant differences according to ANOVA and Tukey’s test at p ≤ 0.05.
FIGURE 6
FIGURE 6
Quantification of global H3K9 methylation during pollen development and microspore embryogenesis of Brassica napus. Histograms represent the amount of H3K9 methylation, in optical density (OD) units at 450 nm (see Materials and Methods), in different stages of the two microspore pathways, gametophytic development (A: vacuolated microspore and tricellular pollen), and microspore embryogenesis (B: vacuolated microspore, proembryo and cotyledonary embryo). Columns represent mean optical density (OD) units at 450 nm (±SEM). Different letters indicate significant differences according to ANOVA and Tukey’s test at p ≤ 0.05.
FIGURE 7
FIGURE 7
Gene expression patterns of BnHKMT SUVR4-like histone methyltransferase and BnLSD1-like demethylase during pollen development and microspore embryogenesis of Brassica napus, by quantitative qPCR. Histograms express relative changes of expression at different stages of gametophytic development (A,C) and microspore embryogenesis (B,D): vacuolated microspore (starting point of the two pathways, before reprogramming), tricellular pollen (gametophytic pathway), proembryo and cotyledonary embryo (embryogenic pathway). Transcript levels were normalized to vacuolated microspore levels. Bars indicate the SEM. Different letters on columns indicate significant differences according to ANOVA and Tukey’s tests at p < 0.05.
FIGURE 8
FIGURE 8
Effects of BIX-01294 short treatments on microspore embryogenesis induction of Brassica napus and Hordeum vulgare.(A): Quantification of microspore embryogenesis induction and representative micrographs of control and BIX-treated cultures of Brassica napus.(B): Quantification of microspore embryogenesis induction in control and BIX-treated cultures of Hordeum vulgare. Histograms show percentages of proembryos formed in microspore cultures untreated (control) and after short treatment (4 days) with BIX-01294 at different concentrations (1, 2.5, and 5 μM in B. napus, 0.5, 1, and 2.5 μM in H. vulgare); bars in columns indicate the SEM; different letters on columns indicate significant differences according to ANOVA and Tukey’s tests at p < 0.05. Micrographs show proembryos (larger, dense-rounded structures) in representative areas of control and BIX-treated cultures at 1, 2.5, and 5 μM concentrations, in rapeseed. Bars represent 50 μm.
FIGURE 9
FIGURE 9
Effects of BIX-01294 short treatments on H3K9 methylation levels of proembryos of Brassica napus. Quantification of global H3K9 methylation levels, represented as mean optical density (OD) units at 450 nm (±SEM), in control (untreated) and 2.5 μM BIX-treated proembryos of Brassica napus, after 4 days in culture. Different letters on columns indicate significant differences according to ANOVA and Tukey’s tests at p < 0.05.
FIGURE 10
FIGURE 10
Effects of BIX-01294 long treatments on microspore-derived embryo production of Brassica napus. (A): Quantification of the embryo production in control and BIX-treated cultures at 1, 2.5, and 5 μM concentrations. Columns represent mean values (±SEM) of the total number of embryos per Petri dish. Different letters on columns indicate significant differences according to ANOVA and Tukey’s tests at p < 0.05. (B–E): Representative plates showing the microspore-derived embryos produced in control (B) and BIX-treated cultures at 1 μM (C), 2.5 μM (D) and 5 μM (E) concentrations, after 30 days. Bars represent 10 mm.
FIGURE 11
FIGURE 11
Effects of BIX-01294 long treatments on H3K9 methylation levels and gene expression of BnHKTM SUVR4-like histone methyltransferase and BnLSD1-like demethylase. (A): Quantification of global H3K9 methylation levels, represented as mean optical density (OD) units at 450 nm (±SEM), in control and 2.5 μM BIX-treated embryos of Brassica napus, after 30 days in culture. (B,C): Relative expression of histone methyltransferase BnHKTM SUVR4-like (B) and demethylase BnLSD1-like (C) in control and 2.5 μM BIX-treated embryos, after 30 days in culture. Transcript levels were normalized to control embryo levels. Bars indicate the SEM. Different letters on columns indicate significant differences according to ANOVA and Tukey’s tests at p < 0.05.
FIGURE 12
FIGURE 12
Distribution patterns of methylated DNA (5mdC) in microspore proembryos formed in control conditions and short BIX-01294 treatments. 5mdC immunofluorescence and confocal laser scanning microscopy analysis in Brassica napus. Microspore proembryos of control (A–A”’), 1 μM (B–B”’) and 2.5 μM (C–C”’) BIX-01294 treated cultures. (A–C): Nomarsky’s differential interference contrast (DIC) images of the proembryo structure. (A’–C’): DAPI staining of nuclei (blue). (A”–C”): 5mdC immunofluorescence signal (green). (A”’–C”’): Merged images of DAPI (blue) and 5mdC immunofluorescence (green). The same structures are visualized under different microscopy modes in (A–A”’), (B–B”’) and (C–C”’). Bars represent 20 μm.
FIGURE 13
FIGURE 13
Quantification of effects of BIX-01294 on DNA methylation (5mdC) nuclear distribution patterns in microspore proembryos. Quantification of the percentage of nuclei showing: (a) 0 or 1 spot of 5mdC per nucleus (low DNA methylation), and (b) 2 or more spots of 5mdC per nucleus (high DNA methylation) in control, 1 and 2.5 μM BIX-treated proembryos of Brassica napus.

References

    1. Bárány I., Fadón B., Risueño M. C., Testillano P. S. (2010). Cell wall components and pectin esterification levels as markers of proliferation and differentiation events during pollen development and pollen embryogenesis in Capsicum annuum L. J. Exp. Bot. 61 1159–1175. 10.1093/jxb/erp392 - DOI - PMC - PubMed
    1. Bárány I., González-Melendi P., Fadón B., Mitykó J., Risueño M. C., Testillano P. S. (2005). Microspore-derived embryogenesis in pepper (Capsicum annuum L.): subcellular rearrangements through development. Biol. Cell 97 709–722. 10.1042/BC20040142 - DOI - PubMed
    1. Baroux C., Pien S., Grossniklaus U. (2007). Chromatin modification and remodeling during early seed development. Curr. Opin. Genet. Dev. 17 473–479. 10.1016/j.gde.2007.09.004 - DOI - PubMed
    1. Baumbusch L. O., Thorstensen T., Krauss V., Fischer A., Naumann K., Assalkhou R., et al. (2001). The Arabidopsis thaliana genome contains at least 29 active genes encoding SET domain proteins that can be assigned to four evolutionarily conserved classes. Nucleic Acids Res. 29 4319–4333. - PMC - PubMed
    1. Boskovic A., Eid A., Pontabry J., Ishiuchi T., Spiegelhalter C., Raghu Ram E. V., et al. (2014). Higher chromatin mobility supports totipotency and precedes pluripotency in vivo. Genes Dev. 28 1042–1047. 10.1101/gad.238881.114 - DOI - PMC - PubMed