. 2015 Jan 1;6(1):613-617.
doi: 10.1039/c4sc03141e. Epub 2014 Nov 4.

Reversible photo-induced trap formation in mixed-halide hybrid perovskites for photovoltaics

Affiliations

Reversible photo-induced trap formation in mixed-halide hybrid perovskites for photovoltaics

Eric T Hoke et al. Chem Sci. .

Abstract

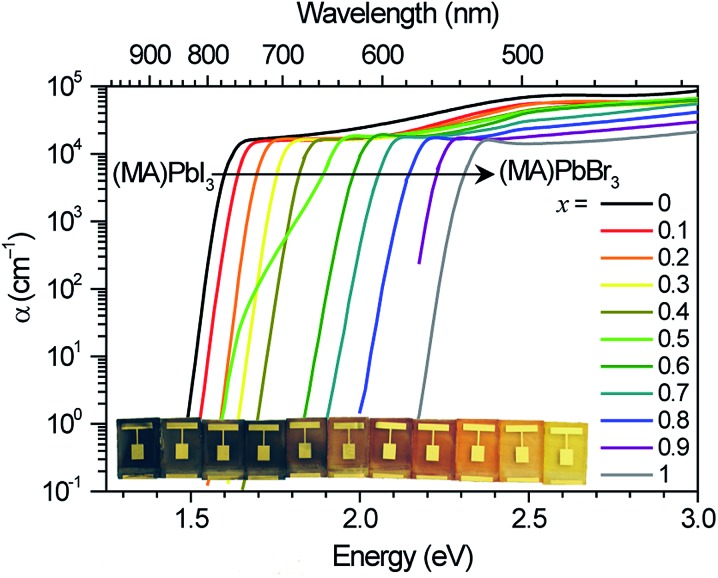
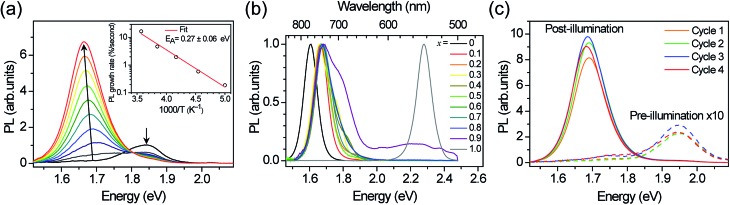
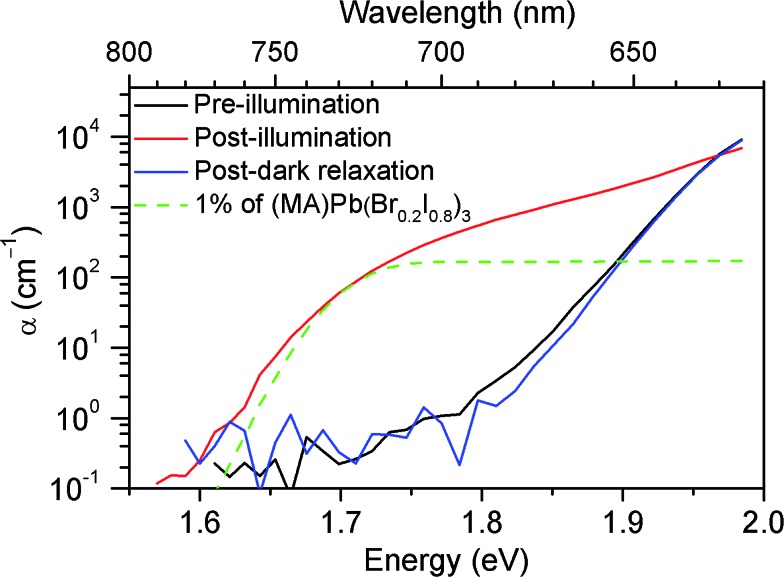
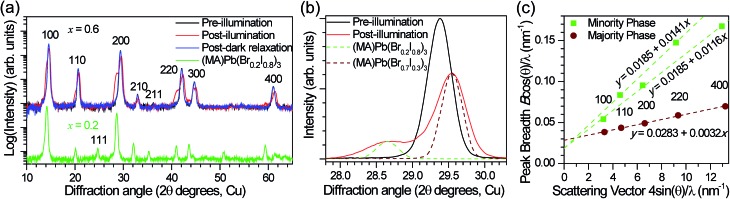
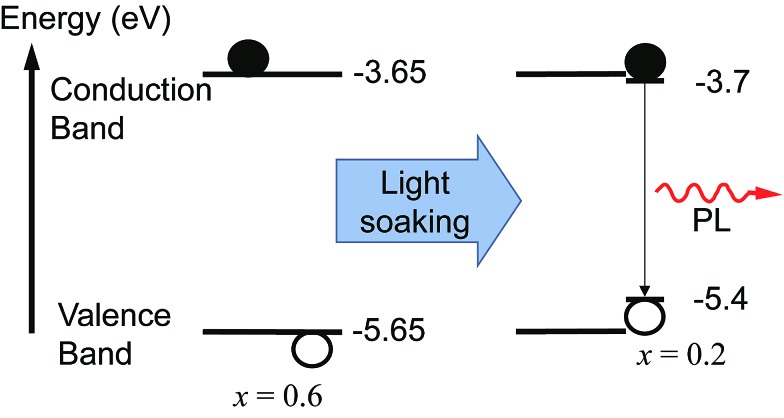
We report on reversible, light-induced transformations in (CH3NH3)Pb(Br x I1-x )3. Photoluminescence (PL) spectra of these perovskites develop a new, red-shifted peak at 1.68 eV that grows in intensity under constant, 1-sun illumination in less than a minute. This is accompanied by an increase in sub-bandgap absorption at ∼1.7 eV, indicating the formation of luminescent trap states. Light soaking causes a splitting of X-ray diffraction (XRD) peaks, suggesting segregation into two crystalline phases. Surprisingly, these photo-induced changes are fully reversible; the XRD patterns and the PL and absorption spectra revert to their initial states after the materials are left for a few minutes in the dark. We speculate that photoexcitation may cause halide segregation into iodide-rich minority and bromide-enriched majority domains, the former acting as a recombination center trap. This instability may limit achievable voltages from some mixed-halide perovskite solar cells and could have implications for the photostability of halide perovskites used in optoelectronics.


Figures

Fig. 1
Fig. 1. Absorption coefficient of (MA)Pb(BrxI1–x)3 measured by diffuse spectral reflection and transmission measurements on thin films and photocurrent spectroscopy of solar cells. Inset: photograph of (MA)Pb(BrxI1–x)3 photovoltaic devices from x = 0 to x = 1 (left to right).
Fig. 2
Fig. 2. (a) Photoluminescence (PL) spectra of an x = 0.4 thin film over 45 s in 5 s increments under 457 nm, 15 mW cm–2 light at 300 K. Inset: temperature dependence of initial PL growth rate. (b) Normalized PL spectra of (MA)Pb(BrxI1–x)3 thin films after illuminating for 5–10 minutes with 10–100 mW cm–2, 457 nm light. (c) PL spectra of an x = 0.6 thin film after sequential cycles of illumination for 2 minutes (457 nm, 15 mW cm–2) followed by 5 minutes in the dark.
Fig. 3
Fig. 3. Absorption spectra of an x = 0.6 film before (black) and after (red) white-light soaking for 5 minutes at 100 mW cm–2, and after 1 h in the dark (blue). A scaled absorption spectrum of an x = 0.2 film (dashed green) is shown for comparison.
Fig. 4
Fig. 4. (a) XRD pattern of an x = 0.6 film before (black) and after (red) white-light soaking for 5 minutes at ∼50 mW cm–2, and after 2 h in the dark (blue). The XRD pattern of an x = 0.2 film (green) is offset for comparison. (b) The 200 XRD peak of an x = 0.6 film before (black) and after (red) white-light soaking for 5 minutes at ∼50 mW cm–2. XRD patterns of an x = 0.2 film (dashed green) and an x = 0.7 film (dashed brown) are included for comparison. (c) Williamson–Hall plot of the XRD peak full width at half maximum (B) for the minority (green, larger lattice spacing) and majority (brown, smaller lattice spacing) phases observed in (MA)Pb(Br0.6I0.4)3 (x = 0.6) thin films under illumination. θ is the diffraction angle and λ = 1.54060 Å (copper Kα1) is the X-ray wavelength. The points are labeled with their crystallographic indices. Linear regressions to the data are plotted and the equations are listed. The minority phase was fit assuming the same crystallite size in the 100 and 110 directions but different amounts of strain disorder.
Fig. 5
Fig. 5. Schematic of the proposed mechanism for photo-induced trap formation through halide segregation. Photogenerated holes or excitons may stabilize the formation of iodide-enriched domains which then dominate the photoluminescence. The valence band (VB) and conduction band (CB) energies with respect to vacuum were estimated by interpolation of published values obtained from ultraviolet photoemission spectroscopy (UPS) and inverse photoemission spectroscopy (IPES) for the endpoint stoichiometries.

References

    1. Kojima A., Teshima K., Shirai Y., Miyasaka T. J. Am. Chem. Soc. 2009;131:6050–6051. - PubMed
    1. Im J.-H., Lee C.-R., Lee J.-W., Park S.-W., Park N.-G. Nanoscale. 2011;3:4088–4093. - PubMed
    1. Kim H.-S., Lee C.-R., Im J.-H., Lee K.-B., Moehl T., Marchioro A., Moon S.-J., Humphry-Baker R., Yum J.-H., Moser J. E., Grätzel M., Park N.-G. Sci. Rep. 2012;2:591. - PMC - PubMed
    1. Lee M. M., Teuscher J., Miyasaka T., Murakami T. N., Snaith H. J. Science. 2012;338:643–647. - PubMed
    1. Burschka J., Pellet N., Moon S.-J., Humphry-Baker R., Gao P., Nazeeruddin M. K., Grätzel M. Nature. 2013;499:316–319. - PubMed