. 2015 Jun 1;6(6):3314-3320.
doi: 10.1039/c4sc03853c. Epub 2015 Jan 14.

G-quadruplex DNA and ligand interaction in living cells using NMR spectroscopy

Affiliations

G-quadruplex DNA and ligand interaction in living cells using NMR spectroscopy

Gilmar F Salgado et al. Chem Sci. .

Abstract

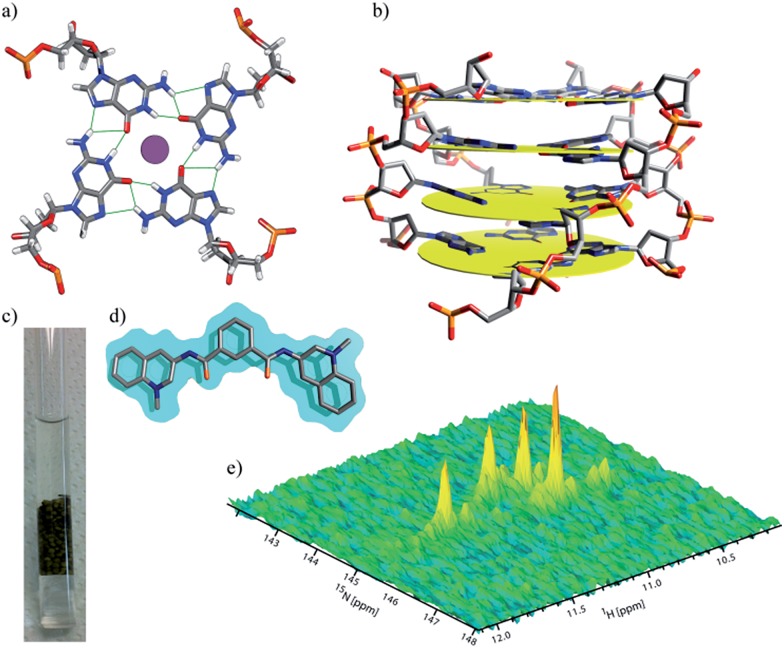
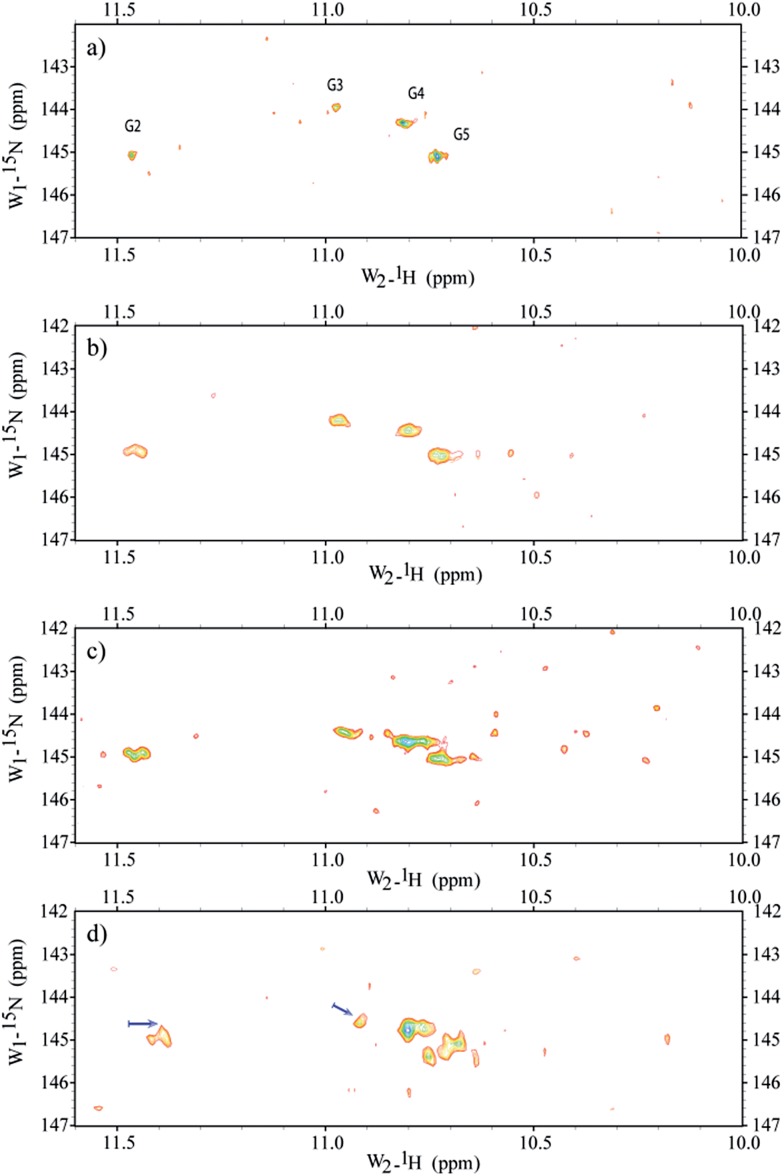
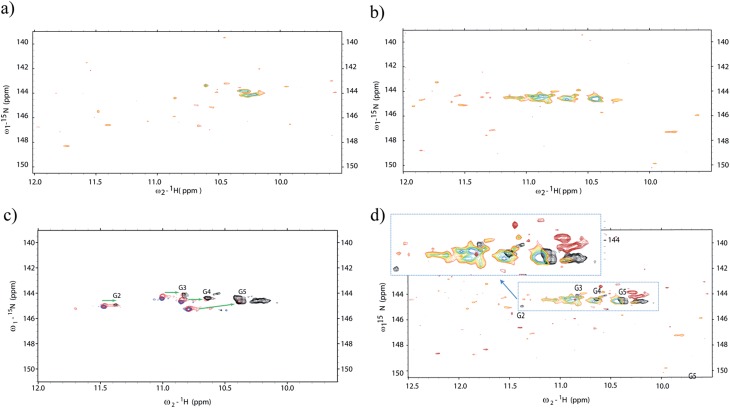
Gathering structural information from biologically relevant molecules inside living cells has always been a challenging task. In this work, we have used multidimensional NMR spectroscopy to probe DNA G-quadruplexes inside living Xenopus laevis oocytes. Some of these structures can be found in key regions of chromosomes. G-quadruplexes are considered potential anticancer therapeutic targets and several lines of evidence indirectly point out roles in key biological processes, such as cell proliferation, genomic instability or replication initiation. However, direct demonstrations of the existence of G-quadruplexes in vivo are scarce. Using SOFAST-HMQC type spectra, we probed a tetramolecular G-quadruplex model made of d(TG4T)4 inside living Xenopus laevis oocytes. Our observations lead us to conclude that the quadruplex structure is formed within the cell and that the intracellular environment preferentially selects a conformation that most resembles the one found in vitro under KCl conditions. We also show for the first time that specific ligands targeting G-quadruplexes can be studied using high resolution NMR directly inside living cells, opening new avenues to study ligand binding discrimination under physiologically relevant conditions with atomic detail.


Figures

Fig. 1
Fig. 1. Display of a typical tetrad of guanines, held by a network of hydrogen bonds, coordinating with a central metal cation in between two tetrads (a). Schematic representation of a stack of four tetrads commonly found in d(TG4T)4 (b). A 5 mm NMR Shigemi tube loaded with ∼200 Xenopus oocytes in 20% Ficoll buffer (c). Structure of ligand 360A (d). Imino signature of d(TG4T)4 in KCl buffer (e) obtained using a 1H–15N SOFAST-HMQC pulse sequence.
Fig. 2
Fig. 2. Time spectral evolution of d(TG4T)4 inside Xenopus oocytes. Spectra obtained after a period of 8 h (a), 16 h (b), 26 h (c) and 32 h (d) from assembly of ∼200 oocytes in the NMR tube. The sample buffer surrounding the oocytes inside the NMR tube was replaced every ∼12 h with a fresh solution, and a spectrum of the buffer where the oocytes were resuspended was measured under the same conditions as the control. All controls revealed that no apparent leakage occurred for periods up to 24 h. Between 26 and 32 h some leakage was visible and after 36 h there were several damaged cells and naturally the “leakage” into the surrounding buffer was substantial (data not shown). The results show that d(TG4T)4 is a robust structure that possesses a good spectral time-window (∼24 h), allowing the study of its interaction with ligands inside Xenopus laevis oocytes. Arrows indicate the most pronounced chemical shift deviation (∼0.1 ppm).
Fig. 3
Fig. 3. Probing the ligand interaction with d(TG4T)4 using 1H–15N SOFAST-HMQC in vitro and in-cell. (a) Ligand incubated and freely diffused from the NMR tube buffer to the oocytes interior, previously microinjected with d(TG4T)4. In (b) we can see the in-cell spectrum that resulted from the incubation of a 2.5 molar ratio of ligand 360A with d(TG4T)4 for a period of 4 hours (room temperature) prior to co-microinjection in ∼200 Xenopus oocytes. Part (c) depicts the NMR titration experiments in vitro without ligand (blue), after incubation with 1 (red) and 2.5 (black) molar ratios of ligand to moles of d(TG4T)4. (d) Shows different spectra from (a) and (b) overlaid with the black spectrum of (c). All spectra were acquired at 16 °C. The spectra clearly show important differences in the organization of the d(TG4T)4 tetrads after ligand binding in vitro compared to the changes observed in-cell. All spectra were analysed taking into account peak assignments described previously, together with in vitro 1H–15N HSQC titration of d(TG4T)4 with 360A.

References

    1. Pommier Y. ACS Chem. Biol. 2013;8:82–95. - PMC - PubMed
    1. Collie G. W., Parkinson G. N. Chem. Soc. Rev. 2011;40:5867–5892. - PubMed
    1. Hurley L. H., Wheelhouse R. T., Sun D., Kerwin S. M., Salazar M., Fedoroff O. Y., Han F. X., Han H., Izbicka E., Von Hoff D. D. Pharmacol. Ther. 2000;85:141–158. - PubMed
    1. Balasubramanian S., Hurley H. L., Neidle S. Nat. Rev. Drug Discovery. 2011;10:261–275. - PMC - PubMed
    1. Wong H. M., Payet L., Huppert J. L. Curr. Opin. Mol. Ther. 2009;11:146–155. - PubMed