. 2017 Jun 27:7:24.
doi: 10.4103/jcis.JCIS_18_17. eCollection 2017.

Rationale of Using Dynamic Imaging for Characterization of Suspicious Lung Masses into Benign or Malignant on Contrast Enhanced Multi Detector Computed Tomography

Affiliations

Rationale of Using Dynamic Imaging for Characterization of Suspicious Lung Masses into Benign or Malignant on Contrast Enhanced Multi Detector Computed Tomography

Sachin Khanduri et al. J Clin Imaging Sci. .

Abstract

Objectives: To assess the utility of dynamic imaging namely, wash-in and wash-out characteristics through multidetector contrast-enhanced computed tomography in differentiating benign and malignant pulmonary masses.

Materials and methods: Seventy-three patients who were suspected to have malignant pulmonary mass on the basis of clinical symptoms and chest radiograph were included in the study. All the patients underwent multidetector computed tomography scanning, and three series of images were obtained for each patient-noncontrast, early enhanced, and 15 min delayed enhanced scans. Computed tomography (CT) findings were assessed in terms of washin, absolute, and relative percentage washout of contrast. Biopsy of the mass was done and sent for histopathological evaluation. Sensitivity, specificity, and area under curve for diagnosing malignancy in the lung masses were calculated by considering both the wash-in and wash-out characteristics at dynamic CT and plotting the receiver operating curve after the final diagnosis which was obtained by histopathological evaluation.

Results: Threshold net enhancement (washin) value of >22.5 HU had sensitivity, specificity, and diagnostic accuracy of 88.5%, 57.1%, and 82%, respectively, in predicting malignancy. Threshold relative percentage washout of <16.235% had 98.1%, 85.7%, and 94% sensitivity, specificity, and diagnostic accuracy, respectively, and threshold absolute percentage washout of <42.72% had 98.1%, 95.2%, and 95% sensitivity, specificity, and diagnostic accuracy, respectively, in predicting malignancy.

Conclusion: Threshold net enhancement (washin), absolute and relative washout percentages can be used to predict malignancy with very high diagnostic yield, and possibly obviate the need of invasive procedures for diagnosis of bronchogenic carcinoma.

Keywords: Contrast wash-in; contrast wash-out; histopathology; lung mass; multidetector computed tomography.


Conflict of interest statement

There are no conflicts of interest.

Figures
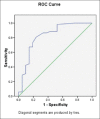
Figure 1
Figure 1
The graph depicting results of the receiver operator characteristic analysis to differentiate between benign and malignant lesions with regard to net enhancement attenuation (wash-in) on contrast-enhanced computed tomography in early phase. The area under curve is 0.827, P < 0.001.
Figure 2
Figure 2
The graph depicting results of the receiver operator characteristic analysis to differentiate between benign and malignant lesions with regard to absolute attenuation value on contrast-enhanced computed tomography in early phase. The area under curve is 0.950, P < 0.001.
Figure 3
Figure 3
The graph depicting the results of the receiver operator characteristic analysis for differentiating between malignant and benign pulmonary masses with regard to mean absolute washout at contrast-enhanced computed tomography. The area under curve is 0.958, P < 0.001.
Figure 4
Figure 4
The graph depicting the results of the receiver operator characteristic analysis for differentiating between malignant and benign pulmonary masses with regard to mean relative washout at contrast-enhanced computed tomography. The area under curve is 0.942, P < 0.001.
Figure 5
Figure 5
(a) A 55-year-old male patient presented with complaints of cough and dyspnea for 2 months. Chest radiograph (posteroanterior view) of the same patient shows a well-defined radiopacity (marked by the black arrow) in the left lung middle zone. The lesion is seen merging with the left hilum; however, the cardiac silhouette is visualized separately. The patient was advised to undergo contrast-enhanced computed tomography thorax for the suspected lung mass. (b) Noncontrast multidetector computed tomography axial section (mediastinal window) of the same patient shows a well-defined soft tissue density lesion in the left lower lobe with an average attenuation of 40 HU in the region of interest (shown by the circle). (c) Contrast-enhanced multidetector computed tomography axial section (mediastinal window) in early phase of the same patient shows a heterogeneously enhancing lobulated mass lesion with an average attenuation of 67 HU in the region of interest (shown by the circle). The lesion is extending into the mediastinum with encasement of aorta and extrinsic compression along with luminal narrowing of the left main bronchus. (d) Contrast-enhanced multidetector computed tomography axial section (mediastinal window) in delayed phase (at 15 min) of the same patient shows an enhancing lesion with an average attenuation of 64 HU in the region of interest (shown by the circle). The absolute wash out comes out to be 11.11% and the relative washout comes out to be 4.47%. (e) The patient underwent computed tomography-guided biopsy of the lesion for histopathological correlation. The axial multidetector computed tomography scan (mediastinal window) shows biopsy needle (marked by the black arrow) within the lesion. (f) Computed tomography-guided biopsy specimen section stained with H and E (at low power) shows malignant cells with high N:C ratio and moderate amount of cytoplasm. The cells are in sheets and few of them are forming glands (marked by the black arrow) consistent with the diagnosis of adenocarcinoma.
Figure 6
Figure 6
(a) A 52-year-old male patient presented with complaints of cough, fever, and chest pain for 1 month. An ill-defined radiopacity (denoted by the arrow) is noted in apical region of the right lung. There is no evidence of bone destruction or cavitation. Fibrotic changes are noted in the right middle zone. The patient was advised to undergo contrast-enhanced computed tomography thorax for the suspected lung mass. (b) Noncontrast multidetector computed tomography axial section (mediastinal window) of the same patient shows a well-defined soft tissue density lesion in the apical segment of the right upper lobe with an average attenuation of 42 HU in the region of interest (shown by the circle). The lesion is abutting the pleura on anteroposterior and lateral aspects. (c) Contrast-enhanced multidetector computed tomography axial section (mediastinal window) in early phase of the same patient shows variegated enhancement in the lesion with an average attenuation of 75 HU in the region of interest (shown by the circle). No mediastinal extension or vascular encasement is seen. (d) Contrast-enhanced multidetector computed tomography axial section (mediastinal window) in delayed phase (at 15 min) of the same patient shows the lesion with an average attenuation of 54 HU in the region of interest (shown by the circle). The absolute washout comes out to be 63.63% and the relative washout comes out to be 28%. (e) The patient underwent computed tomography-guided biopsy for histopathological correlation. The axial multidetector computed tomography scan (mediastinal window) shows biopsy needle (marked by the black arrow) within the lesion. (f) Computed tomography-guided biopsy specimen section stained with H and E (at low power) shows large areas of caseous necrosis (marked by the black arrow). The section also shows epithelioid cells forming granulomas on a background of chronic inflammatory infiltrates with areas of necrosis consistent with the diagnosis of tuberculosis.

Similar articles

References

    1. Erasmus JJ, Connolly JE, McAdams HP, Roggli VL. Solitary pulmonary nodules: Part I. Morphologic evaluation for differentiation of benign and malignant lesions. Radiographics. 2000;20:43–58. - PubMed
    1. Swensen SJ, Viggiano RW, Midthun DE, Müller NL, Sherrick A, Yamashita K, et al. Lung nodule enhancement at CT: Multicenter study. Radiology. 2000;214:73–80. - PubMed
    1. Swensen SJ, Brown LR, Colby TV, Weaver AL, Midthun DE. Lung nodule enhancement at CT: Prospective findings. Radiology. 1996;201:447–55. - PubMed
    1. Yi CA, Lee KS, Kim EA, Han J, Kim H, Kwon OJ, et al. Solitary pulmonary nodules: Dynamic enhanced multi-detector row CT study and comparison with vascular endothelial growth factor and microvessel density. Radiology. 2004;233:191–9. - PubMed
    1. Swensen SJ, Brown LR, Colby TV, Weaver AL. Pulmonary nodules: CT evaluation of enhancement with iodinated contrast material. Radiology. 1995;194:393–8. - PubMed