. 2016:1:0005.
doi: 10.1038/s41562-016-0005. Epub 2016 Dec 12.

Childhood forecasting of a small segment of the population with large economic burden

Affiliations

Childhood forecasting of a small segment of the population with large economic burden

Avshalom Caspi et al. Nat Hum Behav. 2016.

Abstract

Policy-makers are interested in early-years interventions to ameliorate childhood risks. They hope for improved adult outcomes in the long run, bringing return on investment. How much return can be expected depends, partly, on how strongly childhood risks forecast adult outcomes. But there is disagreement about whether childhood determines adulthood. We integrated multiple nationwide administrative databases and electronic medical records with the four-decade Dunedin birth-cohort study to test child-to-adult prediction in a different way, by using a population-segmentation approach. A segment comprising one-fifth of the cohort accounted for 36% of the cohort's injury insurance-claims; 40% of excess obese-kilograms; 54% of cigarettes smoked; 57% of hospital nights; 66% of welfare benefits; 77% of fatherless childrearing; 78% of prescription fills; and 81% of criminal convictions. Childhood risks, including poor age-three brain health, predicted this segment with large effect sizes. Early-years interventions effective with this population segment could yield very large returns on investment.


Figures

Figure 1
Figure 1
Measuring the concentration of economic-burden outcomes in a birth cohort. The data represent information about 940 people who were born in one hospital in 1972-73 and are life-long participants in the Dunedin Longitudinal Study. The panels show that a minority of individuals accounts for a majority of outcomes in a birth cohort, in each of 8 different social and health sectors: social welfare (Panel A), fatherless children (Panel B), smoking (Panel C), excess obese kilograms (Panel D), hospital stays (Panel E), prescription fills (Panel F), injury claims (Panel G), and crime (Panel H). Each Panel displays the cumulative distribution of an outcome in the cohort. To find the proportion of each outcome that 20% of the population accounts for, start at 20% on the vertical axis and follow arrow 1 to the right, to the purple line; then, follow arrow 2 up to the blue line; and then follow arrow 3 to the left, back to the vertical axis to find the corresponding proportion of the total.
Figure 1
Figure 1
Measuring the concentration of economic-burden outcomes in a birth cohort. The data represent information about 940 people who were born in one hospital in 1972-73 and are life-long participants in the Dunedin Longitudinal Study. The panels show that a minority of individuals accounts for a majority of outcomes in a birth cohort, in each of 8 different social and health sectors: social welfare (Panel A), fatherless children (Panel B), smoking (Panel C), excess obese kilograms (Panel D), hospital stays (Panel E), prescription fills (Panel F), injury claims (Panel G), and crime (Panel H). Each Panel displays the cumulative distribution of an outcome in the cohort. To find the proportion of each outcome that 20% of the population accounts for, start at 20% on the vertical axis and follow arrow 1 to the right, to the purple line; then, follow arrow 2 up to the blue line; and then follow arrow 3 to the left, back to the vertical axis to find the corresponding proportion of the total.
Figure 2
Figure 2
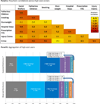
The aggregation of adult economic-burden outcomes. The polychoric correlations in Panel A show that high-cost group members in one sector were significantly more likely to re-appear as high-cost in other sectors. Panel B shows that the distribution of high-cost individuals across multiple sectors deviated from the expectation of a random distribution, χ2 (7, N = 940) = 2103.44, p < 0.001, with excesses at the two tails (i.e., there are more people than expected who do not belong to any high-cost group and there are more people than expected who belong to multiple high-cost groups). The expected distribution is based on the assumption that the high-cost groups were independent and did not overlap beyond chance. The observed:expected ratios in each cell are: 1.83, .80, .71, .52, 1.45, 5.09, 16.89, 120.53, 439.47.
Figure 3
Figure 3
Predicting the probability of economic-burden outcomes. In Panels A-C we tested the predictive performance of a model that included information about four childhood risk factors. We assessed discrimination (that is, the model’s ability to classify correctly) using the area under the receiver-operating-characteristic curve (AUC). The diagonal line in each panel indicates random classification. Points above the diagonal represent good (better than random) classification results. Panel A shows that childhood factors only modestly predicted which cohort members belonged to any particular single high-cost group. Panel B shows that classification improved when predicting who belonged to multiple high-cost groups. Panel C shows the results of a leave-one-out analysis and documents that accurate prediction was not simply an artifact of predicting one high-cost group well. Panel D shows that, reaching back to early childhood, age-3 brain health predicted which cohort members belonged to multiple high-cost groups. All models included sex. Models in Panels A-C included childhood socioeconomic status (SES), childhood maltreatment, IQ,and self-control. * Time spent outside New Zealand is added as a covariate in analyses that use New Zealand administrative data. AUC = Area Under the Curve.
Figure 3
Figure 3
Predicting the probability of economic-burden outcomes. In Panels A-C we tested the predictive performance of a model that included information about four childhood risk factors. We assessed discrimination (that is, the model’s ability to classify correctly) using the area under the receiver-operating-characteristic curve (AUC). The diagonal line in each panel indicates random classification. Points above the diagonal represent good (better than random) classification results. Panel A shows that childhood factors only modestly predicted which cohort members belonged to any particular single high-cost group. Panel B shows that classification improved when predicting who belonged to multiple high-cost groups. Panel C shows the results of a leave-one-out analysis and documents that accurate prediction was not simply an artifact of predicting one high-cost group well. Panel D shows that, reaching back to early childhood, age-3 brain health predicted which cohort members belonged to multiple high-cost groups. All models included sex. Models in Panels A-C included childhood socioeconomic status (SES), childhood maltreatment, IQ,and self-control. * Time spent outside New Zealand is added as a covariate in analyses that use New Zealand administrative data. AUC = Area Under the Curve.
Figure 4
Figure 4
The big footprint of multiple-high-cost users. Panel A shows that although the multiple-high-cost group made up only 22% of the cohort (N = 207), it accounted for a disproportionate share of economic-burden outcomes across all 8 health and social sectors that we examined. In contrast, Panel B shows that a substantial segment of the cohort did not belong to any high-cost group (30%; N = 289) and left an unusually light footprint on society.

Similar articles

Cited by

References

    1. Almond D, Currie J. Human capital development before age five. 2010 < http://www.nber.org/papers/w15827>.
    1. Duncan GJ, Magnuson K. Investing in preschool programs. Journal of Economic Perspectives. 2013;27:109–131. - PMC - PubMed
    1. Campbell F, et al. Early childhood investments substantially boost adult health. Science. 2014;343:1478–1485. - PMC - PubMed
    1. Gertler P, et al. Labor market returns to an early childhood stimulation intervention in Jamaica. Science. 2014;344:998–1001. - PMC - PubMed
    1. Heckman J, Pinto R, Savelyev P. Understanding the mechanisms through which an influential early childhood program boosted adult outcomes. American Economic Review. 2013;103:2052–2086. - PMC - PubMed

LinkOut - more resources