Genomic prediction of starch content and chipping quality in tetraploid potato using genotyping-by-sequencing
- PMID: 28707250
- PMCID: PMC5606954
- DOI: 10.1007/s00122-017-2944-y
Genomic prediction of starch content and chipping quality in tetraploid potato using genotyping-by-sequencing
Abstract
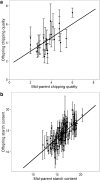
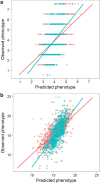
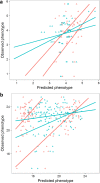
Genomic prediction models for starch content and chipping quality show promising results, suggesting that genomic selection is a feasible breeding strategy in tetraploid potato. Genomic selection uses genome-wide molecular markers to predict performance of individuals and allows selections in the absence of direct phenotyping. It is regarded as a useful tool to accelerate genetic gain in breeding programs, and is becoming increasingly viable for crops as genotyping costs continue to fall. In this study, we have generated genomic prediction models for starch content and chipping quality in tetraploid potato to facilitate varietal development. Chipping quality was evaluated as the colour of a potato chip after frying following cold induced sweetening. We used genotyping-by-sequencing to genotype 762 offspring, derived from a population generated from biparental crosses of 18 tetraploid parents. Additionally, 74 breeding clones were genotyped, representing a test panel for model validation. We generated genomic prediction models from 171,859 single-nucleotide polymorphisms to calculate genomic estimated breeding values. Cross-validated prediction correlations of 0.56 and 0.73 were obtained within the training population for starch content and chipping quality, respectively, while correlations were lower when predicting performance in the test panel, at 0.30-0.31 and 0.42-0.43, respectively. Predictions in the test panel were slightly improved when including representatives from the test panel in the training population but worsened when preceded by marker selection. Our results suggest that genomic prediction is feasible, however, the extremely high allelic diversity of tetraploid potato necessitates large training populations to efficiently capture the genetic diversity of elite potato germplasm and enable accurate prediction across the entire spectrum of elite potatoes. Nonetheless, our results demonstrate that GS is a promising breeding strategy for tetraploid potato.
Conflict of interest statement
HGK is employed by the commercial breeding company LKF Vandel. All other authors declare that they have no conflict of interest.
Figures


Similar articles
-
The Value of Expanding the Training Population to Improve Genomic Selection Models in Tetraploid Potato.Front Plant Sci. 2018 Aug 6;9:1118. doi: 10.3389/fpls.2018.01118. eCollection 2018. Front Plant Sci. 2018. PMID: 30131817 Free PMC article.
-
Identification and reproducibility of diagnostic DNA markers for tuber starch and yield optimization in a novel association mapping population of potato (Solanum tuberosum L.).Theor Appl Genet. 2016 Apr;129(4):767-785. doi: 10.1007/s00122-016-2665-7. Epub 2016 Jan 29. Theor Appl Genet. 2016. PMID: 26825382 Free PMC article.
-
Physical mapping of QTL for tuber yield, starch content and starch yield in tetraploid potato (Solanum tuberosum L.) by means of genome wide genotyping by sequencing and the 8.3 K SolCAP SNP array.BMC Genomics. 2017 Aug 22;18(1):642. doi: 10.1186/s12864-017-3979-9. BMC Genomics. 2017. PMID: 28830357 Free PMC article.
-
Bridging the gap between genome analysis and precision breeding in potato.Trends Genet. 2013 Apr;29(4):248-56. doi: 10.1016/j.tig.2012.11.006. Epub 2012 Dec 20. Trends Genet. 2013. PMID: 23261028 Review.
-
Improving Genetic Gain with Genomic Selection in Autotetraploid Potato.Plant Genome. 2016 Nov;9(3). doi: 10.3835/plantgenome2016.02.0021. Plant Genome. 2016. PMID: 27902807 Review.
Cited by
-
Optimizing whole-genomic prediction for autotetraploid blueberry breeding.Heredity (Edinb). 2020 Dec;125(6):437-448. doi: 10.1038/s41437-020-00357-x. Epub 2020 Oct 19. Heredity (Edinb). 2020. PMID: 33077896 Free PMC article.
-
Genotyping by sequencing can reveal the complex mosaic genomes in gene pools resulting from reticulate evolution: a case study in diploid and polyploid citrus.Ann Bot. 2019 Jul 8;123(7):1231-1251. doi: 10.1093/aob/mcz029. Ann Bot. 2019. PMID: 30924905 Free PMC article.
-
Prediction based on estimated breeding values using genealogy for tuber yield and late blight resistance in auto-tetraploid potato (Solanum tuberosum L.).Heliyon. 2020 Nov 30;6(11):e05624. doi: 10.1016/j.heliyon.2020.e05624. eCollection 2020 Nov. Heliyon. 2020. PMID: 33305041 Free PMC article.
-
Genomic Selection with Allele Dosage in Panicum maximum Jacq.G3 (Bethesda). 2019 Aug 8;9(8):2463-2475. doi: 10.1534/g3.118.200986. G3 (Bethesda). 2019. PMID: 31171567 Free PMC article.
-
To be or not to be tetraploid-the impact of marker ploidy on genomic prediction and GWAS of potato.Front Plant Sci. 2024 Jul 30;15:1386837. doi: 10.3389/fpls.2024.1386837. eCollection 2024. Front Plant Sci. 2024. PMID: 39139728 Free PMC article.
References
-
- Aronesty E. Comparison of sequencing utility programs. Open Bioinform J. 2013
-
- Arruda MP, Brown PJ, Lipka AE, Krill AM, Thurber C, Kolb FL. Genomic selection for predicting fusarium head blight resistance in a Wheat Breeding Program. Plant Genome. 2015;8(november):1–12. - PubMed
-
- Ashraf BH, Byrne S, Fé D, Czaban A, Asp T, Pedersen MG, Lenk I, Roulund N, Didion T, Jensen CS, Jensen J, Janss LL. Estimating genomic heritabilities at the level of family-pool samples of perennial ryegrass using genotyping-by-sequencing. Theor Appl Genet. 2016;129(1):45–52. doi: 10.1007/s00122-015-2607-9. - DOI - PMC - PubMed
-
- Asoro FG, Newell MA, Beavis WD, Scott MP, Jannink J-L. Accuracy and training population design for genomic selection on quantitative traits in Elite North American Oats. Plant Genome J. 2011;4(2):132. doi: 10.3835/plantgenome2011.02.0007. - DOI
MeSH terms
Substances
Grants and funding
LinkOut - more resources
Full Text Sources
Other Literature Sources

