. 2017 Aug;6(8):1882-1892.
doi: 10.1002/cam4.1116. Epub 2017 Jul 14.

Time-dependent and nonlinear effects of prognostic factors in nonmetastatic colorectal cancer

Affiliations

Time-dependent and nonlinear effects of prognostic factors in nonmetastatic colorectal cancer

Sheng-Qiang Chi et al. Cancer Med. 2017 Aug.

Abstract

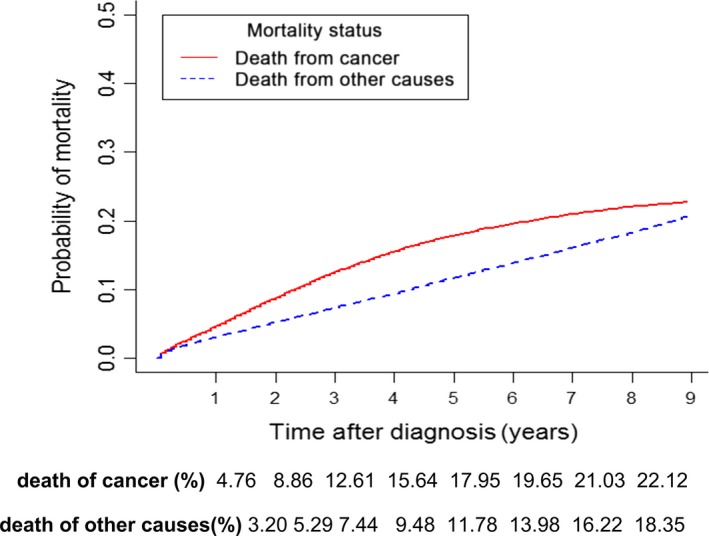
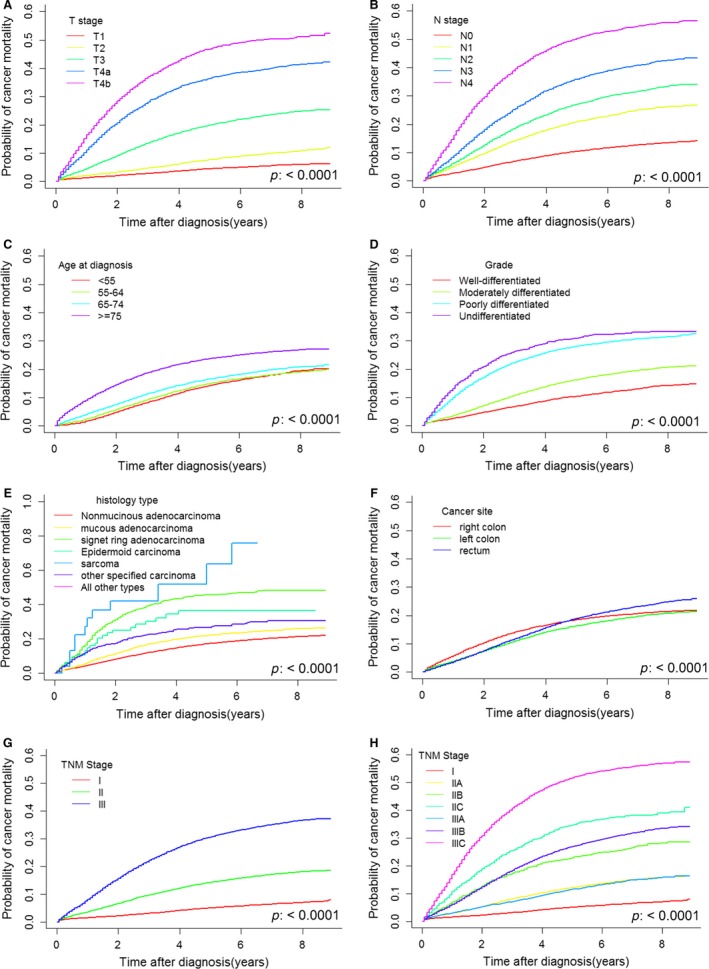
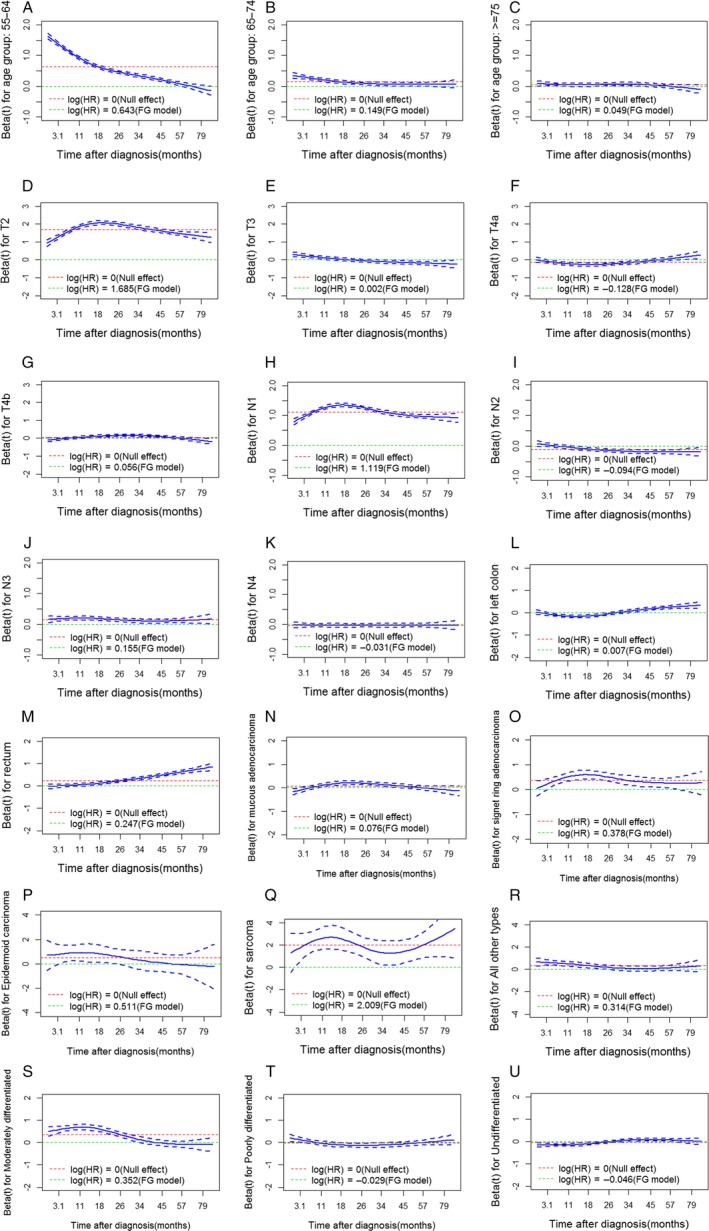
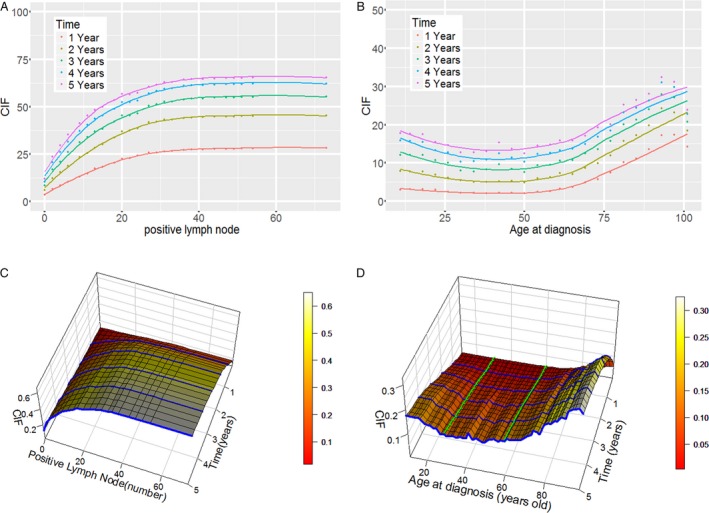
The survival risk following curative surgery for nonmetastatic colorectal cancer (CRC) may be over- or underestimated due to a lack of attention to nonlinear effects and violation of the proportional hazards assumption. In this paper, we aimed to detect and interpret the shape of time-dependent and nonlinear effects to improve the predictive performance of models of prognoses in nonmetastatic CRC patients. Data for nonmetastatic CRC patients diagnosed between 2004 and 2012 were obtained from the Surveillance Epidemiology End Results registry. Time-dependent and nonlinear effects were tested and plotted. A nonlinear model that used random survival forests was implemented. The estimated 5-year cancer-specific death rate was 17.95% (95% CI, 17.70-18.20%). Tumor invasion depth, lymph node status, age at diagnosis, tumor grade, histology and tumor site were significantly associated with cancer-specific death. Nonlinear and time-dependent effects on survival were detected. Positive lymph node number had a larger effect per unit of measurement at low values than at high values, whereas age at diagnosis showed the opposite pattern. Moreover, nonproportional hazards were detected for all covariates, indicating that the contributions of these risks to survival outcomes decreased over time. The nonlinear model predicted prognoses more accurately (C-index: 0.7934, 0.7933-0.7934) than did the Fine and Gray model (C-index: 0.7550, 0.7510-0.7583). The three-dimensional cumulative incidence curves derived from nonlinear model were used to identify the change points of the risk trends. It would be useful to implement these findings in treatment plans and follow-up surveillance in nonmetastatic CRC patients.

Keywords: time-dependent effects; Colorectal cancer; SEER; nonlinear effects.


Figures

Figure 1
Figure 1
Cumulative incidence curves for cancer‐specific mortality and mortality from other causes, which were evaluated as competing events in patients with nonmetastatic colorectal cancer.
Figure 2
Figure 2
The estimated cumulative incidence curves for T stage (A), N stage (B), age at diagnosis (C), tumor grade (D), histological type (E), tumor site (F), TNM stage (G), and TNM stage subgroups (H) from the univariate analysis performed using the cumulative incidence competing risk method. The left colon includes the splenic flexure, descending colon, and sigmoid colon; and the right colon includes the cecum, appendix, ascending colon, hepatic flexure, and transverse colon. The subgroups of TNM stage were designated according to the 7th edition of the AJCC TNM staging system (stage I: T1‐2N0, stage IIA: T3N0, stage IIB: T4aN0, stage IIC: T4bN0, stage IIIA: T1‐2N1 and T1N2a, stage IIIB: T3‐4aN1, T2‐3N2a, and T1‐2N2b, stage IIIC: T4bN1, T4N2a, and T3‐4N2b).
Figure 3
Figure 3
Scaled Schoenfeld residuals for age at diagnosis, T stage, N stage, tumor site, histological type, and tumor grade with 95% confidence intervals. Residuals were used to visualize the log cause‐specific hazard rates for each covariate over time. Green lines represent the null effect (no effect on survival outcomes when Log(HR) is equal to 0), and red lines represent the average log cause‐specific hazard rate as estimated using the Fine and Gray (FG) model. The 55–64‐year‐old age group (A), 65–74‐year‐old age group (B), T3 (E), T4a (F), N1a (H), N1b (I), moderately differentiated tumor grade (S), undifferentiated tumor grade (U), other histological types (R), and tumor site (L, M) were found to be most likely to contribute to nonproportionality. For example, for age between 55 and 64 years, the effect changed over time, tending to diminish in the early years and then become protective later. For age between 65 and 74 years, this group had a higher risk than did the baseline group (age < 55 years) in the early years, whereas this impact tended to disappear later. For age older than 74 years, the effect tended to be constant. The FG model in the figure represents the Fine and Gray model, and HR represents the subdistribution hazard rate.
Figure 4
Figure 4
Nonlinear effects of positive lymph node and age at diagnosis in nonmetastatic colorectal cancer and their three‐dimensional cumulative incidence curves. Panel A shows the nonlinear effect of a diagnosis of positive lymph nodes; panel B shows the nonlinear effect of age at diagnosis; panel C shows the cumulative incidence function of a diagnosis of positive lymph nodes, where the blue lines represent 1‐ to 5‐year cumulative incidence functions as the number of positive lymph nodes increases; and panel D shows the cumulative incidence function of age at diagnosis, where the blue lines represent 1–5‐year cumulative incidence functions as age at diagnosis increases and the green lines represent cumulative incidence functions as time progresses when age at diagnosis was fixed at 30 and 60 years old. CIF represents the cumulative incidence function.

References

    1. Torre, L. A. , Bray F., Siegel R. L., Ferlay J., Lortet‐Tieulent J., and Jemal A.. 2015. Global cancer statistics, 2012. CA Cancer J. Clin. 65:87–108. - PubMed
    1. Siegel, R. L. , Miller K. D., and Jemal A.. 2015. Cancer statistics, 2015. CA Cancer J. Clin. 65:5–29. - PubMed
    1. Zheng, R. , Zeng H., Zhang S., Chen T., and Chen W.. 2016. National estimates of cancer prevalence in China, 2011. Cancer Lett. 370:33–38. - PubMed
    1. Hari, D. M. , Leung A. M., Lee J. H., Sim M. S., Vuong B., Chiu C. G., et al. 2013. AJCC cancer staging manual 7th edition criteria for colon cancer: do the complex modifications improve prognostic assessment? J. Am. Coll. Surg. 217:181–190. - PMC - PubMed
    1. Kim, M. J. , Jeong S. Y., Choi S. J., Ryoo S. B., J. W. Park , Park K. J., et al. 2015. Survival paradox between stage IIB/C (T4N0) and stage IIIA (T1‐2N1) colon cancer. Ann. Surg. Oncol. 22:505–512. - PubMed