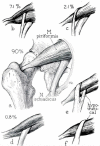
Anatomical and MR correlative study of the proximal sciatic nerve vasculature
- PMID: 28707535
- PMCID: PMC5858792
- DOI: 10.1259/bjr.20170031
Anatomical and MR correlative study of the proximal sciatic nerve vasculature
Abstract
Objective: The aim of our study is to demonstrate that increased T2 signal on MRI could be due to intraneural vessels in asymptomatic individuals, and may therefore be a normal finding.
Methods: An initial anatomic cadaveric study was undertaken to gain a better understanding of the vascular supply of the proximal sciatic nerve. Secondly, a retrospective study of MR imaging of patients without sciatic symptoms was performed to assess the prevalence of intraneural vessels, defined as hyperintensity on at least three consecutive slices on both T2 and gadolinium enhanced T1 weighted imaging, visible on routine MSK pelvic imaging.
Results: The anatomical study demonstrated a relatively abundant blood supply in the peri-ischiatic region. In the MR study, 20/76 (26%) patients showed visible intraneural vessels. More than one intraneural vessel was depicted in two of the sciatic nerves. Direct branching between the extrinsic and intrinsic systems was seen in only five cases.
Conclusion: Normal intraneural vessels can frequently be seen within the sciatic nerve on routine musculoskeletal pelvic imaging. Advances in knowledge: T2 hyperintensity in the proximal sciatic nerve can be due to intraneural vessels and should not necessarily be reported as abnormal.
Figures


Similar articles
-
Peroneal and tibial intraneural ganglia: correlation between intraepineurial compartments observed on magnetic resonance images and the potential importance of these compartments.Neurosurg Focus. 2007 Jun 15;22(6):E17. Neurosurg Focus. 2007. PMID: 17613208
-
MR imaging of venous malformations: sciatic nerve infiltration patterns and involved muscle groups.Sci Rep. 2020 Sep 3;10(1):14618. doi: 10.1038/s41598-020-71595-6. Sci Rep. 2020. PMID: 32884092 Free PMC article.
-
Detection and prevalence of variant sciatic nerve anatomy in relation to the piriformis muscle on MRI.Skeletal Radiol. 2017 Jun;46(6):751-757. doi: 10.1007/s00256-017-2597-6. Epub 2017 Mar 10. Skeletal Radiol. 2017. PMID: 28280851
-
Glomangiomatosis of the sciatic nerve: a case report and review of the literature.Skeletal Radiol. 2017 Jun;46(6):807-815. doi: 10.1007/s00256-017-2594-9. Epub 2017 Mar 17. Skeletal Radiol. 2017. PMID: 28303299 Review.
-
Sciatic foramen anatomy and common pathologies: a pictorial review.Abdom Radiol (NY). 2022 Jan;47(1):378-398. doi: 10.1007/s00261-021-03265-8. Epub 2021 Oct 18. Abdom Radiol (NY). 2022. PMID: 34664097 Review.
Cited by
-
Prevalence of fascicular hyperintensities in peripheral nerves of healthy individuals with regard to cerebral white matter lesions.Eur Radiol. 2019 Jul;29(7):3480-3487. doi: 10.1007/s00330-019-06145-4. Epub 2019 Mar 22. Eur Radiol. 2019. PMID: 30903330
-
Assessment in location of sciatic nerve between the ischial tuberosity and the greater trochanter of the femur: A cadaveric study.Heliyon. 2023 Dec 16;10(1):e23751. doi: 10.1016/j.heliyon.2023.e23751. eCollection 2024 Jan 15. Heliyon. 2023. PMID: 38192877 Free PMC article.
-
Techniques for Imaging Vascular Supply of Peripheral Nerves.J Brachial Plex Peripher Nerve Inj. 2021 Jul 23;16(1):e24-e30. doi: 10.1055/s-0041-1731280. eCollection 2021 Jan. J Brachial Plex Peripher Nerve Inj. 2021. PMID: 34316297 Free PMC article. Review.
References
-
- Konstantinou K, Dunn KM. Sciatica: review of epidemiological studies and prevalence estimates. Spine 2008; 33: 2464–72. doi: https://doi.org/10.1097/BRS.0b013e318183a4a2 - DOI - PubMed
-
- Ergun T, Lakadamyali H. CT and MRI in the evaluation of extraspinal sciatica. Br J Radiol 2010; 83: 791–803. doi: https://doi.org/10.1259/bjr/76002141 - DOI - PMC - PubMed
-
- Filler AG, Haynes J, Jordan SE, Prager J, Villablanca JP, Farahani K, et al. Sciatica of nondisc origin and piriformis syndrome: diagnosis by magnetic resonance neurography and interventional magnetic resonance imaging with outcome study of resulting treatment. J Neurosurg Spine 2005; 2: 99-115–115. doi: https://doi.org/10.3171/spi.2005.2.2.0099 - DOI - PubMed
-
- Chhabra A, Chalian M, Soldatos T, Andreisek G, Faridian-Aragh N, Williams E, et al. 3-T high-resolution MR neurography of sciatic neuropathy. AJR Am J Roentgenol 2012; 198: W357–W364. doi: https://doi.org/10.2214/AJR.11.6981 - DOI - PubMed
-
- Soldatos T, Andreisek G, Thawait GK, Guggenberger R, Williams EH, Carrino JA, et al. High-resolution 3-T MR neurography of the lumbosacral plexus. Radiographics 2013; 33: 967–87. doi: https://doi.org/10.1148/rg.334115761 - DOI - PubMed
MeSH terms
LinkOut - more resources
Full Text Sources
Other Literature Sources
Medical

