. 2017 Dec;285(3):809-819.
doi: 10.1148/radiol.2017161497. Epub 2017 Jul 13.

Biofunctionalized Hybrid Magnetic Gold Nanoparticles as Catalysts for Photothermal Ablation of Colorectal Liver Metastases

Affiliations

Biofunctionalized Hybrid Magnetic Gold Nanoparticles as Catalysts for Photothermal Ablation of Colorectal Liver Metastases

Sarah B White et al. Radiology. 2017 Dec.

Abstract

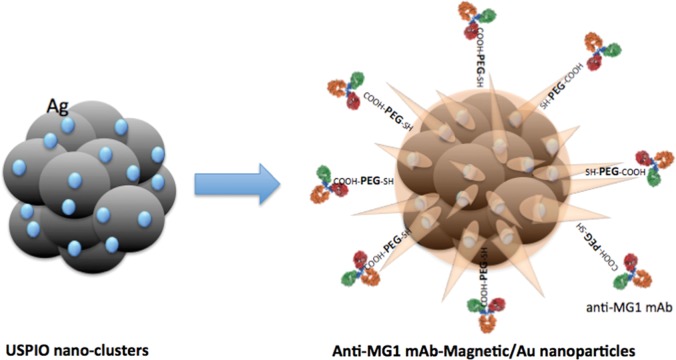
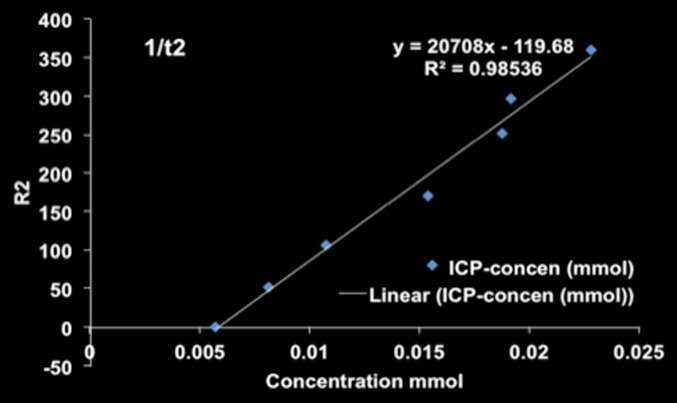
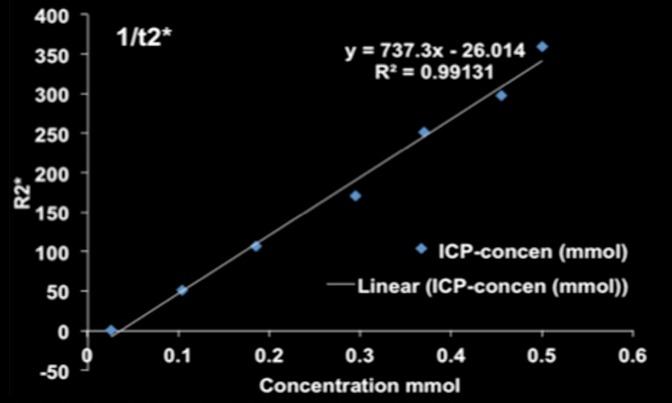
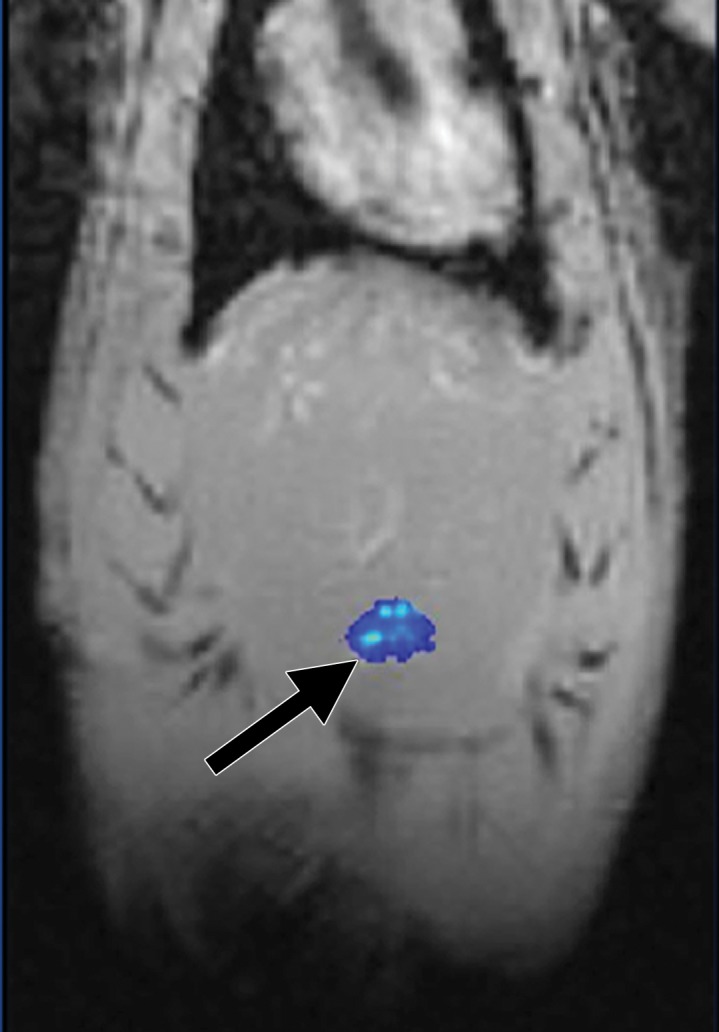
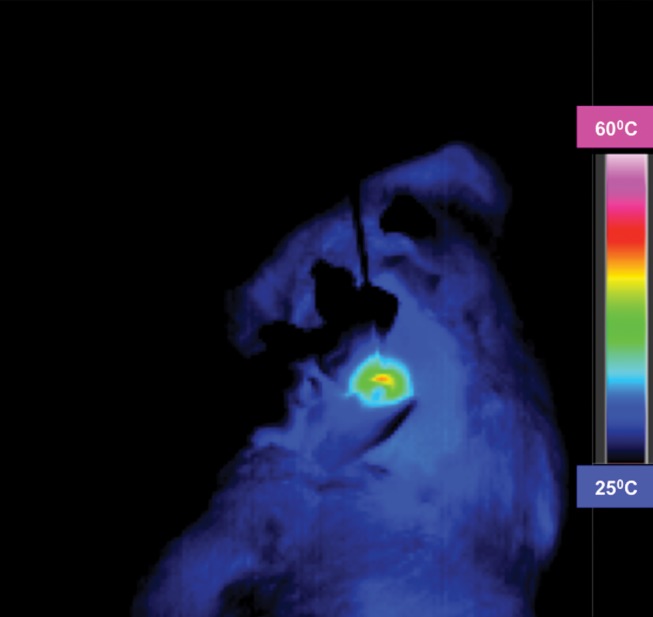
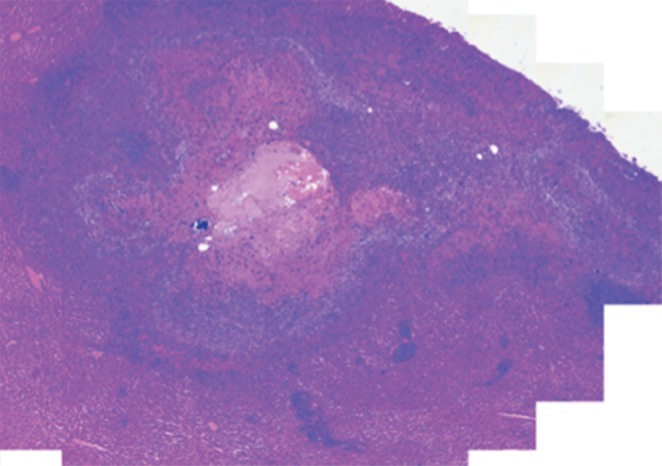
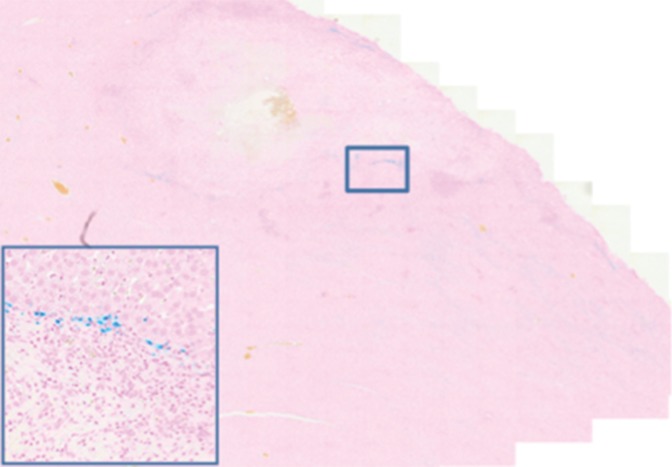
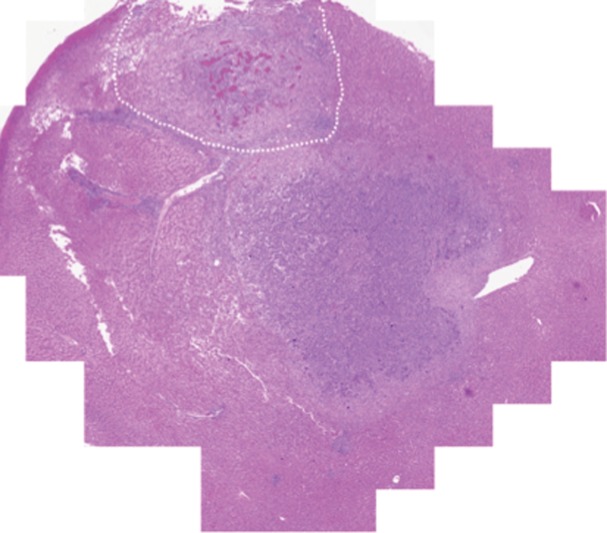
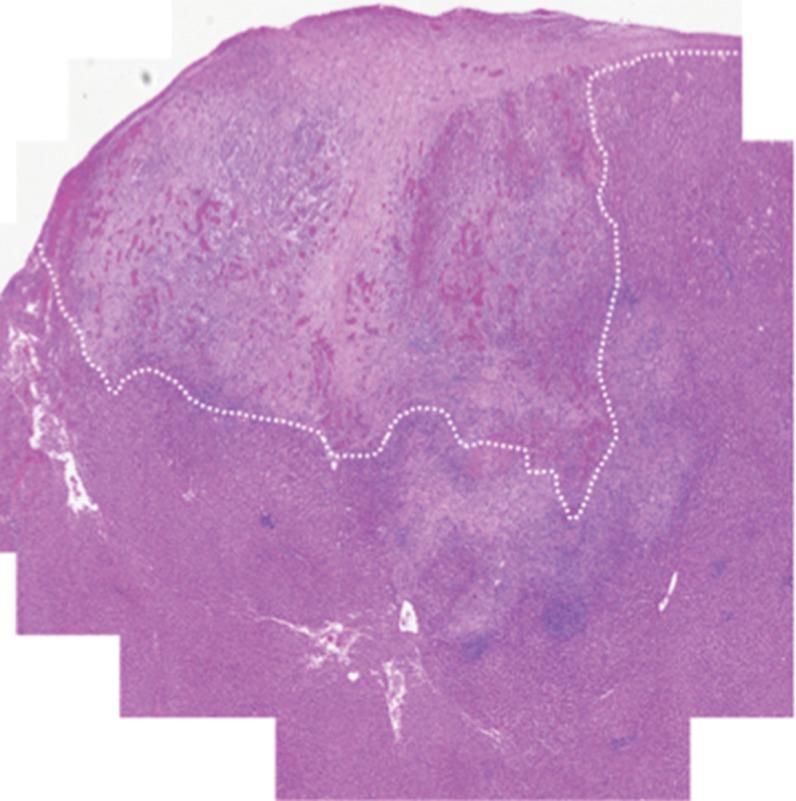
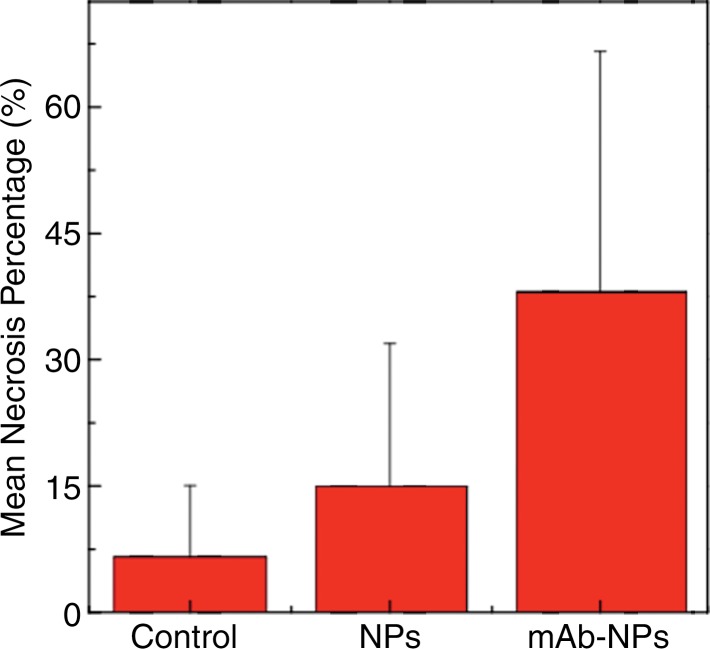
Purpose To demonstrate that anti-MG1 conjugated hybrid magnetic gold nanoparticles (HNPs) act as a catalyst during photothermal ablation (PTA) of colorectal liver metastases, and thus increase ablation zones. Materials and Methods All experiments were performed with approval of the institutional animal care and use committee. Therapeutic and diagnostic multifunctional HNPs conjugated with anti-MG1 monoclonal antibodies were synthesized, and the coupling efficiency was determined. Livers of 19 Wistar rats were implanted with 5 × 10⁶ rat colorectal liver metastasis cell line cells. The rats were divided into three groups according to injection: anti-MG1-coupled HNPs (n = 6), HNPs only (n = 6), and cells only (control group, n = 7). Voxel-wise R2 and R2* magnetic resonance (MR) imaging measurements were obtained before, immediately after, and 24 hours after injection. PTA was then performed with a fiber-coupled near-infrared (808 nm) diode laser with laser power of 0.56 W/cm2 for 3 minutes, while temperature changes were measured. Tumors were assessed for necrosis with hematoxylin-eosin staining. Organs were analyzed with inductively coupled plasma mass spectrometry to assess biodistribution. Therapeutic efficacy and tumor necrosis area were compared by using a one-way analysis of variance with post hoc analysis for statistically significant differences. Results The coupling efficiency was 22 μg/mg (55%). Significant differences were found between preinfusion and 24-hour postinfusion measurements of both T2 (repeated measures analysis of variance, P = .025) and T2* (P < .001). Significant differences also existed for T2* measurements between the anti-MG1 HNP and HNP-only groups (P = .034). Mean temperature ± standard deviation with PTA in the anti-MG1-coated HNP, HNP, and control groups was 50.2°C ± 7.8, 51°C ± 4.4, and 39.5°C ± 2.0, respectively. Inductively coupled plasma mass spectrometry revealed significant tumor targeting and splenic sequestration. Mean percentages of tumor necrosis in the anti-MG1-coated HNP, HNP, and control groups were 38% ± 29, 14% ± 17, and 7% ± 8, respectively (P = .043). Conclusion Targeted monoclonal antibody-conjugated HNPs can serve as a catalyst for photothermal ablation of colorectal liver metastases by increasing ablation zones. © RSNA, 2017.


Figures

Figure 1a:
Figure 1a:
Nanomaterial synthesis. Ultrasmall superparamagnetic iron oxide (USPIO) clusters were mixed with silver (Ag), which acts as a catalyst allowing gold (Au) to coat USPIO clusters. Polyethylene glycol (PEG) is added, which contains sulfyl (SH) and hydroxyl (COOH) groups at opposite ends of the molecules. The sulfonyl group binds to the gold shell, while the hydroxyl group binds to a commercially available coupling agent (1-ethyl-3-[3-dimethylaminopropyl] carbodiimide hydrochloride/N-hydroxysulfosuccinimide, or EDC-NHS). The anti-MG1 mAb can then be coupled to the nanoparticle. (a) Illustration shows synthesis of mAb conjugated HNP, (bd) transmission electron microscopic images show USPIO clusters measuring (b) 200 nm, (c) 200 nm, and (d) 100 nm. Graphs show size distribution measured with (e) Zetasizer and (f) absorption band of USPIO clusters and HNP.
Figure 1b:
Figure 1b:
Nanomaterial synthesis. Ultrasmall superparamagnetic iron oxide (USPIO) clusters were mixed with silver (Ag), which acts as a catalyst allowing gold (Au) to coat USPIO clusters. Polyethylene glycol (PEG) is added, which contains sulfyl (SH) and hydroxyl (COOH) groups at opposite ends of the molecules. The sulfonyl group binds to the gold shell, while the hydroxyl group binds to a commercially available coupling agent (1-ethyl-3-[3-dimethylaminopropyl] carbodiimide hydrochloride/N-hydroxysulfosuccinimide, or EDC-NHS). The anti-MG1 mAb can then be coupled to the nanoparticle. (a) Illustration shows synthesis of mAb conjugated HNP, (bd) transmission electron microscopic images show USPIO clusters measuring (b) 200 nm, (c) 200 nm, and (d) 100 nm. Graphs show size distribution measured with (e) Zetasizer and (f) absorption band of USPIO clusters and HNP.
Figure 1c:
Figure 1c:
Nanomaterial synthesis. Ultrasmall superparamagnetic iron oxide (USPIO) clusters were mixed with silver (Ag), which acts as a catalyst allowing gold (Au) to coat USPIO clusters. Polyethylene glycol (PEG) is added, which contains sulfyl (SH) and hydroxyl (COOH) groups at opposite ends of the molecules. The sulfonyl group binds to the gold shell, while the hydroxyl group binds to a commercially available coupling agent (1-ethyl-3-[3-dimethylaminopropyl] carbodiimide hydrochloride/N-hydroxysulfosuccinimide, or EDC-NHS). The anti-MG1 mAb can then be coupled to the nanoparticle. (a) Illustration shows synthesis of mAb conjugated HNP, (bd) transmission electron microscopic images show USPIO clusters measuring (b) 200 nm, (c) 200 nm, and (d) 100 nm. Graphs show size distribution measured with (e) Zetasizer and (f) absorption band of USPIO clusters and HNP.
Figure 1d:
Figure 1d:
Nanomaterial synthesis. Ultrasmall superparamagnetic iron oxide (USPIO) clusters were mixed with silver (Ag), which acts as a catalyst allowing gold (Au) to coat USPIO clusters. Polyethylene glycol (PEG) is added, which contains sulfyl (SH) and hydroxyl (COOH) groups at opposite ends of the molecules. The sulfonyl group binds to the gold shell, while the hydroxyl group binds to a commercially available coupling agent (1-ethyl-3-[3-dimethylaminopropyl] carbodiimide hydrochloride/N-hydroxysulfosuccinimide, or EDC-NHS). The anti-MG1 mAb can then be coupled to the nanoparticle. (a) Illustration shows synthesis of mAb conjugated HNP, (bd) transmission electron microscopic images show USPIO clusters measuring (b) 200 nm, (c) 200 nm, and (d) 100 nm. Graphs show size distribution measured with (e) Zetasizer and (f) absorption band of USPIO clusters and HNP.
Figure 1e:
Figure 1e:
Nanomaterial synthesis. Ultrasmall superparamagnetic iron oxide (USPIO) clusters were mixed with silver (Ag), which acts as a catalyst allowing gold (Au) to coat USPIO clusters. Polyethylene glycol (PEG) is added, which contains sulfyl (SH) and hydroxyl (COOH) groups at opposite ends of the molecules. The sulfonyl group binds to the gold shell, while the hydroxyl group binds to a commercially available coupling agent (1-ethyl-3-[3-dimethylaminopropyl] carbodiimide hydrochloride/N-hydroxysulfosuccinimide, or EDC-NHS). The anti-MG1 mAb can then be coupled to the nanoparticle. (a) Illustration shows synthesis of mAb conjugated HNP, (bd) transmission electron microscopic images show USPIO clusters measuring (b) 200 nm, (c) 200 nm, and (d) 100 nm. Graphs show size distribution measured with (e) Zetasizer and (f) absorption band of USPIO clusters and HNP.
Figure 1f:
Figure 1f:
Nanomaterial synthesis. Ultrasmall superparamagnetic iron oxide (USPIO) clusters were mixed with silver (Ag), which acts as a catalyst allowing gold (Au) to coat USPIO clusters. Polyethylene glycol (PEG) is added, which contains sulfyl (SH) and hydroxyl (COOH) groups at opposite ends of the molecules. The sulfonyl group binds to the gold shell, while the hydroxyl group binds to a commercially available coupling agent (1-ethyl-3-[3-dimethylaminopropyl] carbodiimide hydrochloride/N-hydroxysulfosuccinimide, or EDC-NHS). The anti-MG1 mAb can then be coupled to the nanoparticle. (a) Illustration shows synthesis of mAb conjugated HNP, (bd) transmission electron microscopic images show USPIO clusters measuring (b) 200 nm, (c) 200 nm, and (d) 100 nm. Graphs show size distribution measured with (e) Zetasizer and (f) absorption band of USPIO clusters and HNP.
Figure 2a:
Figure 2a:
In vitro studies. (a) Immunofluorescence image shows CC-531 cells that were incubated with anti-MG1 mAb–conjugated HNP for 24 hours and then fixed. Immunofluorescence was performed. Image on left is CC-531 cells stained with 4ʹ,6-diamidine-2-phenylindole. Middle image shows fluorescent anti-MG1 mAb-conjugated HNP. Image on the right is coregistered and shows selective binding of anti-MG1 mAb-conjugated HNP to CC-531 (10 μm). (b) Transmission electron microscopic image shows CC-531 cells that were incubated with HNP for 24 hours and then fixed (10 μm). Images show (b) cell beginning to undergo endocytosis in cluster of anti-MG1 mAb-conjugated HNPs (arrow, 500 nm) and (c) endocytoma-containing anti-MG1 mAb-conjugated HNP (arrow, 1 μm).
Figure 2b:
Figure 2b:
In vitro studies. (a) Immunofluorescence image shows CC-531 cells that were incubated with anti-MG1 mAb–conjugated HNP for 24 hours and then fixed. Immunofluorescence was performed. Image on left is CC-531 cells stained with 4ʹ,6-diamidine-2-phenylindole. Middle image shows fluorescent anti-MG1 mAb-conjugated HNP. Image on the right is coregistered and shows selective binding of anti-MG1 mAb-conjugated HNP to CC-531 (10 μm). (b) Transmission electron microscopic image shows CC-531 cells that were incubated with HNP for 24 hours and then fixed (10 μm). Images show (b) cell beginning to undergo endocytosis in cluster of anti-MG1 mAb-conjugated HNPs (arrow, 500 nm) and (c) endocytoma-containing anti-MG1 mAb-conjugated HNP (arrow, 1 μm).
Figure 2c:
Figure 2c:
In vitro studies. (a) Immunofluorescence image shows CC-531 cells that were incubated with anti-MG1 mAb–conjugated HNP for 24 hours and then fixed. Immunofluorescence was performed. Image on left is CC-531 cells stained with 4ʹ,6-diamidine-2-phenylindole. Middle image shows fluorescent anti-MG1 mAb-conjugated HNP. Image on the right is coregistered and shows selective binding of anti-MG1 mAb-conjugated HNP to CC-531 (10 μm). (b) Transmission electron microscopic image shows CC-531 cells that were incubated with HNP for 24 hours and then fixed (10 μm). Images show (b) cell beginning to undergo endocytosis in cluster of anti-MG1 mAb-conjugated HNPs (arrow, 500 nm) and (c) endocytoma-containing anti-MG1 mAb-conjugated HNP (arrow, 1 μm).
Figure 3a:
Figure 3a:
R2 and R2* imaging and quantification. Wistar rats inoculated with CC-531 cells and tumors (arrow, c, d) were allowed to grow for 7–10 days. R2 and R2* images of rats were obtained with a 7.0-T MR imager at baseline and immediately after and at 24 hours after infusion. Voxel-wise R2 and R2* measurements were performed, and color map overlays were created. Plots show measurements of (a) R2 and (b) R2* and their correlation with HNP concentrations. (c) Coronal R2* baseline MR image (unit, one per second). (d) Coronal MR image shows R2* 24 hours after infusion of HNP (unit, one per second). Signal intensity loss is noted both in liver and in tumor between the time points. (e) Image of rat taken with a thermal camera during PTA while temperature measurements were being taken. ICP concen = inductively coupled plasma concentration.
Figure 3b:
Figure 3b:
R2 and R2* imaging and quantification. Wistar rats inoculated with CC-531 cells and tumors (arrow, c, d) were allowed to grow for 7–10 days. R2 and R2* images of rats were obtained with a 7.0-T MR imager at baseline and immediately after and at 24 hours after infusion. Voxel-wise R2 and R2* measurements were performed, and color map overlays were created. Plots show measurements of (a) R2 and (b) R2* and their correlation with HNP concentrations. (c) Coronal R2* baseline MR image (unit, one per second). (d) Coronal MR image shows R2* 24 hours after infusion of HNP (unit, one per second). Signal intensity loss is noted both in liver and in tumor between the time points. (e) Image of rat taken with a thermal camera during PTA while temperature measurements were being taken. ICP concen = inductively coupled plasma concentration.
Figure 3c:
Figure 3c:
R2 and R2* imaging and quantification. Wistar rats inoculated with CC-531 cells and tumors (arrow, c, d) were allowed to grow for 7–10 days. R2 and R2* images of rats were obtained with a 7.0-T MR imager at baseline and immediately after and at 24 hours after infusion. Voxel-wise R2 and R2* measurements were performed, and color map overlays were created. Plots show measurements of (a) R2 and (b) R2* and their correlation with HNP concentrations. (c) Coronal R2* baseline MR image (unit, one per second). (d) Coronal MR image shows R2* 24 hours after infusion of HNP (unit, one per second). Signal intensity loss is noted both in liver and in tumor between the time points. (e) Image of rat taken with a thermal camera during PTA while temperature measurements were being taken. ICP concen = inductively coupled plasma concentration.
Figure 3d:
Figure 3d:
R2 and R2* imaging and quantification. Wistar rats inoculated with CC-531 cells and tumors (arrow, c, d) were allowed to grow for 7–10 days. R2 and R2* images of rats were obtained with a 7.0-T MR imager at baseline and immediately after and at 24 hours after infusion. Voxel-wise R2 and R2* measurements were performed, and color map overlays were created. Plots show measurements of (a) R2 and (b) R2* and their correlation with HNP concentrations. (c) Coronal R2* baseline MR image (unit, one per second). (d) Coronal MR image shows R2* 24 hours after infusion of HNP (unit, one per second). Signal intensity loss is noted both in liver and in tumor between the time points. (e) Image of rat taken with a thermal camera during PTA while temperature measurements were being taken. ICP concen = inductively coupled plasma concentration.
Figure 3e:
Figure 3e:
R2 and R2* imaging and quantification. Wistar rats inoculated with CC-531 cells and tumors (arrow, c, d) were allowed to grow for 7–10 days. R2 and R2* images of rats were obtained with a 7.0-T MR imager at baseline and immediately after and at 24 hours after infusion. Voxel-wise R2 and R2* measurements were performed, and color map overlays were created. Plots show measurements of (a) R2 and (b) R2* and their correlation with HNP concentrations. (c) Coronal R2* baseline MR image (unit, one per second). (d) Coronal MR image shows R2* 24 hours after infusion of HNP (unit, one per second). Signal intensity loss is noted both in liver and in tumor between the time points. (e) Image of rat taken with a thermal camera during PTA while temperature measurements were being taken. ICP concen = inductively coupled plasma concentration.
Figure 4a:
Figure 4a:
Histologic evaluation. (a) Representative photomicrograph shows hematoxylin-eosin–stained section demonstrating large colorectal liver metastasis with densely packed tumor cells (magnification, ×20). (b) Prussian blue staining (iron stains blue) shows deposition of anti-MG1–conjugated HNP around tumor. Image in inset shows Prussian blue staining at higher magnification (×20) in tumor. Hematoxylin-eosin slides were analyzed and total tumor area (densely packed areas of liver) and area of necrosis (dashed lines) were determined for control group, (c) HNP group, and (d) mAb-conjugated HNP group (magnification, ×20). (e) Hematoxylin-eosin slides were evaluated to determine percentage of necrosis, and control, HNP (NP), and mAb-conjugated anti-MG1 HNPs were compared (P = .043).
Figure 4b:
Figure 4b:
Histologic evaluation. (a) Representative photomicrograph shows hematoxylin-eosin–stained section demonstrating large colorectal liver metastasis with densely packed tumor cells (magnification, ×20). (b) Prussian blue staining (iron stains blue) shows deposition of anti-MG1–conjugated HNP around tumor. Image in inset shows Prussian blue staining at higher magnification (×20) in tumor. Hematoxylin-eosin slides were analyzed and total tumor area (densely packed areas of liver) and area of necrosis (dashed lines) were determined for control group, (c) HNP group, and (d) mAb-conjugated HNP group (magnification, ×20). (e) Hematoxylin-eosin slides were evaluated to determine percentage of necrosis, and control, HNP (NP), and mAb-conjugated anti-MG1 HNPs were compared (P = .043).
Figure 4c:
Figure 4c:
Histologic evaluation. (a) Representative photomicrograph shows hematoxylin-eosin–stained section demonstrating large colorectal liver metastasis with densely packed tumor cells (magnification, ×20). (b) Prussian blue staining (iron stains blue) shows deposition of anti-MG1–conjugated HNP around tumor. Image in inset shows Prussian blue staining at higher magnification (×20) in tumor. Hematoxylin-eosin slides were analyzed and total tumor area (densely packed areas of liver) and area of necrosis (dashed lines) were determined for control group, (c) HNP group, and (d) mAb-conjugated HNP group (magnification, ×20). (e) Hematoxylin-eosin slides were evaluated to determine percentage of necrosis, and control, HNP (NP), and mAb-conjugated anti-MG1 HNPs were compared (P = .043).
Figure 4d:
Figure 4d:
Histologic evaluation. (a) Representative photomicrograph shows hematoxylin-eosin–stained section demonstrating large colorectal liver metastasis with densely packed tumor cells (magnification, ×20). (b) Prussian blue staining (iron stains blue) shows deposition of anti-MG1–conjugated HNP around tumor. Image in inset shows Prussian blue staining at higher magnification (×20) in tumor. Hematoxylin-eosin slides were analyzed and total tumor area (densely packed areas of liver) and area of necrosis (dashed lines) were determined for control group, (c) HNP group, and (d) mAb-conjugated HNP group (magnification, ×20). (e) Hematoxylin-eosin slides were evaluated to determine percentage of necrosis, and control, HNP (NP), and mAb-conjugated anti-MG1 HNPs were compared (P = .043).
Figure 4e:
Figure 4e:
Histologic evaluation. (a) Representative photomicrograph shows hematoxylin-eosin–stained section demonstrating large colorectal liver metastasis with densely packed tumor cells (magnification, ×20). (b) Prussian blue staining (iron stains blue) shows deposition of anti-MG1–conjugated HNP around tumor. Image in inset shows Prussian blue staining at higher magnification (×20) in tumor. Hematoxylin-eosin slides were analyzed and total tumor area (densely packed areas of liver) and area of necrosis (dashed lines) were determined for control group, (c) HNP group, and (d) mAb-conjugated HNP group (magnification, ×20). (e) Hematoxylin-eosin slides were evaluated to determine percentage of necrosis, and control, HNP (NP), and mAb-conjugated anti-MG1 HNPs were compared (P = .043).
Figure 5:
Figure 5:
Graph shows biodistribution of HNP. Freshly harvested or snap frozen tissues were subjected to inductively coupled plasma mass spectrometry for gold (Au) and iron (Fe) analysis, and the amounts present in each tissue were expressed in micrograms per gram of tissue. L = tumor in the left lobe of liver, NP = nanoparticle, and R = tumor in the right lobe.

Comment in

Similar articles

Cited by

References

    1. American Cancer Society . Cancer facts & figures 2015. Atlanta, Ga: American Cancer Society, 2015.
    1. LeGolvan MP, Resnick M. Pathobiology of colorectal cancer hepatic metastases with an emphasis on prognostic factors. J Surg Oncol 2010;102(8):898–908. - PubMed
    1. Viganò L, Russolillo N, Ferrero A, Langella S, Sperti E, Capussotti L. Evolution of long-term outcome of liver resection for colorectal metastases: analysis of actual 5-year survival rates over two decades. Ann Surg Oncol 2012;19(6):2035–2044. - PubMed
    1. Brouquet A, Mortenson MM, Vauthey JN, et al. . Surgical strategies for synchronous colorectal liver metastases in 156 consecutive patients: classic, combined or reverse strategy? J Am Coll Surg 2010;210(6):934–941. - PubMed
    1. Gillams A, Goldberg N, Ahmed M, et al. . Thermal ablation of colorectal liver metastases: a position paper by an international panel of ablation experts, The Interventional Oncology Sans Frontières meeting 2013. Eur Radiol 2015;25(12):3438–3454. - PMC - PubMed

Publication types

LinkOut - more resources