. 2017 Dec;285(3):830-838.
doi: 10.1148/radiol.2017161772. Epub 2017 Jul 13.

In Vivo Assessment of Ovarian Tumor Response to Tyrosine Kinase Inhibitor Pazopanib by Using Hyperpolarized 13C-Pyruvate MR Spectroscopy and 18F-FDG PET/CT Imaging in a Mouse Model

Affiliations

In Vivo Assessment of Ovarian Tumor Response to Tyrosine Kinase Inhibitor Pazopanib by Using Hyperpolarized 13C-Pyruvate MR Spectroscopy and 18F-FDG PET/CT Imaging in a Mouse Model

Murali K Ravoori et al. Radiology. 2017 Dec.

Abstract

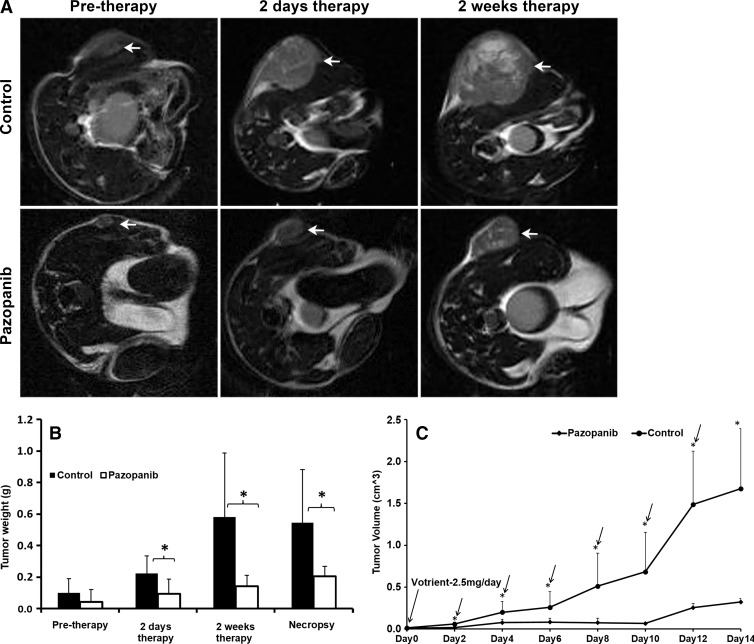
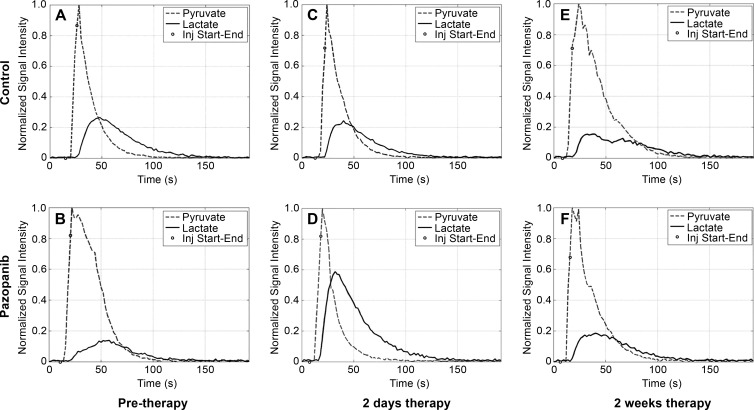
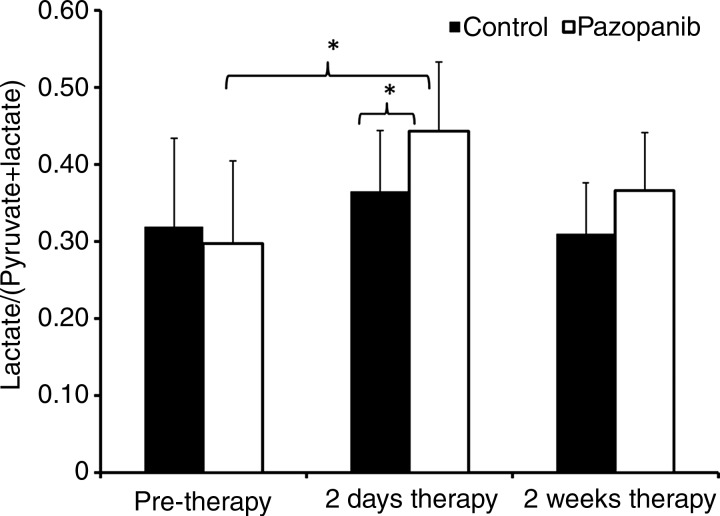
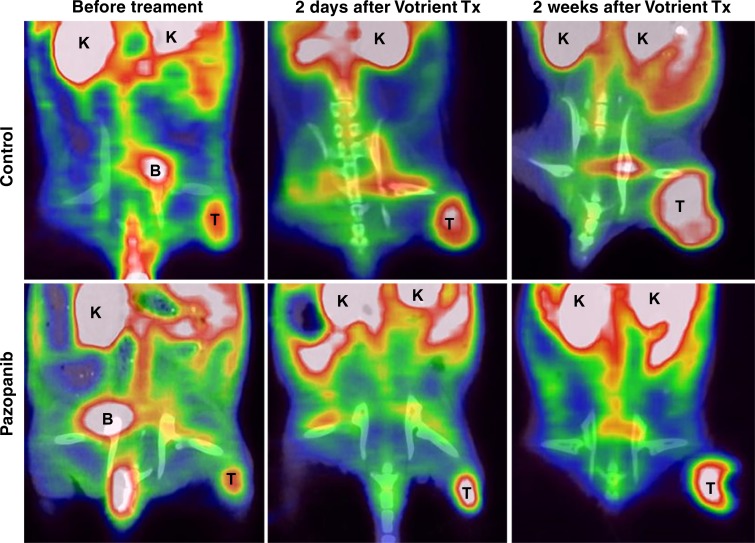
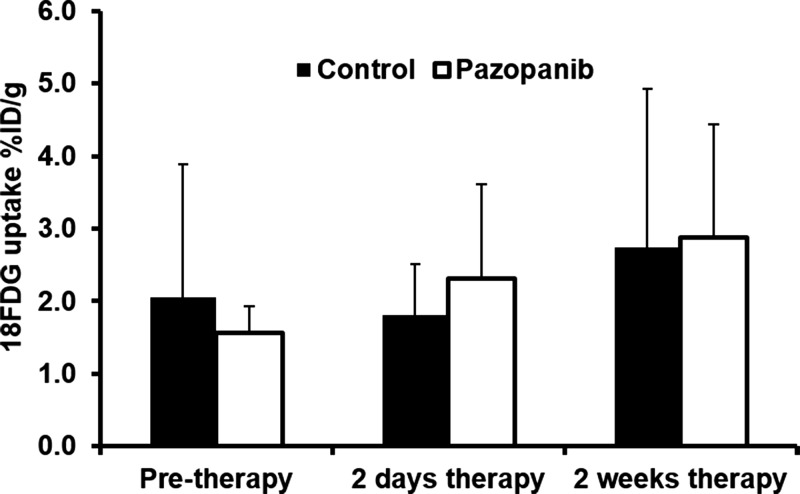
Purpose To assess in a mouse model whether early or late components of glucose metabolism, exemplified by fluorine 18 (18F) fluorodeoxyglucose (FDG) positron emission tomography (PET) and hyperpolarized carbon 13 (13C)-pyruvate magnetic resonance (MR) spectroscopy, can serve as indicators of response in ovarian cancer to multityrosine kinase inhibitor pazopanib. Materials and Methods In this Animal Care and Use Committee approved study, 17 days after the injection of 2 × 10⁶ human ovarian SKOV3 tumors cells into 14 female nude mice, treatment with vehicle or pazopanib (2.5 mg per mouse peroral every other day) was initiated. Longitudinal T2-weighted MR imaging, dynamic MR spectroscopy of hyperpolarized pyruvate, and 18F-FDG PET/computed tomographic (CT) imaging were performed before treatment, 2 days after treatment, and 2 weeks after treatment. Results Pazopanib inhibited ovarian tumor growth compared with control (0.054 g ± 0.041 vs 0.223 g ± 0.112, respectively; six mice were treated with pazopanib and seven were control mice; P < .05). Significantly higher pyruvate-to-lactate conversion (lactate/pyruvate + lactate ratio) was found 2 days after treatment with pazopanib than before treatment (0.46 ± 0.07 vs 0.31 ± 0.14, respectively; P < .05; six tumors after treatment, seven tumors before treatment). This was not observed with the control group or with 18F-FDG PET/CT imaging. Conclusion The findings suggest that hyperpolarized 13C-pyruvate MR spectroscopy may serve as an early indicator of response to tyrosine kinase (angiogenesis) inhibitors such as pazopanib in ovarian cancer even when 18F-FDG PET/CT does not indicate a response. © RSNA, 2017 Online supplemental material is available for this article.


Figures

Figure 1:
Figure 1:
In vivo MR imaging showed that pazopanib reduced the growth of established SKOV3 tumors. A, Representative axial T2-weighted 1H anatomic MR images of mice before therapy (pre-therapy) or after 2 days and 2 weeks of therapy with vehicle (control mice) or pazopanib. B, Box plot shows tumor weight derived from serial MR images of the mice described in A before therapy or after 2 days and 2 weeks of therapy, or at necropsy (at 2 weeks after therapy; * P < .05). C, Graph of longitudinal caliper measurements. Pazopanib inhibited tumor growth compared with control mice (* P < .05). By comparing growth versus the day before in tumors treated with pazopanib, tumors grew on day 4 versus day 2, stabilized, and then grew on day 12 versus day 10 and day 14 versus day 12 (arrow represents P < .05). The error bars are standard deviation.
Figure 2:
Figure 2:
Graphs of dynamic MR imaging curves of tumor lactate and pyruvate peak intensities. Dynamic signal curves of MR spectroscopic imaging of hyperpolarized 13C-pyruvate and its metabolite 13C-lactate before (pre-therapy; A, B) or 2 days (C, D) and 2 weeks (E, F ) after control (A, C, E) or pazopanib (B, D, E) treatment. The mean signal for lactate and pyruvate was normalized to peak signal for each injection (inj ). Total hyperpolarized 13C signal was estimated by summing signal from hyperpolarized 13C-lactate and hyperpolarized 13C-pyruvate. s = seconds.
Figure 3:
Figure 3:
Box plot shows ratio of lactate-to–pyruvate-and-lactate signal intensity. 13C-pyruvate–to–13C-lactate conversion before or 2 days and 2 weeks after control or pazopanib treatment. * P < .05.
Figure 4a:
Figure 4a:
18F-FDG PET/CT imaging did not indicate response to pazopanib treatment. (a) Representative coronal 18F-FDG PET/CT images of mice before or 2 days and 2 weeks after pazopanib or control treatment. B = bladder; K = kidney; T = tumor. (b) Box plot shows 18F-FDG uptake in percent injected dose per gram (%ID/g) before or 2 days and 2 weeks after pazopanib treatment or for control mice.
Figure 4b:
Figure 4b:
18F-FDG PET/CT imaging did not indicate response to pazopanib treatment. (a) Representative coronal 18F-FDG PET/CT images of mice before or 2 days and 2 weeks after pazopanib or control treatment. B = bladder; K = kidney; T = tumor. (b) Box plot shows 18F-FDG uptake in percent injected dose per gram (%ID/g) before or 2 days and 2 weeks after pazopanib treatment or for control mice.

Similar articles

Cited by

References

    1. American Cancer Society . Cancer facts & figures 2015. Atlanta, Ga: American Cancer Society, 2015.
    1. Munk Jensen M, Erichsen KD, Björkling F, et al. . Imaging of treatment response to the combination of carboplatin and paclitaxel in human ovarian cancer xenograft tumors in mice using FDG and FLT PET. PLoS One 2013;8(12):e85126. - PMC - PubMed
    1. Kim TJ, Ravoori M, Landen CN, et al. . Antitumor and antivascular effects of AVE8062 in ovarian carcinoma. Cancer Res 2007;67(19):9337–9345. - PubMed
    1. Berg JM, Tymoczko JL, Stryer L. Biochemistry. 7th ed. New York, NY: Freeman, 2012.
    1. Ardenkjaer-Larsen JH, Fridlund B, Gram A, et al. . Increase in signal-to-noise ratio of > 10,000 times in liquid-state NMR. Proc Natl Acad Sci U S A 2003;100(18):10158–10163. - PMC - PubMed

Publication types

MeSH terms

LinkOut - more resources