

Predictors of Daily Mobility of Adults in Peri-Urban South India
- PMID: 28708095
- PMCID: PMC5551221
- DOI: 10.3390/ijerph14070783
Predictors of Daily Mobility of Adults in Peri-Urban South India
Abstract
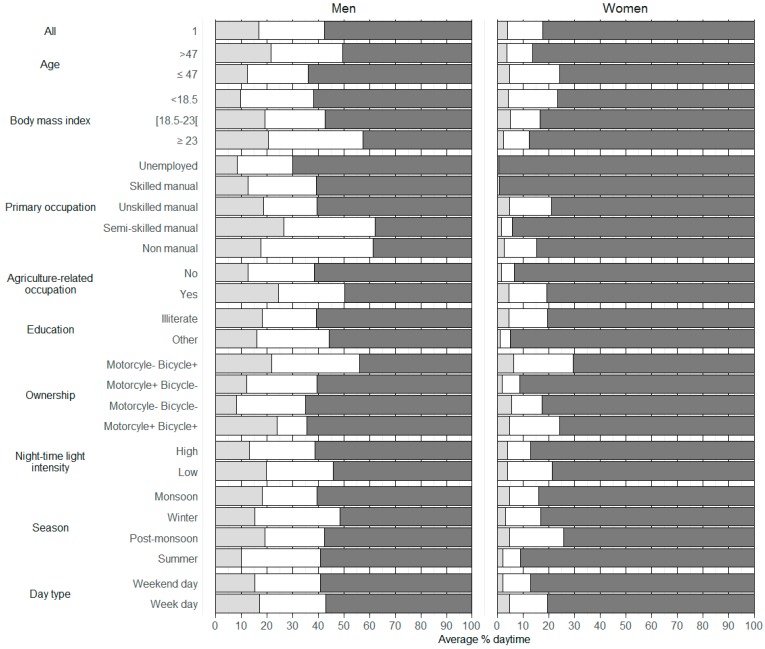
Daily mobility, an important aspect of environmental exposures and health behavior, has mainly been investigated in high-income countries. We aimed to identify the main dimensions of mobility and investigate their individual, contextual, and external predictors among men and women living in a peri-urban area of South India. We used 192 global positioning system (GPS)-recorded mobility tracks from 47 participants (24 women, 23 men) from the Cardiovascular Health effects of Air pollution in Telangana, India (CHAI) project (mean: 4.1 days/person). The mean age was 44 (standard deviation: 14) years. Half of the population was illiterate and 55% was in unskilled manual employment, mostly agriculture-related. Sex was the largest determinant of mobility. During daytime, time spent at home averaged 13.4 (3.7) h for women and 9.4 (4.2) h for men. Women's activity spaces were smaller and more circular than men's. A principal component analysis identified three main mobility dimensions related to the size of the activity space, the mobility in/around the residence, and mobility inside the village, explaining 86% (women) and 61% (men) of the total variability in mobility. Age, socioeconomic status, and urbanicity were associated with all three dimensions. Our results have multiple potential applications for improved assessment of environmental exposures and their effects on health.
Keywords: India; gender; global positioning system (GPS); principal component analysis (PCA); spatial behavior; time-activity patterns.
Conflict of interest statement
The authors declare no conflict of interest. The founding sponsors had no role in the design of the study; in the collection, analyses, or interpretation of data; in the writing of the manuscript, and in the decision to publish the results.
Figures

References
-
- Nethery E., Mallach G., Rainham D., Goldberg M.S., Wheeler A.J. Using Global Positioning Systems (GPS) and temperature data to generate time-activity classifications for estimating personal exposure in air monitoring studies: An automated method. Environ. Health. 2014;13:33. doi: 10.1186/1476-069X-13-33. - DOI - PMC - PubMed
-
- Smith J.D., Mitsakou C., Kitwiroon N., Barratt B.M., Walton H.A., Taylor J.G., Anderson H.R., Kelly F.J., Beevers S.D. London hybrid exposure model: Improving human exposure estimates to NO2 and PM2.5 in an urban setting. Environ. Sci. Technol. 2016;50:11760–11768. doi: 10.1021/acs.est.6b01817. - DOI - PubMed
MeSH terms
Grants and funding
LinkOut - more resources
Full Text Sources
Other Literature Sources
