. 2017 Nov;24(11):1872-1885.
doi: 10.1038/cdd.2017.108. Epub 2017 Jul 14.

Differential requirements for Tousled-like kinases 1 and 2 in mammalian development

Affiliations

Differential requirements for Tousled-like kinases 1 and 2 in mammalian development

Sandra Segura-Bayona et al. Cell Death Differ. 2017 Nov.

Abstract

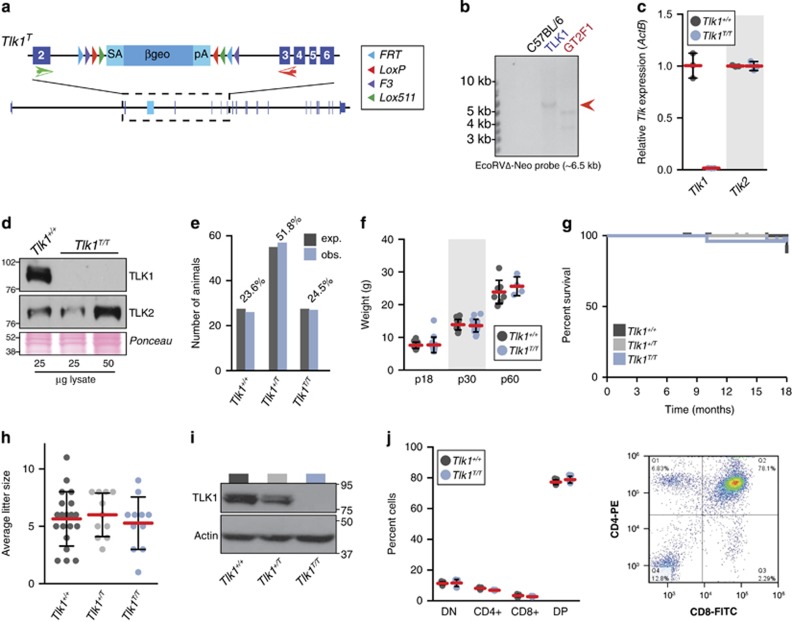
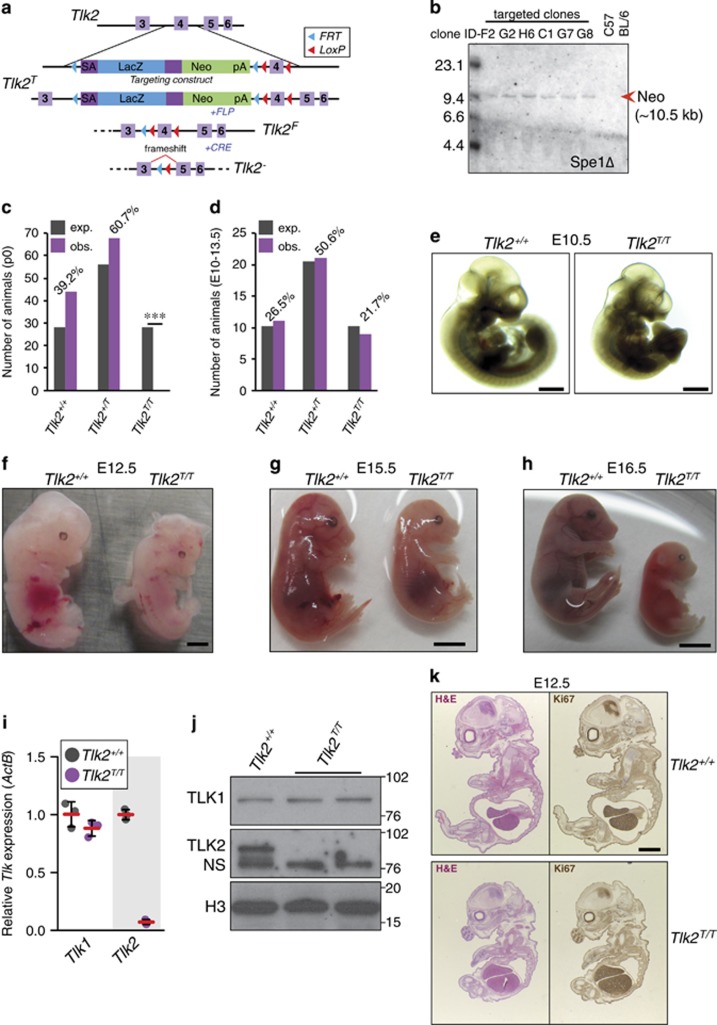
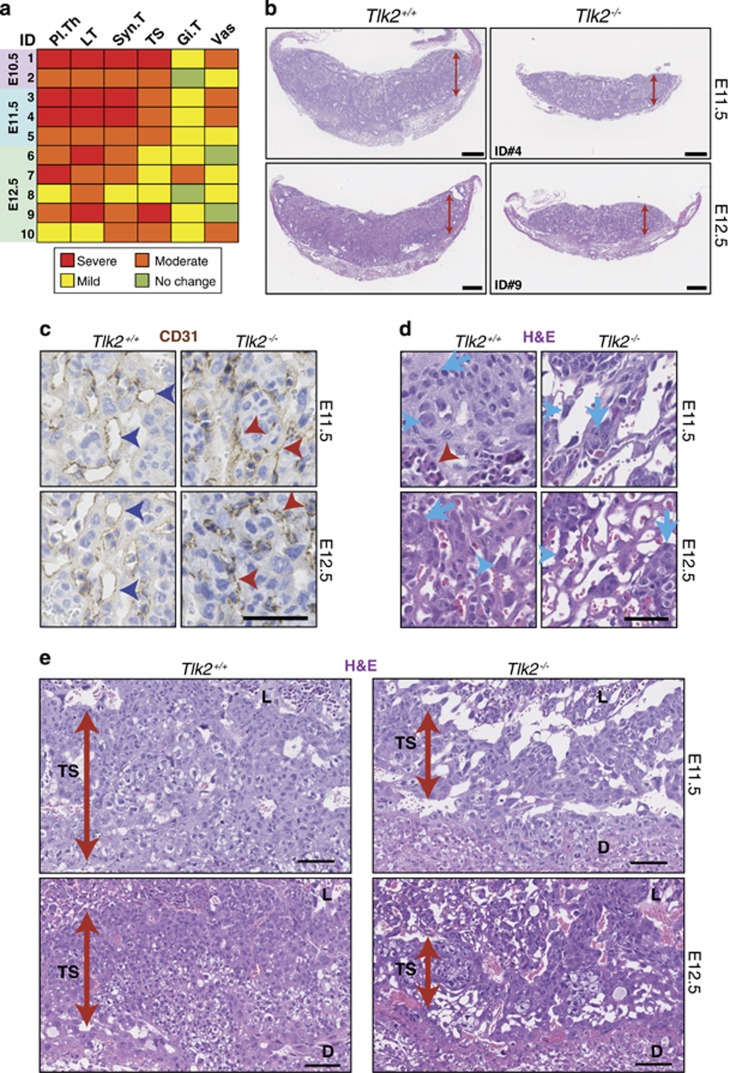
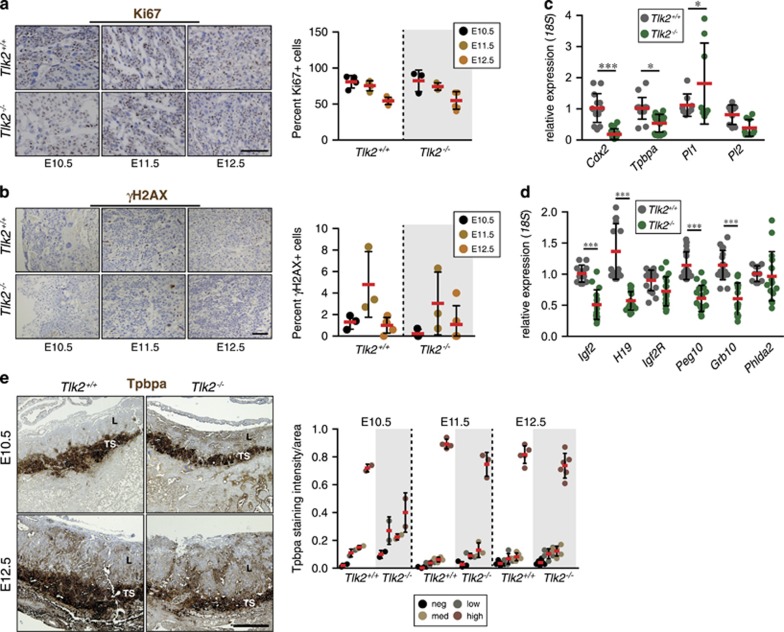
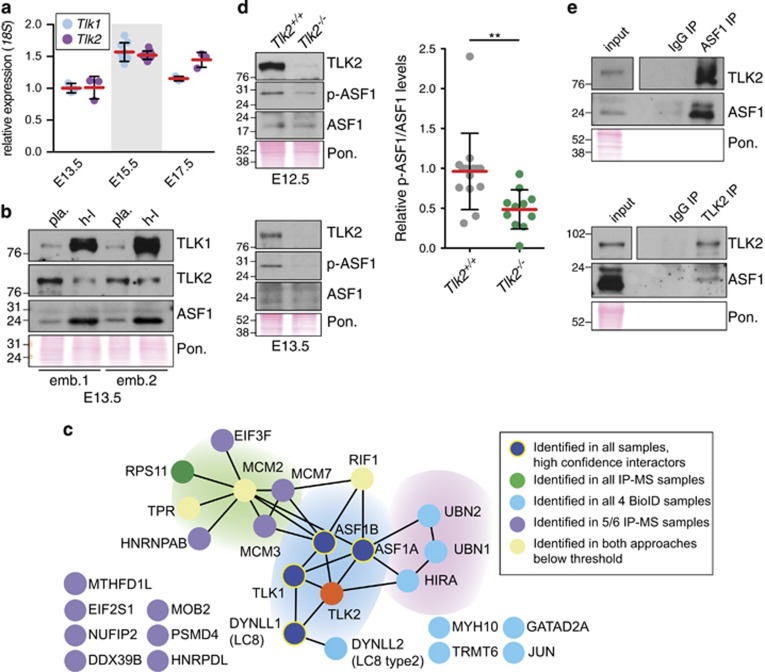
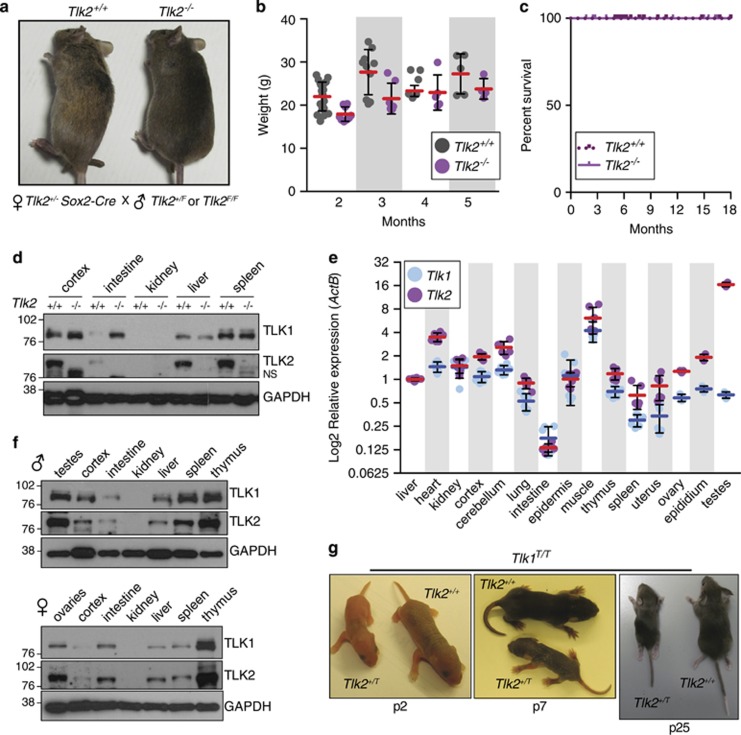
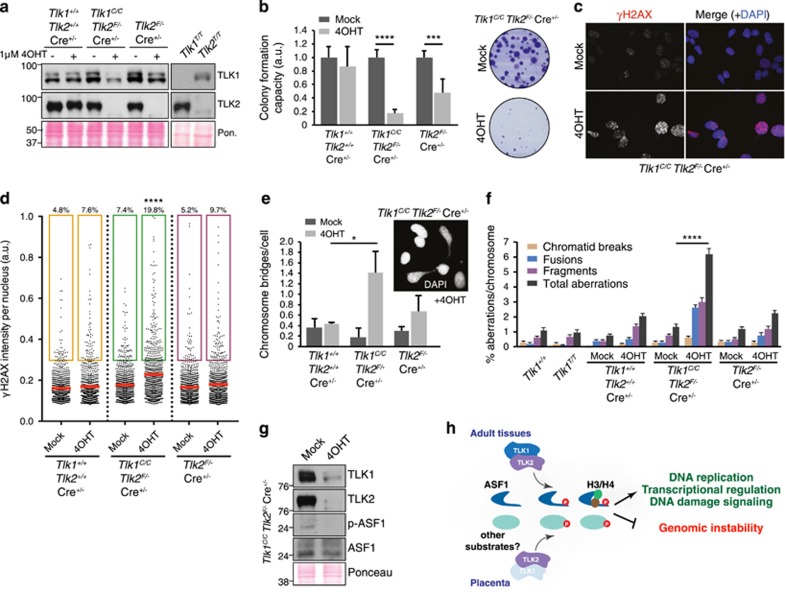
The regulation of chromatin structure is critical for a wide range of essential cellular processes. The Tousled-like kinases, TLK1 and TLK2, regulate ASF1, a histone H3/H4 chaperone, and likely other substrates, and their activity has been implicated in transcription, DNA replication, DNA repair, RNA interference, cell cycle progression, viral latency, chromosome segregation and mitosis. However, little is known about the functions of TLK activity in vivo or the relative functions of the highly similar TLK1 and TLK2 in any cell type. To begin to address this, we have generated Tlk1- and Tlk2-deficient mice. We found that while TLK1 was dispensable for murine viability, TLK2 loss led to late embryonic lethality because of placental failure. TLK2 was required for normal trophoblast differentiation and the phosphorylation of ASF1 was reduced in placentas lacking TLK2. Conditional bypass of the placental phenotype allowed the generation of apparently healthy Tlk2-deficient mice, while only the depletion of both TLK1 and TLK2 led to extensive genomic instability, indicating that both activities contribute to genome maintenance. Our data identifies a specific role for TLK2 in placental function during mammalian development and suggests that TLK1 and TLK2 have largely redundant roles in genome maintenance.


Conflict of interest statement

The authors declare no conflict of interest.

Figures

Figure 1
Figure 1
TLK1 is dispensable for murine development. (a) Schematic of the Tlk1 genetrap allele (Tlk1T). The position of the Flex-vector genetrap cassette in the Tlk1 locus and approximate positions of primers used for quantitative real-time PCR are shown. (b) The genetrap clone was screened for single-copy insertion using a probe for the neomycin cassette in a Southern blot of EcoRV-digested genomic DNA. A single band of the expected size was observed (red arrow). GTF2 is an unrelated line with a neomycin cassette (positive control) and C57BL6 is wild-type genomic DNA (negative control). (c) Quantitative real-time PCR analysis of Tlk1 and Tlk2 levels in MEF cultures derived from littermates of the indicated gentoype. The mean (red bar) and standard deviation (S.D.) of three replicates are plotted. (d) Western blotting of TLK1 and TLK2 protein levels in MEF cultures of the indicated genotype. Ponceau red-stained blot showed equal loading. (e) Tlk1T/T mice are born at the expected (exp.) Mendelian ratios. Number of pups of the indicated genotype observed (obs.) from 32 litters of Tlk1+/T mice (110 pups total) is indicated. Percentage observed is indicated above the bar graphs. (f) Normal weight and growth of Tlk1T/T mice. Weights of littermate animals at 18 and 30 days postpartum are plotted with the mean (red bars) and S.D. indicated (n=16 for Tlk1+/+ and 15 for Tlk1T/T, respectively). (g) Normal survival of Tlk1T/T mice. Kaplan–Meier plot of animal survival over 18 months (n=25, 41 and 26 for Tlk1+/+, Tlk1+/T and Tlk1T/T, respectively). (h) Normal litter sizes are observed in Tlk1T/T female mice of 2–5 months of age compared with wild type or heterozygous littermates (n=20, 11 and 11 for Tlk1+/+, Tlk1+/T and Tlk1T/T, respectively). The mean (red bars) and S.D. are plotted and statistical analysis using the Wilcoxon's rank-sum test indicated no significant differences (P=0.65;Tlk1+/+ versus Tlk1+/T, 0.75; Tlk1+/+ versus Tlk1T/T and 0.52; Tlk1+/T versus Tlk1T/T). (i) TLK1 protein levels in thymocytes of the indicated genotype are shown. Actin serves as a loading control. (j) Analysis of T-cell subsets in 2-month-old animals of the indicated genotype (n=3 per genotype, each in triplicate). The mean (red bars) and S.D. are shown and representative flow cytometry data showing CD4 and CD8 staining of CD3-positive T cells is shown in the right panel
Figure 2
Figure 2
TLK2 is an essential gene. (a) Schematic of the Tlk2 knockout-first allele (Tlk2T). The position of the genetrap cassette, the allelic configurations and their designations following FLP and CRE expression are shown. (b) Southern blot of SpeI-digested genomic DNA with a probe for neomycin to identify clones with single insertions. Six targeted clones and a negative control (C57BL/6) are shown and the expected size indicated. Additional Southern blots confirming correct targeting are shown in Supplementary Figure S1. (c) Tlk2 deficiency is embryonic lethal. The number of animals expected (exp.) from 27 Tlk2+/T breedings (112 pups total) assuming normal Mendelian inheritance is shown compared with the number of observed pups (obs.). Percentage observed is indicated above the bar graphs. Based on the genotypes of a total of 112 pups from 14 independent litters, a P-value of <0.0001 was determined using binomial distribution and indicated by ***. (d) Normal Mendelian distribution of genotypes was observed among 41 E10.5 to E13.5 embryos from six individual Tlk2+/T breedings. Percentage observed is indicated above the bar graphs. (e) Examples of littermate E10.5 embryos (scale bar=1 mm). (f) E12.5 embryos (scale bar=1 mm) (g) E15.5 embryos (scale bar=2 mm) and (h) E16.5 embryos (scale bar=2 mm). (i) Quantitative real-time PCR analysis of Tlk1 and Tlk2 levels in MEFs from littermates of the indicated genotype. The mean (red bars) and standard deviation (S.D.) of three replicates are plotted. (j) Western blotting of TLK1 and TLK2 protein levels in MEFs of the indicated genotype. Histone H3 is shown as a loading control and a nonspecific (NS) band recognized by the TLK2 antibody is indicated. (k) Hematoxylin and eosin (H&E) (left panels) or Ki67 immunohistochemical staining (right panels) of E12.5 embryo sections of the indicated genotype (scale bar=1 mm)
Figure 3
Figure 3
TLK2 is required for placental development. (a) Semiquantitative analysis of histological phenotypes in Tlk2−/− placentas. In each case, Tlk2−/− placentas (n=10) at the indicated age were compared with wild-type littermates. Phenotypes are abbreviated as follows: placental thickness (Pl.Th), numbers/size of Labyrinth trophoblasts (LT), syncytiotrophoblasts (Syn.T), spongiotrophoblasts including glycogen cells (TS), giant cell trophoblasts (Gi.T) and vasculature (Vas). Summary of the grading system used was provided in the Materials and Methods. (b) Sections from E11.5 and E12.5 littermate placentas stained with Hematoxylin and eosin (H&E). Tlk2−/− placentas are thinner, less cellular and poorly vascularized compared with Tlk2+/+. Scale bars=500 μm. (c) CD31 staining reveals that the vasculature of Tlk2−/− placentas is miniaturized, collapsed and appears slit-like (red arrowheads) compared with the well-developed, widely opened vasculature of Tlk2+/+ (blue arrowheads). Scale bar=20 μm. (d) H&E staining from the indicated age and genotype showing fewer and smaller trophoblasts (arrows) and syncytiotrophoblasts (blue arrowheads) with an absence of fetal vasculature (red arrowhead) in Tlk2−/− placentas. Scale bar=20 μm. (e) H&E staining of placentas showing a thinner trophospongium (spongiotrophoblasts and glycogen cells) in Tlk2−/− placentas. The trophospongium (TS), labyrinth (L) and decidua (D) are indicated. Scale bar=50 μm
Figure 4
Figure 4
Proliferation and gene expression in placentas lacking TLK2. (a) Immunohistochemical staining of the proliferative marker Ki67 or (b) the DNA DSB marker γH2AX in E10.5, E11.5 and E12.5 placentas of the indicated genotype. Similar numbers of proliferative cells are visible in the labyrinth of Tlk2−/− placentas compared with wild type at each stage. Mean percent-positive cells (red bars) and S.D. is graphed in right panels. n=3 and 2 at E10.5, n=3 and 3 at E11.5 and n=5 and 6 at E12.5 for Tlk2+/+and Tlk2−/−, respectively. At least 200 total cells were counted for each individual and scale bar in (a) is equal to 10 μm and in (b) is equal to 100 μm. (c and d) Quantitative real-time PCR analysis of genes expressed in trophoblast lineages from E12.5 placenta samples. Combined data represents the mean of triplicate samples from three individual animals of each genotype. Statistical significance was determined using an upaired t-test (***P<0.0001, **P<0.001, *P<0.05). (e) Immunohistochemical staining for Tpbpa reveals a thinner trophospongium (TS) in the absence of TLK2 at both E10.5 and E12.5. The orientation of the labyrinth (L) is also indicated. Quantification of signal intensity distribution in the TS is shown in the right panel, normalized to area. Scale bar=500 μm
Figure 5
Figure 5
TLK2 interacts with ASF1 and influences its phosphorylation in the placenta. (a) Quantitative real-time PCR of Tlk1 and Tlk2 in wild-type placentas of the indicated age. Mean (red bars) and S.D. of triplicate samples is graphed (n=1, 3 and 1 for each age indicated). (b) Western blotting of TLK1, TLK2 and ASF1 in lysates from E13.5 placenta (Pon.=Ponceau red-stained membrane). TLK2 levels are similar in either tissue (placenta=Pla. and heart/fetal liver=h–l), while TLK1 levels are much higher in embryonic tissue relative to placenta. Samples from two littermate wild-type placentas are shown. Additional examples are shown in Supplementary Figure S4B. (c) Graphic depiction of the combined results from multiple proteomics approaches to identify TLK2-interacting proteins from HEK293T or AD293 cells (IP-MS and BioiD approaches and data are described in further detail in Supplementary Figure S5 and Supplementary Tables S1–S6). TLK1, ASF1a, ASF1b and DYNLL1 (LC8) are the only high confidence interacting proteins identified. LC8 does not appear to be a substrate of TLK2 (Supplementary Figures S5G and S5H). (d) Reduced ASF1-S166 phosphorylation (p-ASF1) in the E12.5 and E13.5 Tlk2−/− placentas. Western blotting of lysates for TLK2, ASF1 and p-ASF1 from littermates of the indicated age. In each case, blots shown are from the same membrane (Pon.=Ponceau red-stained membrane). Quantification of p-ASF1/ASF1 levels in multiple samples of the indicated genotype is shown in the right panel (additional Western blot analysis examples are shown in Supplementary Figure S6A). Statistical significance (P=0.0064) was determined using an unpaired t-test and the mean (red bars) and S.D. are indicated (n=14 and 11, respectively). (e) Co-IP of endogenous TLK2 and ASF1 from wild-type E13.5 placental lysates using antibodies for ASF1 (top panels) or TLK2 (bottom panels). (Pon.=Ponceau red-stained membrane). Additional examples are shown in Supplementary Figure S6B
Figure 6
Figure 6
TLK2 is dispensable in embryonic and adult tissues. (a) Tlk2+/+ and Tlk2−/− littermates are shown from breedings of female Tlk2+/, Sox2-Cre+ and male Tlk2+/F mice. (b) Weight of mice lacking TLK2 is slightly reduced but growth is similar to wild type. Mean (red bars) and S.D. are indicated (n=20 and 9 for 1 month, n=10 and 7 for 2 months, n=6 and 5 for 3 months, n=5 and 4 for 4 months for Tlk2+/+ and Tlk2−/−, respectively). (c) Kaplan–Meier survival curve of mice with the indicated genotypes (Tlk2+/, n=42; Tlk2−/−, n=26). (d) Western blotting of TLK1 and TLK2 using lysates from selected tissues of Tlk2+/+ and Tlk2−/− mice. NS refers to a nonspecific band observed with the TLK2 antibody in many tissues and cell lines. (e) Similar expression patterns of Tlk1 and Tlk2 in adult mice. Taqman real-time PCR analysis of Tlk1 and Tlk2 mRNA levels (log 2-transformed) relative to ActB. Mean (blue bars for Tlk1 and red bars for Tlk2) and S.D. of triplicate reactions from at least two animals are plotted. In each case, levels are normalized to that of the liver (set to 1). (f) Western blotting of TLK1/2 protein levels in 2-month-old male and female wild-type tissues. Glyceraldehyde 3-phosphate dehydrogenase (GAPDH) is shown as a loading control. (g) Examples of littermate Tlk1T/T Tlk2+/+ and Tlk1T/T Tlk2+/T animals at different ages. All Tlk1T/T Tlk2+/T animals (n=4) observed were severely runted and one lacked limbs on the left torso. All mice were killed before 1 month following veterinary advice owing to the lack of mobility and trembling. A Kaplan–Meier survival plot for all related genotypes is presented in Supplementary Figure S7
Figure 7
Figure 7
TLK1 and TLK2 cooperate to maintain cell viability and chromosome stability. (a) Western blot with antibodies against TLK1 and TLK2 in whole-cell extracts of transformed MEFs of the indicated genotypes mock-treated or treated with 4OHT to induce trapping of TLK1 and/or deletion of TLK2 (Pon.=Ponceau red-stained membrane). (b) Deletion of TLKs reduces colony formation. MEFs were mock-treated or treated with 4OHT for 72 h, washed, plated and cultured for 10–14 days. Relative colony number to mock-treated cells is displayed. Tlk1+/+ Tlk2+/+ Cre+/, n= 3; Tlk1C/CTlk2F/ Cre+/, n=6; Tlk2F/ Cre+/, n=6. Results are shown as mean±S.E.M. Experiment was performed in technical duplicates, at least in biological triplicate. Statistical significance was determined using an upaired t-test (****P<0.0001, ***P<0.001). (c) Representative images of IF experiments staining for γH2AX are shown from Tlk1T/T Tlk2F/ cells that were mock-treated or treated with 4OHT. Nuclei were counterstained with 4′,6-diamidino-2-phenylindole (DAPI). (d) Increased DNA DSB formation following the depletion of TLK1 and TLK2. High-throughput microscopy of γH2AX levels per individual nucleus in response to TLK depletion in MEFs mock-treated or treated with 4OHT. At least 800 nuclei were quantified per condition. Mean is shown as a red line; a.u., arbitrary units. Statistical significance was determined using ordinary one-way analysis of variance (ANOVA) Tukey's multiple comparisons test (****P<0.0001). (e) Increased chromosome bridges are evident in 4OHT induced double TLK-deficient cultures relative to mock-treated or Tlk2 deletion alone. A minimum of 200 cells was scored in each independent experiment. Tlk1+/+ Tlk2+/+ Cre+/, n= 2; Tlk1C/CTlk2F/ Cre+/, n=5; Tlk2F/ Cre+/, n=4. Results are shown as mean±S.D. Statistical significance was determined using an upaired t-test (*P<0.05). (f) Plot of chromosomal aberration types scored from multiple transformed MEF cultures depicted as percent aberrations per chromosome. Results are shown as mean±S.E.M. Statistical significance was determined using Fisher’s exact test (****P<0.0001). (g) Western blotting of Tlk1C/CTlk2F/ MEF lysates mock-treated or treated with 4OHT for TLK1, TLK2, ASF1 and p-ASF1. Experiment performed in biological triplicate and a representative example shown. (h) Proposed model for the contribution of TLK1 and TLK2 activity to the placenta and adult tissues. In the placenta, and possibly other cell types or tissues, TLK2 is the prevalent activity and is required to maintain a threshold of signaling required for viability. This likely involves ASF1a/b and potentially other substrates. In most adult tissues, TLK1 and TLK2 are largely redundant and the presence of either is sufficient to provide the necessary activity to support cellular functions required for the maintenance of genome integrity and viability

References

    1. Roe JL, Rivin CJ, Sessions RA, Feldmann KA, Zambryski PC. The Tousled gene in A. thaliana encodes a protein kinase homolog that is required for leaf and flower development. Cell 1993; 75: 939–950. - PubMed
    1. Sillje HH, Takahashi K, Tanaka K, Van Houwe G, Nigg EA. Mammalian homologues of the plant Tousled gene code for cell-cycle-regulated kinases with maximal activities linked to ongoing DNA replication. EMBO J 1999; 18: 5691–5702. - PMC - PubMed
    1. Sillje HH, Nigg EA. Identification of human Asf1 chromatin assembly factors as substrates of Tousled-like kinases. Curr Biol 2001; 11: 1068–1073. - PubMed
    1. Li Y, DeFatta R, Anthony C, Sunavala G, De Benedetti A. A translationally regulated Tousled kinase phosphorylates histone H3 and confers radioresistance when overexpressed. Oncogene 2001; 20: 726–738. - PubMed
    1. Delacroix S, Wagner JM, Kobayashi M, Yamamoto K, Karnitz LM. The Rad9-Hus1-Rad1 (9-1-1) clamp activates checkpoint signaling via TopBP1. Genes Dev 2007; 21: 1472–1477. - PMC - PubMed

MeSH terms