

A new index for characterizing micro-bead motion in a flow induced by ciliary beating: Part I, experimental analysis
- PMID: 28708889
- PMCID: PMC5510807
- DOI: 10.1371/journal.pcbi.1005605
A new index for characterizing micro-bead motion in a flow induced by ciliary beating: Part I, experimental analysis
Abstract
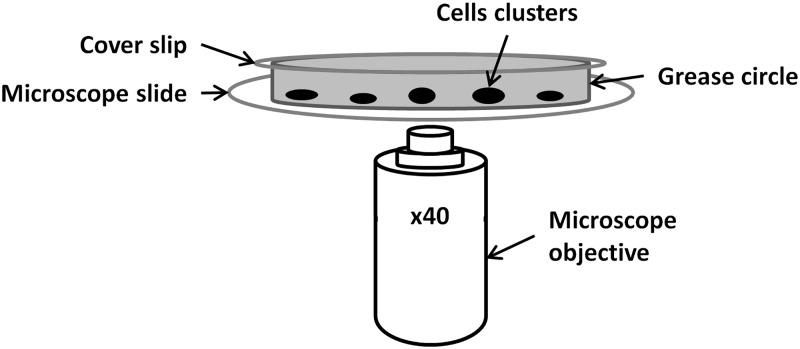
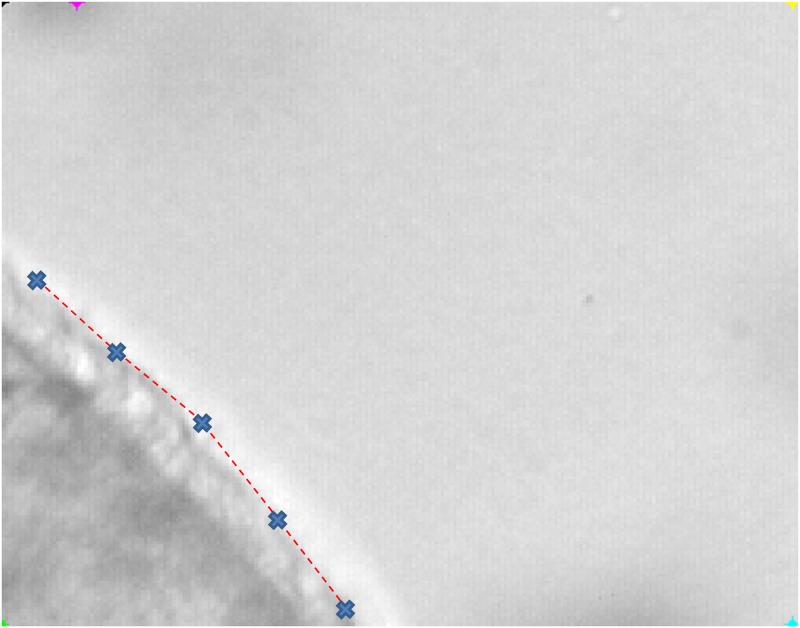
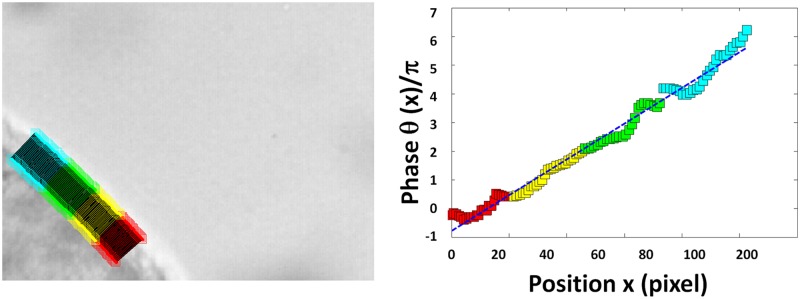
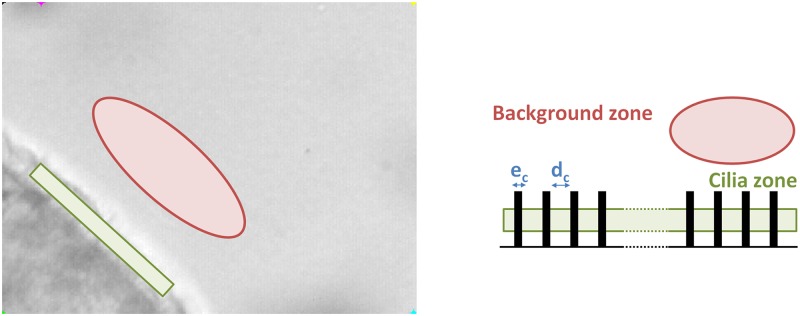
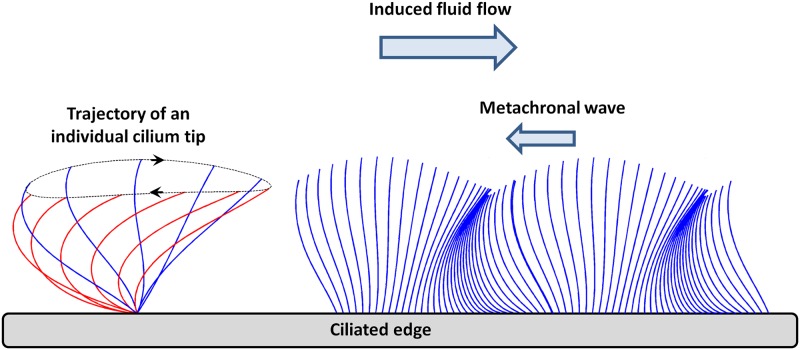
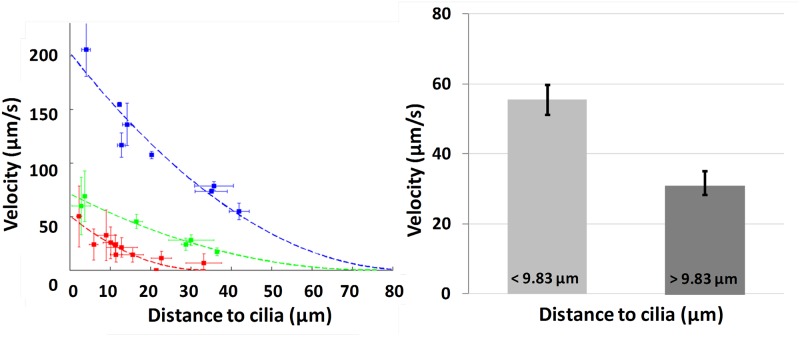
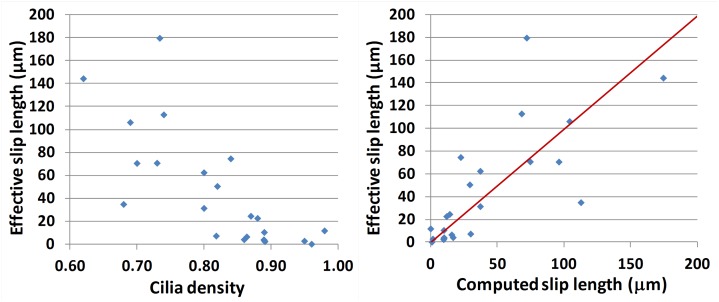
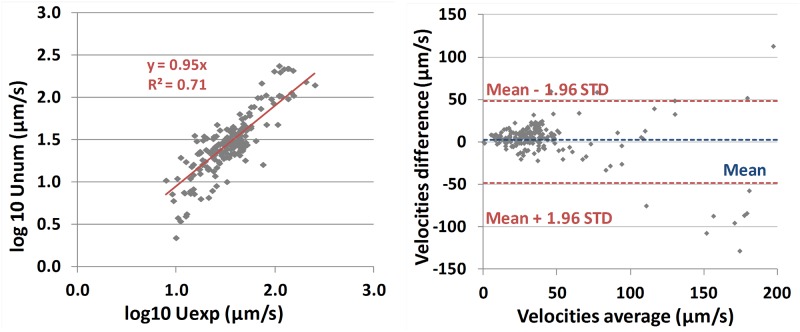
Mucociliary clearance is one of the major lines of defense of the respiratory system. The mucus layer coating the pulmonary airways is moved along and out of the lung by the activity of motile cilia, thus expelling the particles trapped in it. Here we compare ex vivo measurements of a Newtonian flow induced by cilia beating (using micro-beads as tracers) and a mathematical model of this fluid flow, presented in greater detail in a second companion article. Samples of nasal epithelial cells placed in water are recorded by high-speed video-microscopy and ciliary beat pattern is inferred. Automatic tracking of micro-beads, used as markers of the flow generated by cilia motion, enables us also to assess the velocity profile as a function of the distance above the cilia. This profile is shown to be essentially parabolic. The obtained experimental data are used to feed a 2D mathematical and numerical model of the coupling between cilia, fluid, and micro-bead motion. From the model and the experimental measurements, the shear stress exerted by the cilia is deduced. Finally, this shear stress, which can easily be measured in the clinical setting, is proposed as a new index for characterizing the efficiency of ciliary beating.
Conflict of interest statement
The authors have declared that no competing interests exist.
Figures
Similar articles
-
A new index for characterizing micro-bead motion in a flow induced by ciliary beating: Part II, modeling.PLoS Comput Biol. 2017 Jul 14;13(7):e1005552. doi: 10.1371/journal.pcbi.1005552. eCollection 2017 Jul. PLoS Comput Biol. 2017. PMID: 28708866 Free PMC article.
-
Human airway ciliary dynamics.Am J Physiol Lung Cell Mol Physiol. 2013 Feb 1;304(3):L170-83. doi: 10.1152/ajplung.00105.2012. Epub 2012 Nov 9. Am J Physiol Lung Cell Mol Physiol. 2013. PMID: 23144323 Free PMC article.
-
Efficient mucociliary transport relies on efficient regulation of ciliary beating.Respir Physiol Neurobiol. 2008 Nov 30;163(1-3):202-7. doi: 10.1016/j.resp.2008.05.010. Epub 2008 May 22. Respir Physiol Neurobiol. 2008. PMID: 18586580 Review.
-
Luminal fluid tonicity regulates airway ciliary beating by altering membrane stretch and intracellular calcium.Cell Motil Cytoskeleton. 2008 Jun;65(6):469-75. doi: 10.1002/cm.20273. Cell Motil Cytoskeleton. 2008. PMID: 18435452
-
Adaptations of ciliary systems for the propulsion of water and mucus.Comp Biochem Physiol A Comp Physiol. 1989;94(2):359-64. doi: 10.1016/0300-9629(89)90559-8. Comp Biochem Physiol A Comp Physiol. 1989. PMID: 2573480 Review.
Cited by
-
Interplay between environmental yielding and dynamic forcing modulates bacterial growth.Biophys J. 2024 Apr 16;123(8):957-967. doi: 10.1016/j.bpj.2024.03.008. Epub 2024 Mar 7. Biophys J. 2024. PMID: 38454600 Free PMC article.
-
Ciliary Videomicroscopy: A Long Beat from the European Respiratory Society Guidelines to the Recognition as a Confirmatory Test for Primary Ciliary Dyskinesia.Diagnostics (Basel). 2021 Sep 17;11(9):1700. doi: 10.3390/diagnostics11091700. Diagnostics (Basel). 2021. PMID: 34574040 Free PMC article. Review.
-
Oncostatin M Contributes to Airway Epithelial Cell Dysfunction in Chronic Rhinosinusitis with Nasal Polyps.Int J Mol Sci. 2023 Mar 23;24(7):6094. doi: 10.3390/ijms24076094. Int J Mol Sci. 2023. PMID: 37047067 Free PMC article.
-
A new index for characterizing micro-bead motion in a flow induced by ciliary beating: Part II, modeling.PLoS Comput Biol. 2017 Jul 14;13(7):e1005552. doi: 10.1371/journal.pcbi.1005552. eCollection 2017 Jul. PLoS Comput Biol. 2017. PMID: 28708866 Free PMC article.
-
Magnetically driven active topography for long-term biofilm control.Nat Commun. 2020 May 5;11(1):2211. doi: 10.1038/s41467-020-16055-5. Nat Commun. 2020. PMID: 32371860 Free PMC article.
References
-
- Sanderson MJ, Sleigh MA. Ciliary activity of cultured rabbit tracheal epithelium: beat pattern and metachrony. J Cell Sci. 1981;47:331–47. - PubMed
MeSH terms
LinkOut - more resources
Full Text Sources
Other Literature Sources
