. 2017 Jul 14;12(7):e0180907.
doi: 10.1371/journal.pone.0180907. eCollection 2017.

Sex-specific enhancement of palatability-driven feeding in adolescent rats

Affiliations

Sex-specific enhancement of palatability-driven feeding in adolescent rats

Andrew T Marshall et al. PLoS One. .

Abstract

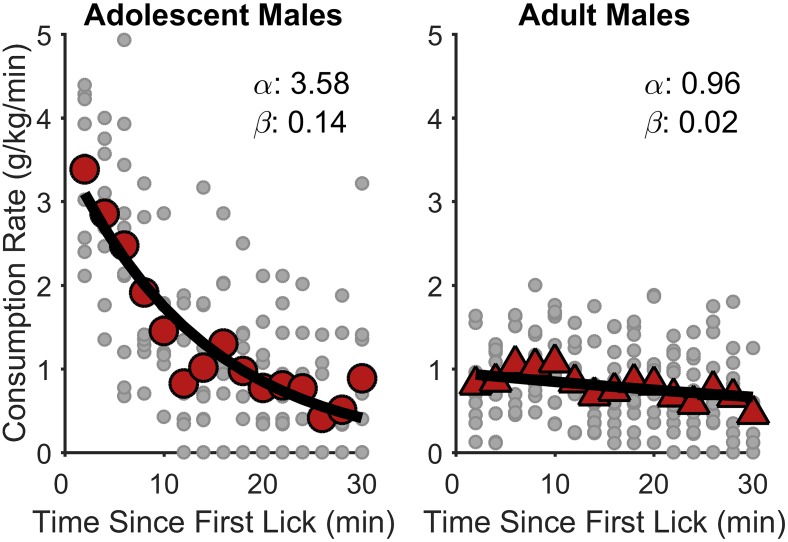
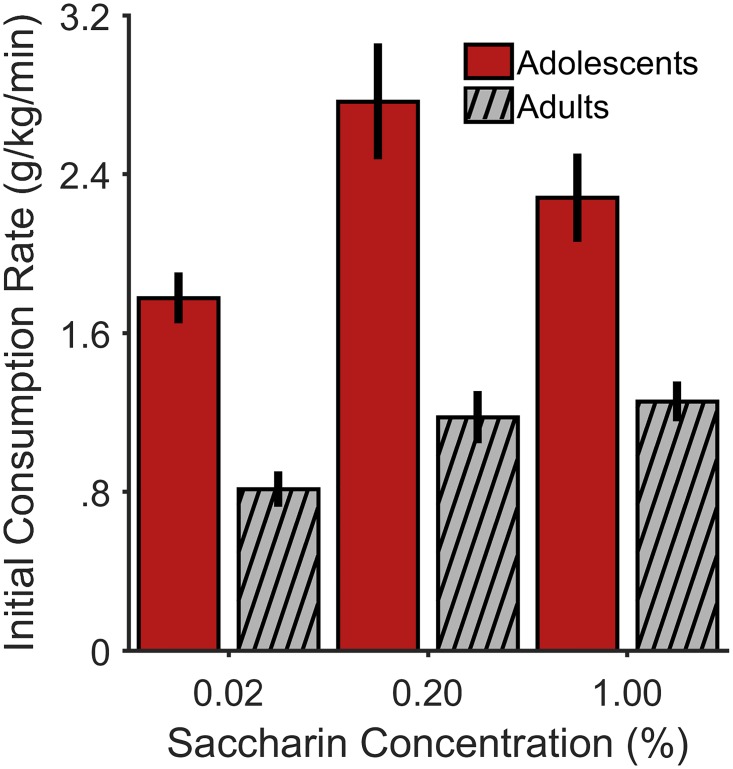
It has been hypothesized that brain development during adolescence perturbs reward processing in a way that may ultimately contribute to the risky decision making associated with this stage of life, particularly in young males. To investigate potential reward dysfunction during adolescence, Experiment 1 examined palatable fluid intake in rats as a function of age and sex. During a series of twice-weekly test sessions, non-food-deprived rats were given the opportunity to voluntarily consume a highly palatable sweetened condensed milk (SCM) solution. We found that adolescent male, but not female, rats exhibited a pronounced, transient increase in SCM intake (normalized by body weight) that was centered around puberty. Additionally, adult females consumed more SCM than adult males and adolescent females. Using a well-established analytical framework to parse the influences of reward palatability and satiety on the temporal structure of feeding behavior, we found that palatability-driven intake at the outset of the meal was significantly elevated in adolescent males, relative to the other groups. Furthermore, although we found that there were some group differences in the onset of satiety, they were unlikely to contribute to differences in intake. Experiment 2 confirmed that adolescent male rats exhibit elevated palatable fluid consumption, relative to adult males, even when a non-caloric saccharin solution was used as the taste stimulus, demonstrating that these results were unlikely to be related to age-related differences in metabolic need. These findings suggest that elevated palatable food intake during adolescence is sex specific and driven by a fundamental change in reward processing. As adolescent risk taking has been hypothesized as a potential result of hypersensitivity to and overvaluation of appetitive stimuli, individual differences in reward palatability may factor into individual differences in adolescent risky decision making.


Conflict of interest statement

Competing Interests: The authors have declared that no competing interests exist.

Figures

Fig 1
Fig 1. Experimental timeline.
The top row corresponds to previously proposed age ranges of adolescence in male and female rats. The second and third rows show the mean (± 1 SD) of puberty onset for the adolescent rats in Experiment 1. The bottom four rows correspond to the ages at which training and testing occurred in Experiments 1 and 2 for adolescent and adult rats. # = Spear (3).
Fig 2
Fig 2. Normalized SCM consumption in Experiment 1.
The data are group means +/- 1 between-subjects SEM. The abscissa is session, and the ordinate is SCM consumption per kilogram body weight (i.e., normalized SCM consumption). The shaded area of each panel corresponds to the test sessions in which adolescent males showed elevated normalized SCM consumption relative to earlier and later sessions. The purpose of the shading in the bottom panel is to facilitate comparison. There was a 3–4 d interval between consecutive sessions (i.e., a one-week interval between odd-numbered test sessions and between even-numbered test sessions). Subsequent analyses of all rats’ data in Experiment 1 (see Testing: Within-session Consumption Rate) only included the data in the sessions within the shaded panels (i.e., Sessions 3–6). See Table 1 for the corresponding statistical analyses results.
Fig 3
Fig 3. Normalized within-session SCM consumption rates in Experiment 1.
The large data points reflect group mean consumption rates in 2-min bins for adolescent males (top-left), adolescent females (top-right), adult males (bottom-left), and adult females (bottom-right). The small shaded data points within each panel represent data from individual rats within that group. The thick line is the best-fitting negative exponential function. The within-panel α and β values are the fitted values of the corresponding exponential function (i.e., α is the y-intercept and a metric for reward palatability; β is the function’s decay and a metric for the induction of satiety). Adolescent males exhibited significantly greater initial consumption rates (α) and decay rates (β) than each of the other three groups, ps < .003.
Fig 4
Fig 4. Bivariate scatter plots of individual rats’ mean normalized SCM consumption, initial consumption rates (α), and consumption rate decay (β) in Experiment 1.
Each data point represents an individual rat, identified with respect to its sex and age group. The solid and dotted lines are the best-fitting regression lines for each groups’ data. The thick dashed line represents the best-fitting regression line of the data collapsed across groups. There were significant positive relationships between α and β, p = .001 (left), and between α and mean normalized SCM intake (middle), p < .001. Note: The linear fits are extended beyond the range of the data points for ease of visual interpretation. Adol-M = adolescent-males; Adol-F = adolescent-females; Adult-M = adult-males; Adult-F = adult-females; (D) = data; (F) = linear fit.
Fig 5
Fig 5. Normalized within-session saccharin consumption rates in Experiment 2.
The large data points reflect group mean consumption rates in 2-min bins for adolescent males (left) and adult males (right). The small shaded data points represent individual rats’ data points from individual rats within that group. The thick line is the best-fitting negative exponential function. The within-panel α and β values are the fitted values of the corresponding exponential function (i.e., α is the y-intercept and a metric for reward palatability; β is the function’s decay and a metric for the induction of satiety). Adolescent males exhibited significantly greater initial consumption rates (α) and decay rates (β) than adult males, ps < .001.
Fig 6
Fig 6. Initial normalized saccharin consumption rates as a function of saccharin concentration for each age group in Experiment 2.
The bars represent group means and the error bars represent +/- 1 between-subjects SEM relative to the group mean.

References

    1. Chambers RA, Taylor JR, Potenza MN. Developmental neurocircuitry of motivation in adolescence: a critical period of addiction vulnerability. Am J Psychiatry. 2003;160(6):1041–52. doi: 10.1176/appi.ajp.160.6.1041 - DOI - PMC - PubMed
    1. Crews F, He J, Hodge C. Adolescent cortical development: a critical period of vulnerability for addiction. Pharmacol Biochem Behav. 2007;86:189–99. doi: 10.1016/j.pbb.2006.12.001 . - DOI - PMC - PubMed
    1. Spear LP. The adolescent brain and age-related behavioral manifestations. Neurosci Biobehav Rev. 2000;24(4):417–63. doi: 10.1016/S0149-7634(00)00014-2 . - DOI - PubMed
    1. Doremus-Fitzwater TL, Varlinskaya EI, Spear LP. Motivational systems in adolescence: possible implications for age differences in substance abuse and other risk-taking behaviors. Brain Cogn. 2010;72:114–23. doi: 10.1016/j.bandc.2009.08.008 - DOI - PMC - PubMed
    1. Steinberg L. A social neuroscience perspective on adolescent risk-taking. Dev Rev. 2008;28(1):78–106. doi: 10.1016/j.dr.2007.08.002 - DOI - PMC - PubMed

Substances