. 2017 Jul 13;170(2):260-272.e8.
doi: 10.1016/j.cell.2017.06.030.

Functional Profiling of a Plasmodium Genome Reveals an Abundance of Essential Genes

Affiliations

Functional Profiling of a Plasmodium Genome Reveals an Abundance of Essential Genes

Ellen Bushell et al. Cell. .

Abstract

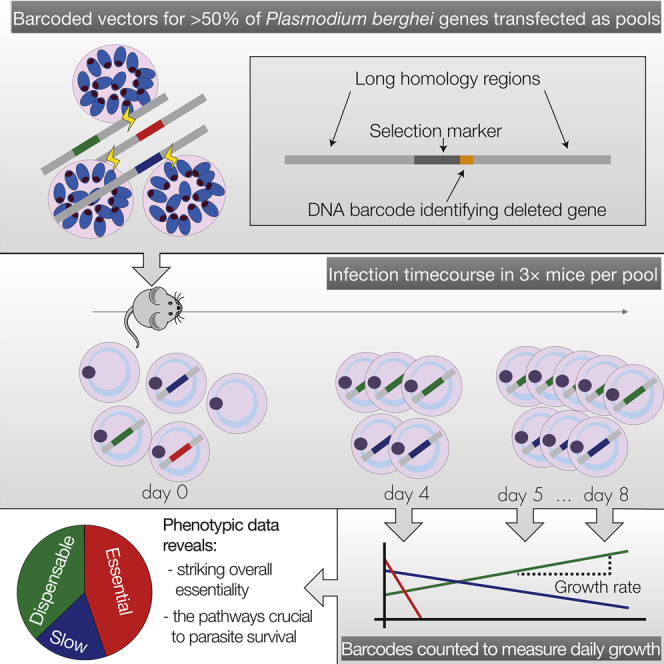
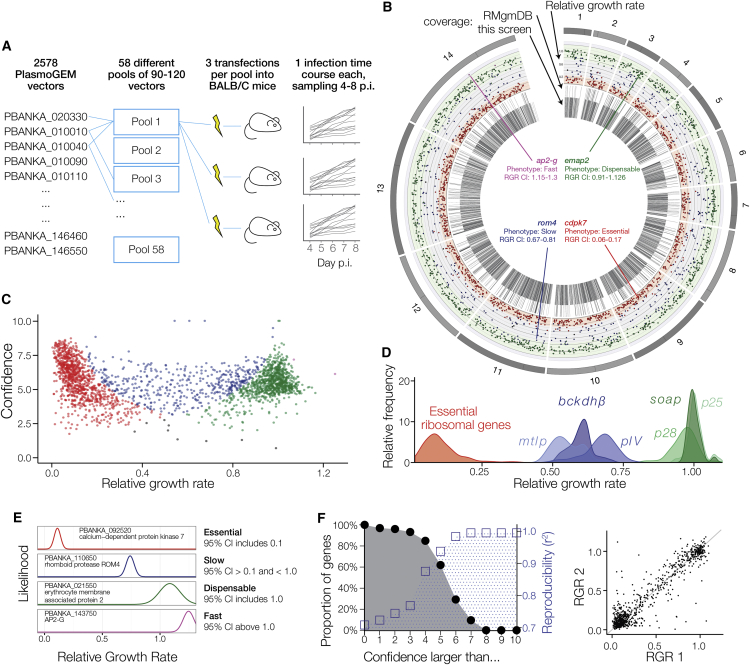
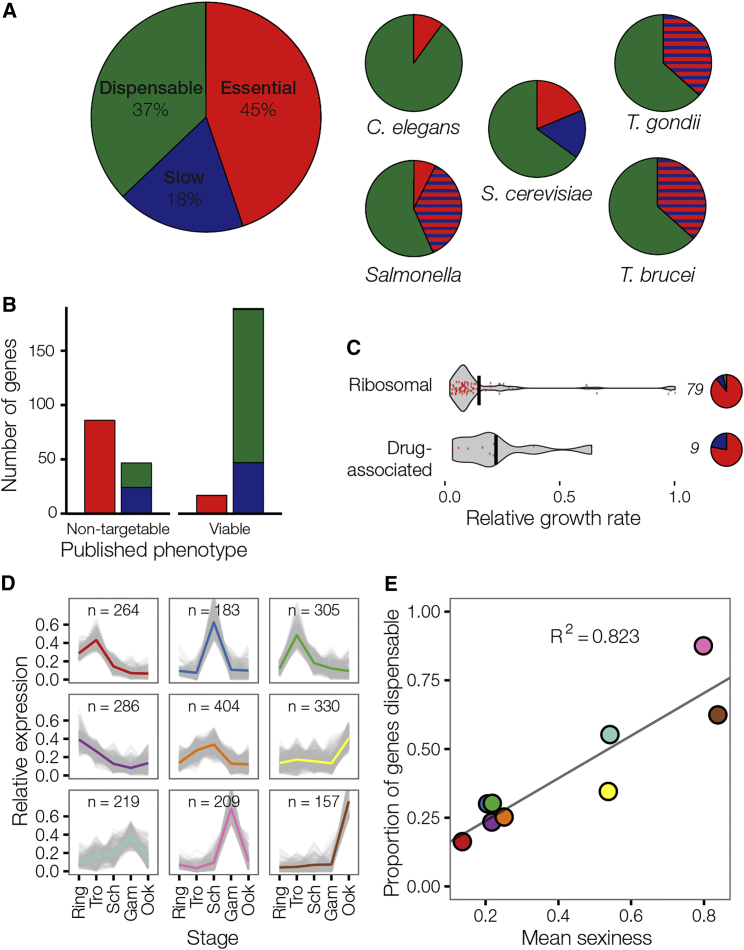
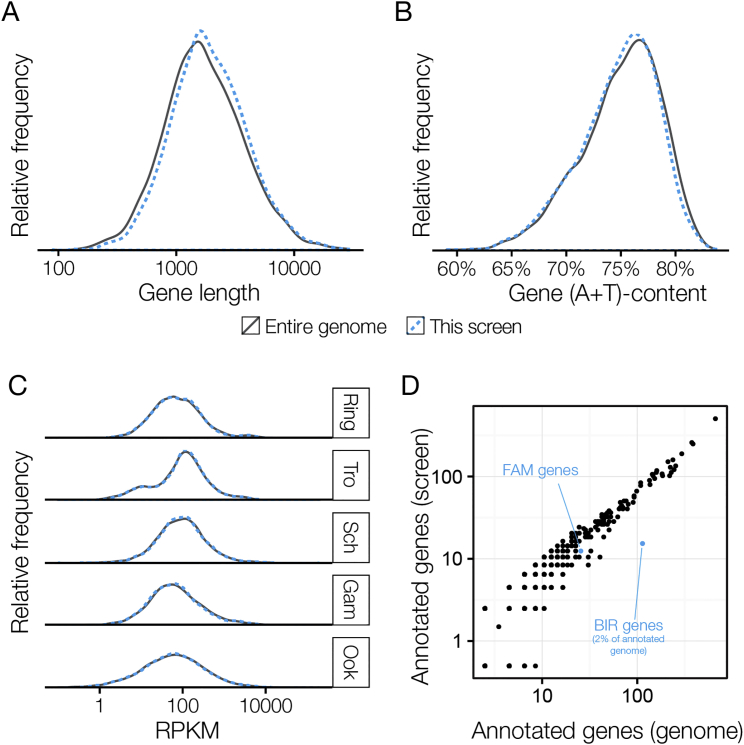
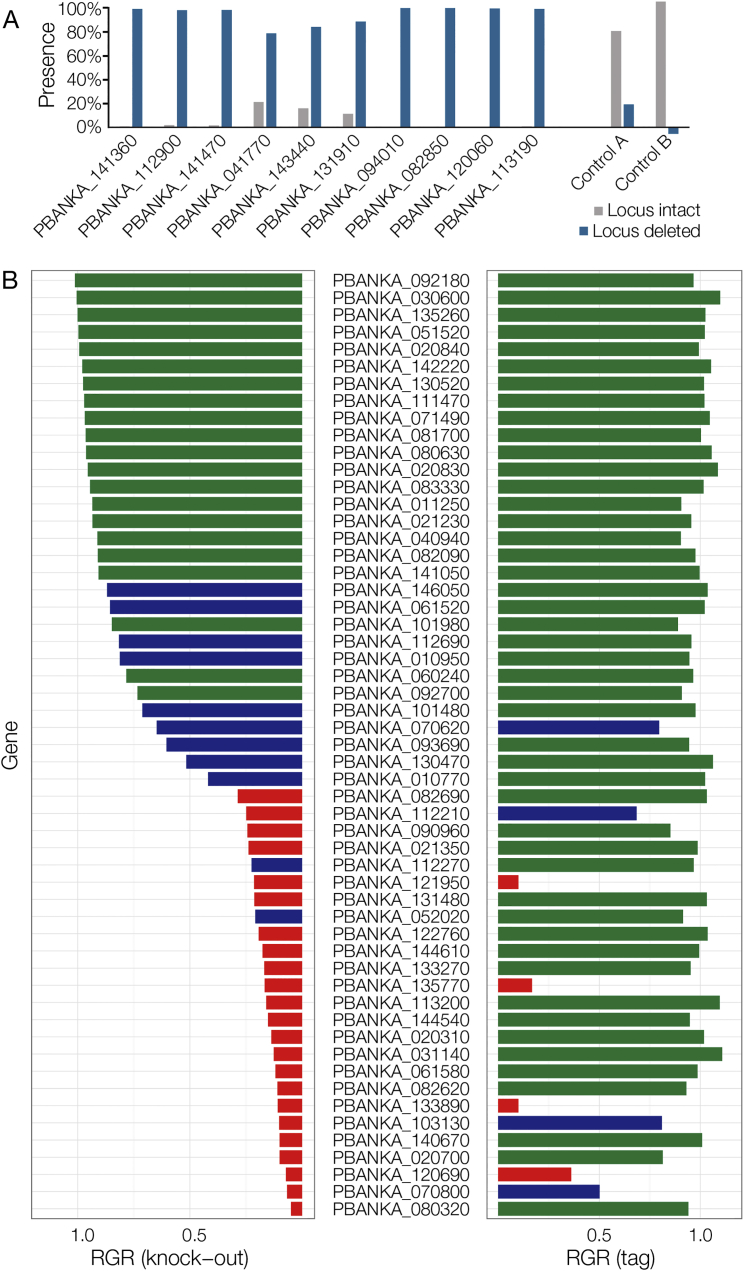
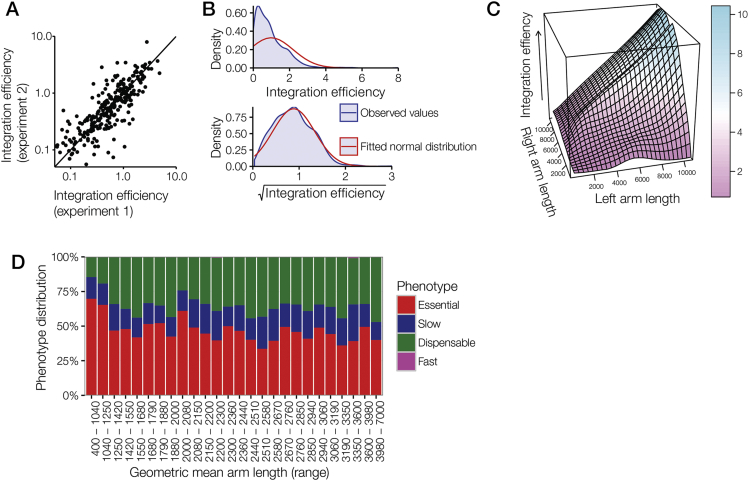
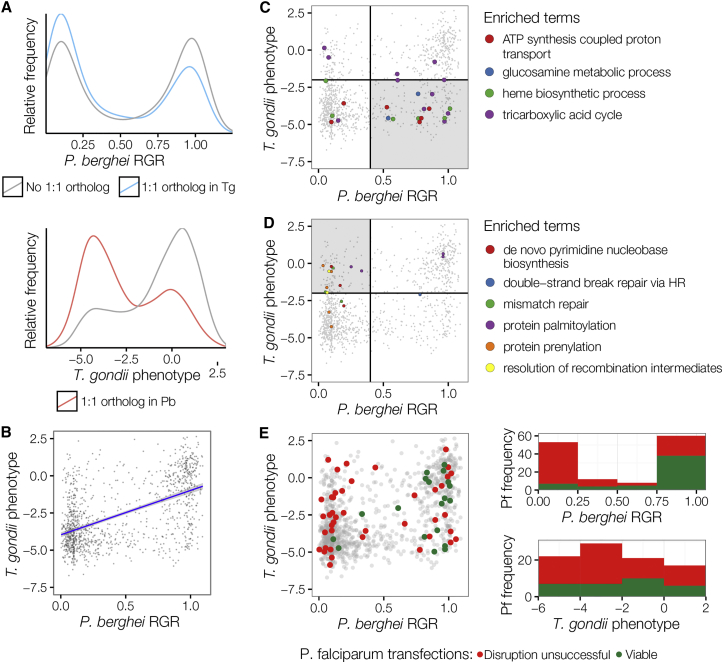
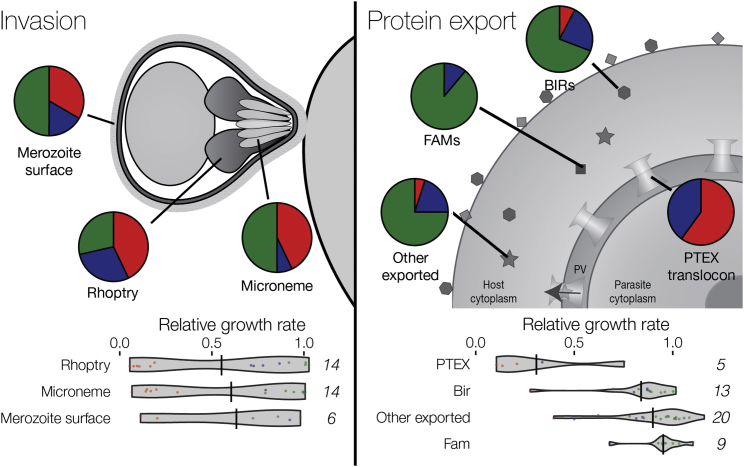
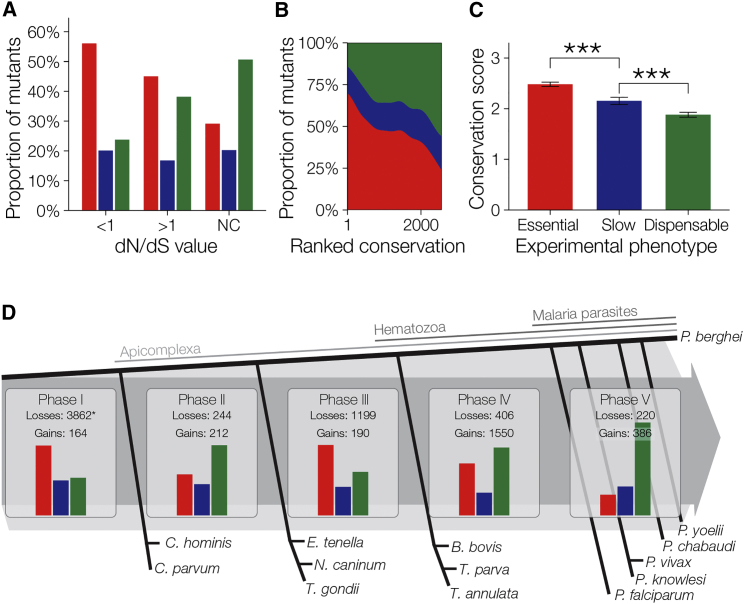
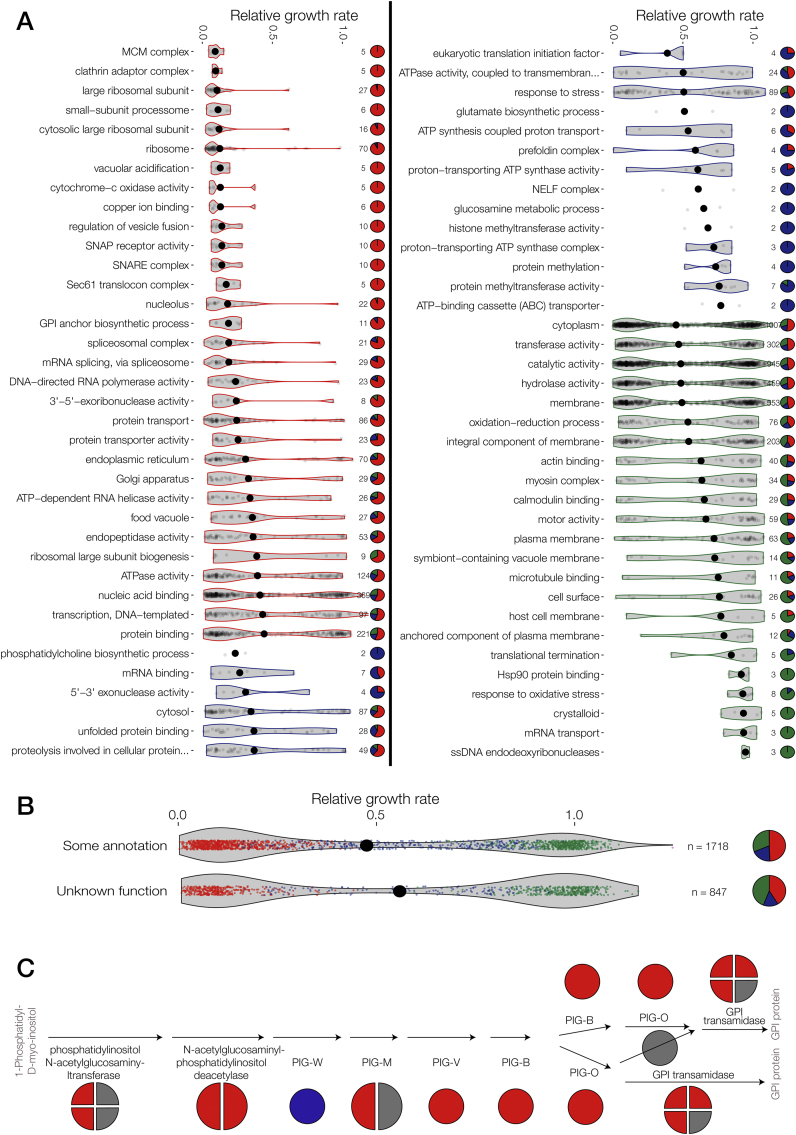
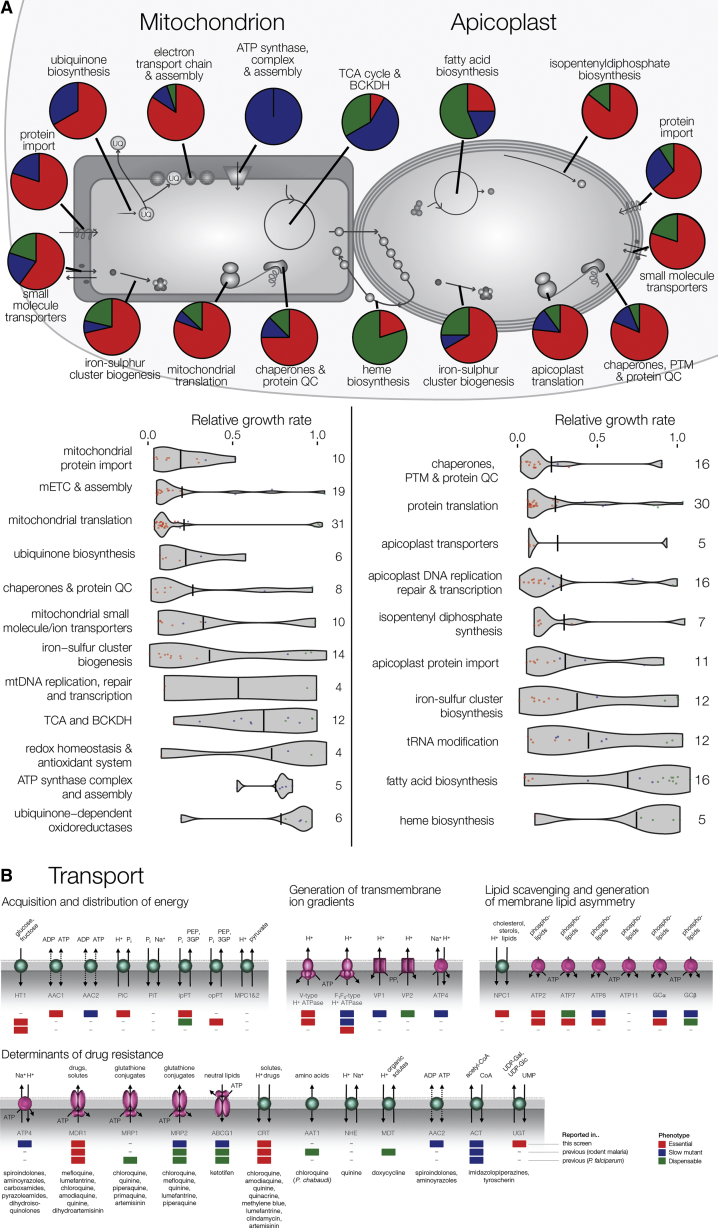
The genomes of malaria parasites contain many genes of unknown function. To assist drug development through the identification of essential genes and pathways, we have measured competitive growth rates in mice of 2,578 barcoded Plasmodium berghei knockout mutants, representing >50% of the genome, and created a phenotype database. At a single stage of its complex life cycle, P. berghei requires two-thirds of genes for optimal growth, the highest proportion reported from any organism and a probable consequence of functional optimization necessitated by genomic reductions during the evolution of parasitism. In contrast, extreme functional redundancy has evolved among expanded gene families operating at the parasite-host interface. The level of genetic redundancy in a single-celled organism may thus reflect the degree of environmental variation it experiences. In the case of Plasmodium parasites, this helps rationalize both the relative successes of drugs and the greater difficulty of making an effective vaccine.

Keywords: Plasmodium falciparum; Toxoplasma gondii; genome evolution; gene essentiality; PlasmoGEM; genetic screen; drug target validation; apicoplast; mitochondria; transporters.


Figures

None
Graphical abstract
Figure 1
Figure 1
A BarSeq Screen for Parasite Growth Rate (A) Schematic illustration of screen design. (B) Circos plot showing, from the outer to inner circle, chromosome, mutant RGR (color coded by phenotype as in E), extent of previous phenotyping as reported on RMgmDB, and coverage in our screen. (C) Screenshot of the PlasmoGEM phenotype viewer showing RGR measurements plotted against confidence expressed as the negative logarithm of their variance. See (E) for color coding of phenotypes. (D) Frequency distribution of the >50 RGR replicates available for six control genes compared to essential ribosomal genes. (E) Asexual growth phenotypes defined using confidence intervals (CI) and illustrated with representative genes. (F) Graph on the left showing percentage of genes with at least one RGR measurement at a given confidence limit (black circles) and how confidence relates to experimental reproducibility (blue squares). Reproducibility of independent duplicates is illustrated by the regression plot on the right for confidence 4 or above, a level reached by at least one measurement for 85% of genes in the screen. See also Figure S1 and Table S1.
Figure 2
Figure 2
Most P. berghei Genes Are Required for Normal Growth of Asexual Blood Stages In Vivo (A) Frequency distribution of phenotypes in P. berghei compared to published data from other eukaryotes. Data from yeast are for growth in rich medium. Data from T. gondii are from a CRISPR-Cas9 screen in human foreskin fibroblasts. Genes required for normal growth are hatched red/blue since lethality and reduced growth phenotypes were not distinguished. Salmonella Typhimurium genes are for normal growth in medium (red) or additionally required for oral colonization of farm animals (hatched). T. brucei data is from an RNAi in vitro screen. See text for data sources. (B) BarSeq phenotypes compared to published data from RMgmDB. (C) Average RGR and phenotype distribution for predicted essential genes. Gene numbers per category shown next to pie charts. Enrichment for essential genes is significant at p < 0.001 for ribosomal genes and p < 0.1 for known drug targets. (D) All expressed genes covered by the screen were grouped into nine clusters depending on their relative expression across five life-cycle stages. All genes within a cluster were weighted equally. (E) For each cluster, the proportion of normalized read counts from sexual (gametocyte and ookinete) versus asexual developmental stages was calculated (“sexiness”) and plotted against the proportion of dispensable genes in that cluster. Ring, ring stage parasites; Tro, trophozoites; Sch, schizonts; Gam, gametocytes; Ook, ookinetes. See also Figures S2 and S3 and Tables S3 and S4.
Figure S1
Figure S1
Genes in the Screen Are Largely Representative of the Genome, Related to Figure 1 and Table S2 (A and B) Genes for which targeting vectors could be generated were similar (A) in size and (B) in A+T nucleotide content. (C) Targeted genes had expression levels representative of the genome across all life stages (RPKM data from Otto et al., 2014). (D) Relative representation of GO terms and multigene families in the genome and and the screen. The screen was largely representative with the exception of the P. berghei pir family (BIR) which we suspect is underrepresented due to its subtelomeric genomic location and repetitive nature. However, the well represented FAM family is shown for comparison.
Figure S2
Figure S2
Validation of Dispensable and Essential Phenotypes, Related to Figure 2 (A) For 10 genes whose disruption had previously failed (RMgmDB), quantitative PCR was used to measure the proportion of parasites that retained the wild-type locus following transfection of individual deletion vectors. In each case the population was dominated by viable mutant parasites, validating the screen result. Controls A and B show a reciprocal primer swap for mutants in PBANKA_082850 and PBANKA_120060. (B) Relative growth rates were determined using KO or C-terminal tagging vectors for the same set of genes. Phenotype calls are color coded. Green = RGR not significantly different from of 1. Red = RGR not significantly different from 0.1 Blue = Intermediate RGR.
Figure S3
Figure S3
Vector Properties Determine Homologous Integration Rates, Related to Figure 2 Vector-specific integration efficiencies were calculated for the set of 915 dispensable genes by normalizing the relative abundance of a mutant during the infection to the relative abundance of the vector measured from the electroporation cuvette, and by using the four normally growing controls to normalize between experiments. (A) Vector integration efficiencies were highly reproducible between independent experiments (log-log R2: 0.76). (B) Relative abundances of dispensable mutants became normally distributed after applying a square root function, suggesting targeting efficiency might be the result of two independent variables interacting in a multiplicative fashion. (C) Modeling the effect on targeting efficiency of homology arm lengths, which in the PlasmoGEM resource varies from 400 bp to 14.8 kb. Initial analyses revealed the length of each homology arm to be independently linked with integration efficiency. This effect plateaus at around 5 kb due to the confounding fact that the lengths of the two homology arms are inversely correlated, since they trade off against each other for space on the vector. The graph shows a three dimensional model fitted to the data, and illustrates increasing targeting efficiency of vectors with arm length up to at least 10 kb. The product of homology arms lengths explained around 60% of the overall variation in targeting efficiency (log-log R2: 0.42). The remaining non-stochastic variation may be due to DNA structure and chromatin state, but combining a number of data sources with machine learning approaches failed to model these factors to improve predictive accuracy. (D) Assessment of calculated phenotypes across a range of geometric-mean homology arm lengths (groups are, as far as possible, of equal sizes). There is an even phenotype distribution across the space of homology arms, with the possible exception of a technical bias toward essential calls for vectors with a geometric mean homology arm length less than 1.25 kb. As a result, this set of vectors was discarded when calculating overall genome essentiality.
Figure 3
Figure 3
Comparison of Phenotypes for Orthologous Genes across Three Apicomplexan Species (A) The distribution of 1:1 orthologous genes in P. berghei and T. gondii (data from Sidik et al., 2016) is significantly shifted toward essentiality as compared to non-shared genes. (B) There is highly significant correlation of phenotypes between species for orthologous genes, but there are also numerous genes without conserved phenotypes. (C) All significantly enriched GO terms among genes that are more dispensable in P. berghei (shaded area). (D) Same as in (C) but for genes more dispensable in T. gondii (shaded area). (E) Left: data as in (B) but overlaid with published P. falciparum phenotypes (Sanderson and Rayner, 2017). Right: data from pairwise comparisons. P. falciparum phenotypes are color coded (green, viable mutant; red, confirmed essential or disruption failed). See also Table S5.
Figure 4
Figure 4
Reduced Essentiality among Genes Involved in Direct Interactions with the Host Phenotype distributions for secreted and surface proteins of the invasive merozoite and for proteins exported from the asexual intraerythrocytic parasite are shown as pie charts using the same colors as in Figure 2. Gene numbers in each category are next to violin plots showing RGR. Enrichment in dispensable genes is significant for bir (p < 0.02), fam, and “other exported” (both p < 0.01). See also Table S3.
Figure 5
Figure 5
Genomic Reduction and High Gene Essentiality during the Evolution of Hematozoa (A) Phenotype distributions for the P. berghei orthologs of genes under purifying selection in P. falciparum (dN/dS <1) and genes potentially under positive selection in P. falciparum (dN/dS >1) compared to P. berghei genes without orthologs in P. falciparum. (B) Genes highly conserved between Plasmodium species are enriched for essential phenotypes. Genes are ranked by their conservation between P. chabaudi and P. falciparum (according to the MalariaGEN Plasmodium falciparum Community Project, 2016) with the phenotype distribution of P. berghei orthologs and different conservation levels plotted. (C) Phenotype is significantly predictive of inter-species conservation score (∗∗∗p < 0.0001). (D) The evolutionary history of P. berghei is shown through the gain and loss of groups of orthologs as reconstructed using a Dollo parsimony model ( taken from Woo et al. [2015]). Bar charts show relative distribution of P. berghei phenotypes among extant genes belonging to the orthologous groups gained during each phase: Phase I, from the free-living protoapicomplexan to the first apicomplexan; Phase II, from the first apicomplexan to the ancestor of the piroplasms and coccidians; Phase III, from this ancestor to the first hematozoan; Phase IV, from the first hematozoan to the first malaria parasite; and Phase V, from the first malaria parasite to P. berghei. See also Table S6.
Figure S4
Figure S4
Analysis of Gene Functions Associated with Phenotypes, Related to Figure 6 and Table S7 (A) GO terms significantly enriched for genes with essential, slow or dispensable phenotype (p < 0.05). See Table S7 for genes in all significant categories. (B) Phenotypes of genes of unknown function. In both panels violin plots show RGRs, with the median indicated by a black dot. Gene numbers per category are given next to pie charts showing phenotype distributions. Color scheme as in Figure 2. (C) Phenotypes mapped onto genes involved in GPI-anchor biosynthesis.
Figure 6
Figure 6
Knockout Phenotypes of Selected Organellar Pathways and Transport Functions (A) RGR and phenotype distribution of putative mitochondrial and apicoplast genes. See Table S3 for genes in each category. Violin plots show growth rate distributions with the horizontal line indicating the median. Number of genes per category is stated. (B) Knockout phenotypes of selected Plasmodium transporters. Dispensable, slow, and essential phenotypes are indicated by the green, blue, and red boxes, respectively. The phenotypes are from this study (top box) and from published P. berghei (middle box) and P. falciparum (bottom box) studies. Pumps (i.e., primary active transporters) are shown in pink and carriers (i.e., uniporters, symporters, and antiporters) in aqua. Examples of the antimalarial drugs affected by the resistance determinants are listed below each transporter. See also Figure S4 and Tables S7 and S8.

References

    1. Alexa A., Rahnenführer J., Lengauer T. Improved scoring of functional groups from gene expression data by decorrelating GO graph structure. Bioinformatics. 2006;22:1600–1607. - PubMed
    1. Alsford S., Turner D.J., Obado S.O., Sanchez-Flores A., Glover L., Berriman M., Hertz-Fowler C., Horn D. High-throughput phenotyping using parallel sequencing of RNA interference targets in the African trypanosome. Genome Res. 2011;21:915–924. - PMC - PubMed
    1. Aly A.S., Vaughan A.M., Kappe S.H. Malaria parasite development in the mosquito and infection of the mammalian host. Annu. Rev. Microbiol. 2009;63:195–221. - PMC - PubMed
    1. Aurrecoechea C., Brestelli J., Brunk B.P., Fischer S., Gajria B., Gao X., Gingle A., Grant G., Harb O.S., Heiges M. EuPathDB: a portal to eukaryotic pathogen databases. Nucleic Acids Res. 2010;38:D415–D419. - PMC - PubMed
    1. Barquist L., Langridge G.C., Turner D.J., Phan M.D., Turner A.K., Bateman A., Parkhill J., Wain J., Gardner P.P. A comparison of dense transposon insertion libraries in the Salmonella serovars Typhi and Typhimurium. Nucleic Acids Res. 2013;41:4549–4564. - PMC - PubMed

LinkOut - more resources