. 2017 Dec;12(1):455.
doi: 10.1186/s11671-017-2225-3. Epub 2017 Jul 14.

The Enhanced Photo-Electrochemical Detection of Uric Acid on Au Nanoparticles Modified Glassy Carbon Electrode

Affiliations

The Enhanced Photo-Electrochemical Detection of Uric Acid on Au Nanoparticles Modified Glassy Carbon Electrode

Yuting Shi et al. Nanoscale Res Lett. 2017 Dec.

Abstract

In this work, a sensitive and novel method for determining uric acid (UA) has been developed, in which the glassy carbon electrode (GCE) was modified with electrodeposition Au nanoparticles and used to monitor the concentration of UA with the assistant of visible light illumination. The morphology of the Au nanoparticles deposited on GCE surface were characterized by scanning electron microscope (SEM) and the nanoparticles were found to be well-dispersed spheres with the average diameter approaching 26.1 nm. A series of cyclic voltammetry (CV) and differential pulse voltammetry (DPV) measurements have revealed that the introduction of visible light can greatly enhance both the strength and stability of response current due to the surface plasmon resonance (SPR). Specifically, the DPV showed a linear relationship between peak current and UA concentration in the range of 2.8 to 57.5 μM with the equation of I pa (μA) = 0.0121c UA (μM) + 0.3122 (R 2 = 0.9987). Herein, the visible light illuminated Au/GCE possesses a potential to be a sensitive electrochemical sensor in the future.

Keywords: AuNPs; Uric acid; Visible light.


Conflict of interest statement

Publisher’s Note

Springer Nature remains neutral with regard to jurisdictional claims in published maps and institutional affiliations.

Figures
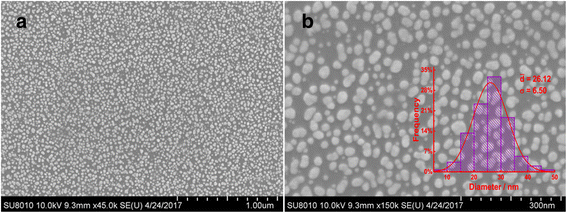
Fig. 1
Fig. 1
SEM images of Au/GCE at lower (a) and higher magnification (b). Inset: corresponding Au nanoparticles size distribution histogram
Fig. 2
Fig. 2
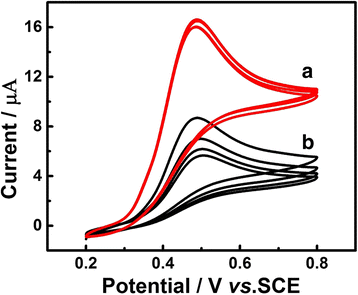
CVs of Au/GCE in 0.1 M PBS (pH 7.0) solution containing 1.0 mM UA with (a) and without (b) visible light illumination. Scan rate 50 mV s−1
Fig. 3
Fig. 3
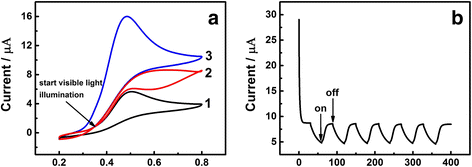
a Potential/V vs.SCE. The CV of Au/GCE in 0.1 M PBS (pH 7.0) solution containing 1.0 mM UA without (1) and with (3) visible light illumination; visible light illumination starts from the spot where the arrow is pointing (2). Scan rate 50 mV s−1. b Time/s. Photocurrent response of Au/GCE under visible light illumination in 0.1 M PBS (pH 7.0) solution containing 1.0 mM UA at 0.48 V. The illumination from a Xe lamp was interrupted every 30 s
Fig. 4
Fig. 4
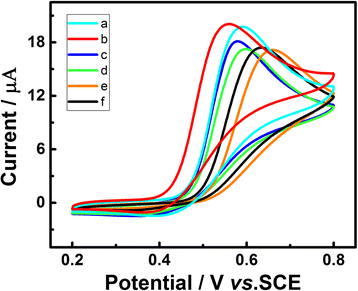
CVs of Au/GCE electrodeposited with different quantity of gold: 57.8 (a), 28.9 (b), 9.6 (c), 4.8 (d), 0.96 μg/cm2 (e), and bare GCE (f) in 0.1 M PBS (pH 7.0) solution containing 1.0 mM UA under visible light illumination. Scan rate 50 mV s−1. Depositing potential −0.2 V
Fig. 5
Fig. 5
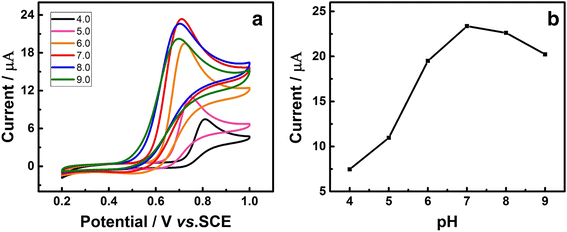
a CVs of the Au/GCE in 1 mM UA with different pH PBS solution (pH = 4.0, 5.0, 6.0, 7.0, 8.0, and 9.0), scan rate 50 mV s−1. b Relationship between the oxidation peak current and pH value
Fig. 6
Fig. 6
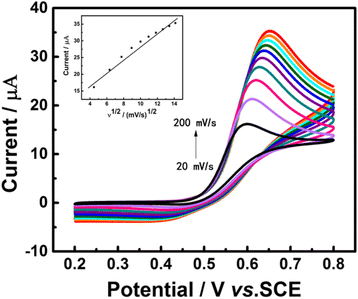
CVs of the Au/GCE in 0.1 M PBS (pH = 7.0) solution containing 1 mM UA at scan rates ranging from 20 to 200 mV s−1. Inset: calibration curve of peak current vs. v1/2
Fig. 7
Fig. 7
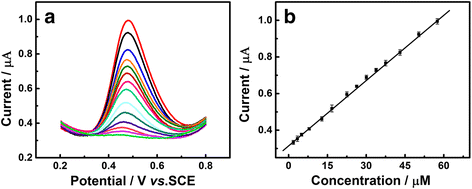
a DPV curves of the Au/GCE in 0.1 M PBS (pH 7.0) at different concentrations of UA. b Plots of anodic peak currents vs. concentration of UA

Similar articles

Cited by

References

    1. Kutzing MK, Firestein BL. Altered uric acid levels and disease states. J Pharmacol Exp Ther. 2007;324(1):1–7. doi: 10.1124/jpet.107.129031. - DOI - PubMed
    1. Galbán J, Andreu Y, Almenara M, de Marcos S, Castillo JR. Direct determination of uric acid in serum by a fluorometric-enzymatic method based on uricase. Talanta. 2001;54(5):847–54. doi: 10.1016/S0039-9140(01)00335-6. - DOI - PubMed
    1. Zhang Y, Wen G, Zhou Y, Shuang S, Dong C, Choi MM. Development and analytical application of an uric acid biosensor using an uricase-immobilized eggshell membrane. Biosens Bioelectron. 2007;22(8):1791–7. doi: 10.1016/j.bios.2006.08.038. - DOI - PubMed
    1. George SK, Dipu MT, Mehra UR, Singh P, Verma AK, Ramgaokar JS. Improved HPLC method for the simultaneous determination of allantoin, uric acid and creatinine in cattle urine. J Chromatogr B Analyt Technol Biomed Life Sci. 2006;832(1):134–7. doi: 10.1016/j.jchromb.2005.10.051. - DOI - PubMed
    1. Dai X, Fang X, Zhang C, Xu R, Xu B. Determination of serum uric acid using high-performance liquid chromatography (HPLC)/isotope dilution mass spectrometry (ID-MS) as a candidate reference method. J Chromatogr B Analyt Technol Biomed Life Sci. 2007;857(2):287–95. doi: 10.1016/j.jchromb.2007.07.035. - DOI - PubMed

LinkOut - more resources