. 2017 Jul 14;16(1):120.
doi: 10.1186/s12943-017-0668-x.

Clonal competition in BcrAbl-driven leukemia: how transplantations can accelerate clonal conversion

Affiliations

Clonal competition in BcrAbl-driven leukemia: how transplantations can accelerate clonal conversion

Kerstin Cornils et al. Mol Cancer. .

Abstract

Background: Clonal competition in cancer describes the process in which the progeny of a cell clone supersedes or succumbs to other competing clones due to differences in their functional characteristics, mostly based on subsequently acquired mutations. Even though the patterns of those mutations are well explored in many tumors, the dynamical process of clonal selection is underexposed.

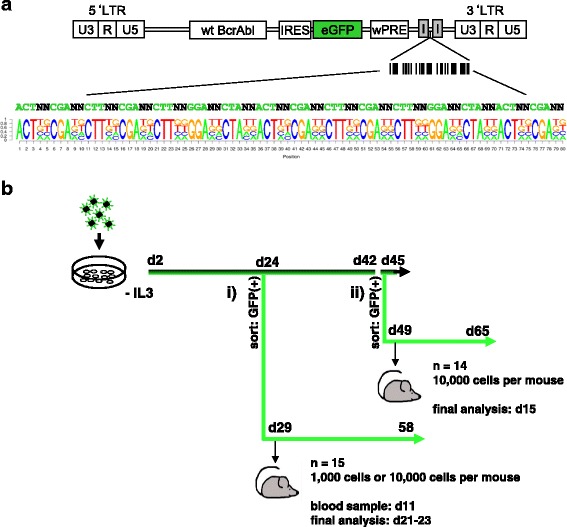
Methods: We studied the dynamics of clonal competition in a BcrAbl-induced leukemia using a γ-retroviral vector library encoding the oncogene in conjunction with genetic barcodes. To this end, we studied the growth dynamics of transduced cells on the clonal level both in vitro and in vivo in transplanted mice.

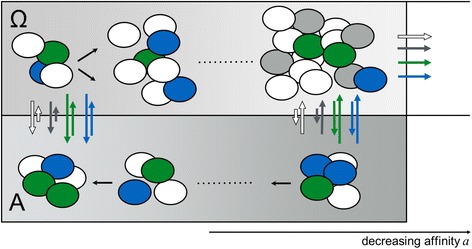
Results: While we detected moderate changes in clonal abundancies in vitro, we observed monoclonal leukemias in 6/30 mice after transplantation, which intriguingly were caused by only two different BcrAbl clones. To analyze the success of these clones, we applied a mathematical model of hematopoietic tissue maintenance, which indicated that a differential engraftment capacity of these two dominant clones provides a possible explanation of our observations. These findings were further supported by additional transplantation experiments and increased BcrAbl transcript levels in both clones.

Conclusion: Our findings show that clonal competition is not an absolute process based on mutations, but highly dependent on selection mechanisms in a given environmental context.

Keywords: BcrAbl; Clonal competition; Clonal dynamics; Genetic barcodes; Heterogeneity; Leukemia; Mathematical modelling.


Figures

Fig. 1
Fig. 1
Vector construction and experimental set-up. a Wildtype BcrAbl (p210) in conjunction with eGFP was cloned into the γ-retroviral vector MP91 [21, 22]. The viral backbone was additionally equipped with a truncated sequence of Illumina Adaptors and our BC32 construct [23]. 1010 plasmids of the obtained plasmid library were used for next-generation sequencing via Miseq (Illumina) and >80,000 different plasmids were obtained. b BcrAbl-barcode containing viral particles were used to transduce the IL-3-dependent murine hematopoietic cell line Ba/F3. After IL-3 withdrawal, the cells were kept in culture and every 2–4 days an aliquot of cells was analysed by FC and used for DNA extraction. Cells were sorted for eGFP on day 24 (i) and on day 45 (ii) (after thawing). eGFP-positive cells were taken and transplanted into non-conditioned female Balb/C mice on day 29 (i) (1000 or 10,000 cells per mouse) and on day 49 (ii) (10,000 cells per mouse)
Fig. 2
Fig. 2
Final Analysis of the 1st mouse experiment. a eGFP expression in different hematopoietic organs (peripheral blood (PB), bone marrow (BM) and spleen (Spl)) at final analysis on day 21 or 23 post transplantation in the six mice which developed leukemia. b Distribution of BcrAbl-containing clones in the graft (d29), in the intermediate blood sample of day 11 post transplantation (d11) and in the hematopoietic organs. Genomic DNA was extracted from samples and used for PCR-amplification of the barcode-containing sequences. Sequencing was performed on a Miseq-Instrument and obtained sequences were analyzed by a customized R-script
Fig. 3
Fig. 3
Final Analysis of the 2nd mouse experiment. Distribution of BcrAbl-containing clones in the hematopoietic organs: peripheral blood (PB), bone marrow (BM) and spleen (Spl). Genomic DNA was extracted from samples and used for PCR-amplification of the barcode-containing sequences. Sequencing was performed on a Miseq-Instrument and obtained sequences were analyzed by a customized R-script. Clone A is marked in green, clone B in blue, respectively
Fig. 4
Fig. 4
BcrAbl transcript levels and differential gene expression. a BcrAbl transcript levels were measured by quantitative real-time PCR (qPCR). BcrAbl transcript levels are increased in samples of clone A and B in comparison to samples of BcrAbl_bulk. b Differential expression among samples of clone A and BcrAbl_bulk; c among samples of clones B and BcrAbl_bulk and d among samples of clones A and B (d). DESeq2-normalized mean expression (x axis; log10 scale) and fold changes (y axis; log2 values) of differentially expressed (red) or unchanged (grey) genes (10% FDR) are indicated
Fig. 5
Fig. 5
Model concept of clonal leukemia. Within the mathematical model normal (white) hematopoietic stem cells compete with leukemic (grey, blue, green) stem cells for niche space (lower, area A, no proliferation) in a stochastic activation/inactivation cycle (repeated changes to the proliferative stage (upper, area Ω). Among the leukemic cells, the green clone (“A”) and the blue clone (“B”) have a higher probability to occupy niche space (indicated by the size of the right vertical arrows) as compared to the other transformed Ba/F3 cells (BcrAbl_bulk indicated by the grey cells) or the host cells (white). The in silico cells are also able to differentiate indicated by the horizontal arrows (top right)
Fig. 6
Fig. 6
Comparison with simulation studies. Frequency of clones is compared between transplantation studies and the corresponding model simulations. a, b Percentages of recipients with no, monoclonal or biclonal leukemia for mouse transplantations with a 1000 and b 10,000 BcrAbl transduced cells at d29. Given the low initial frequency, no leukemic engraftment is shown for the cohort receiving 1000 cells while low numbers of monoclonally derived leukemias are observed in vivo and confirmed in silico for the cohort receiving 10,000 cells. c Composition of biclonal leukemias (consisting of contributions from clone A and B) for the second cohort of transplantation at d45. A corresponding composition is observed for the simulation studies

Similar articles

Cited by

References

    1. Hanahan D, Weinberg RA. Hallmarks of cancer: the next generation. Cell. 2011;144(5):646–674. doi: 10.1016/j.cell.2011.02.013. - DOI - PubMed
    1. Kumar R, Li DQ, Muller S, Knapp S. Epigenomic regulation of oncogenesis by chromatin remodeling. Oncogene. 2016;35(34):4423–4436. doi: 10.1038/onc.2015.513. - DOI - PubMed
    1. Lu C, Thompson CB. Metabolic regulation of epigenetics. Cell Metab. 2012;16(1):9–17. doi: 10.1016/j.cmet.2012.06.001. - DOI - PMC - PubMed
    1. Schepers K, Campbell TB, Passegue E. Normal and leukemic stem cell niches: insights and therapeutic opportunities. Cell Stem Cell. 2015;16(3):254–267. doi: 10.1016/j.stem.2015.02.014. - DOI - PMC - PubMed
    1. Klement GL. Eco-evolution of cancer resistance. Sci Transl Med. 2016;8(327):327fs5. doi: 10.1126/scitranslmed.aaf3802. - DOI - PubMed

Publication types

MeSH terms