. 2017 Oct:125:64-79.
doi: 10.1016/j.neuropharm.2017.07.007. Epub 2017 Jul 11.

Mechanism and properties of positive allosteric modulation of N-methyl-d-aspartate receptors by 6-alkyl 2-naphthoic acid derivatives

Affiliations

Mechanism and properties of positive allosteric modulation of N-methyl-d-aspartate receptors by 6-alkyl 2-naphthoic acid derivatives

Kiran Sapkota et al. Neuropharmacology. 2017 Oct.

Abstract

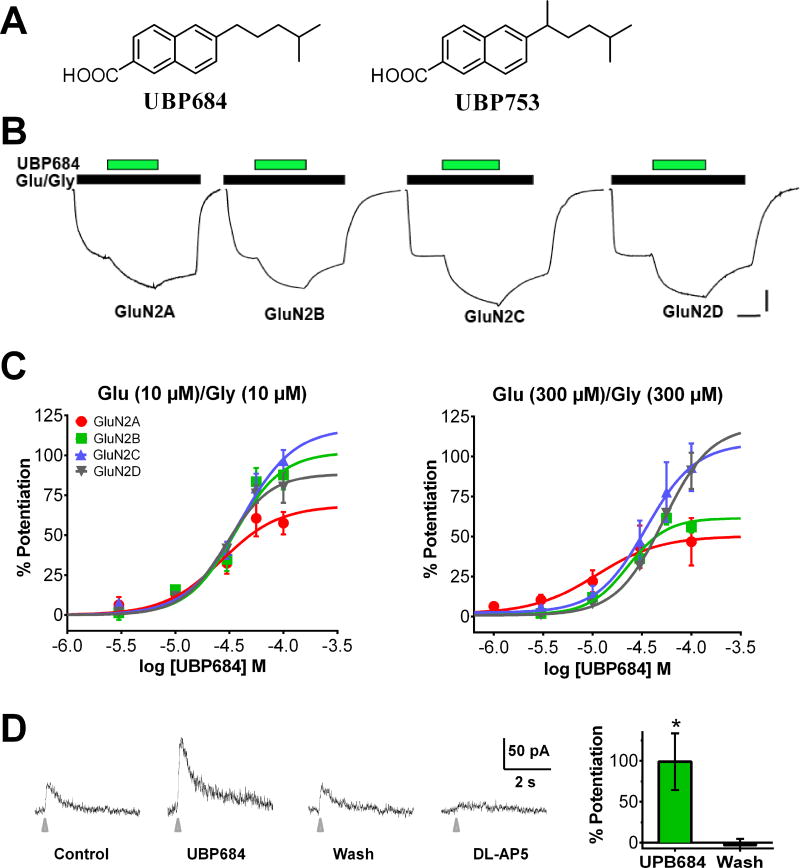
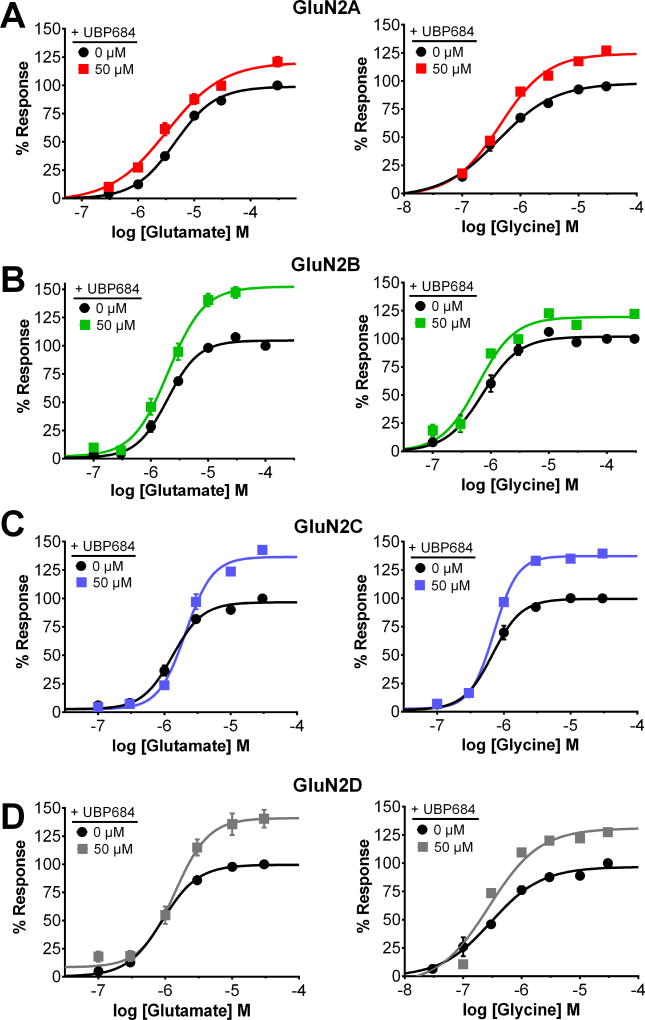
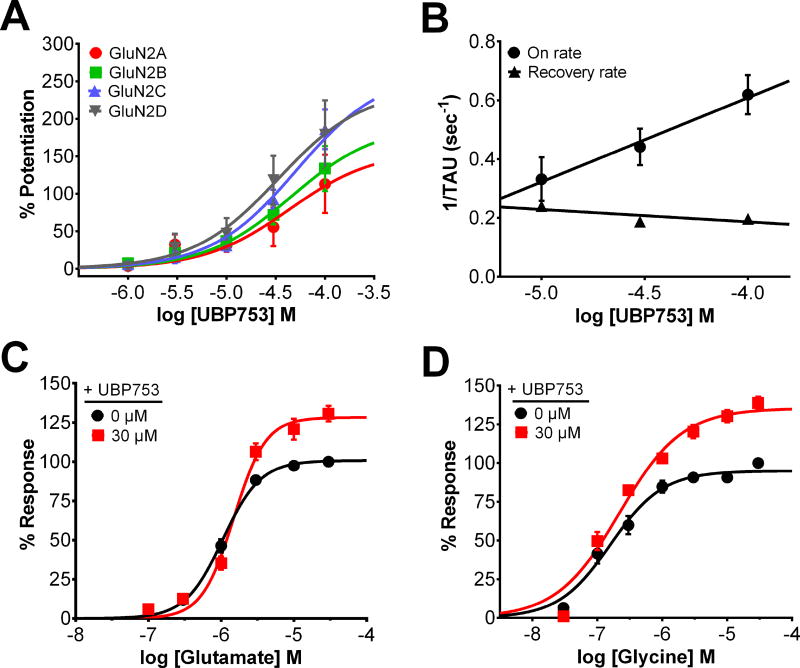
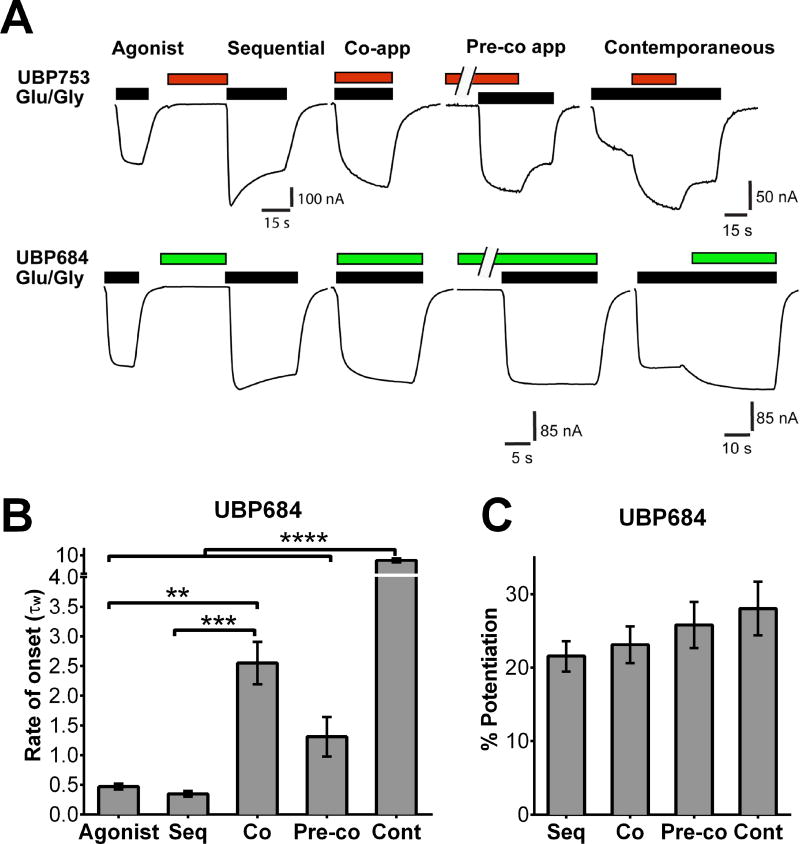
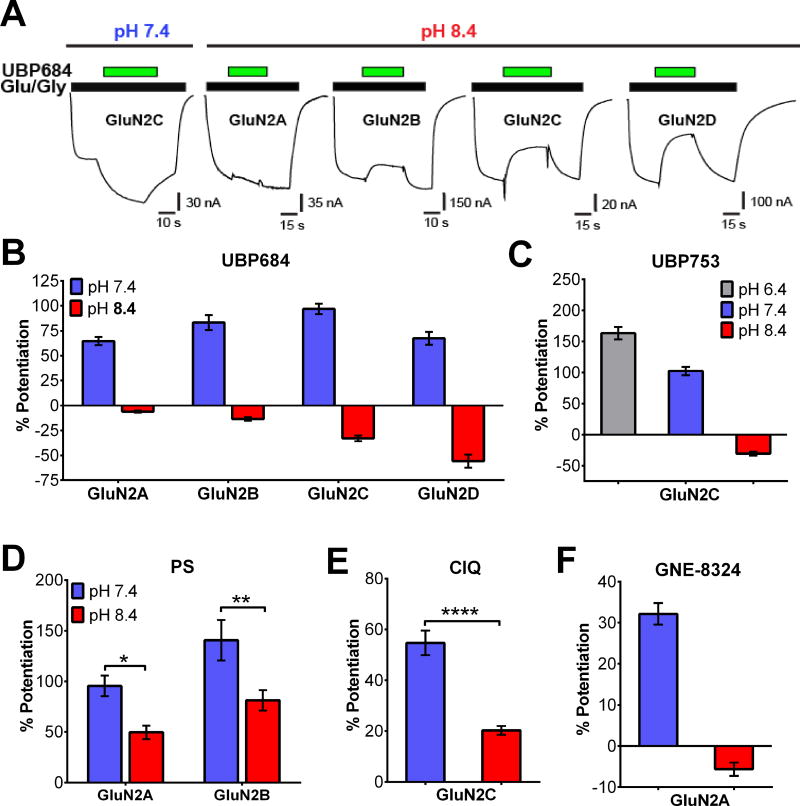
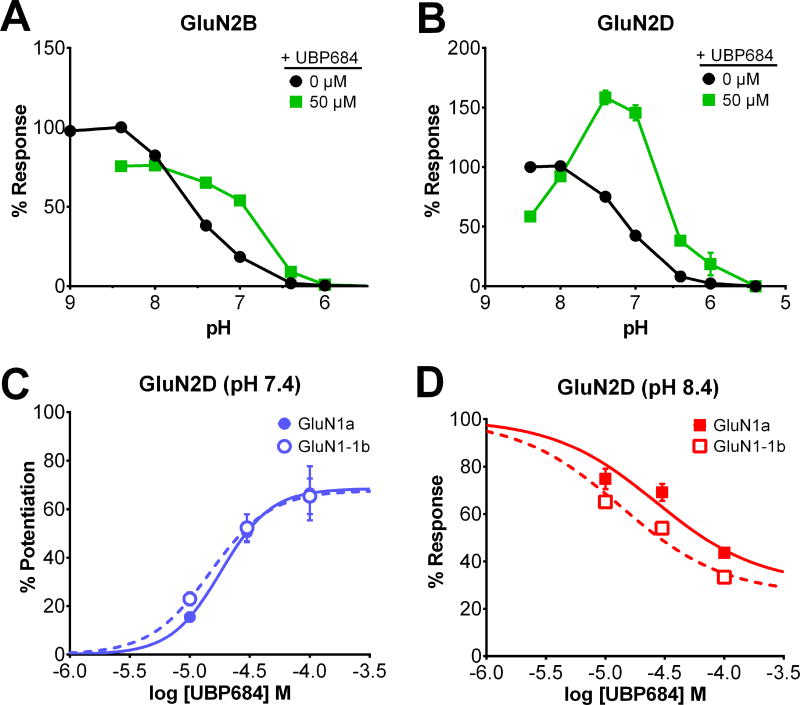
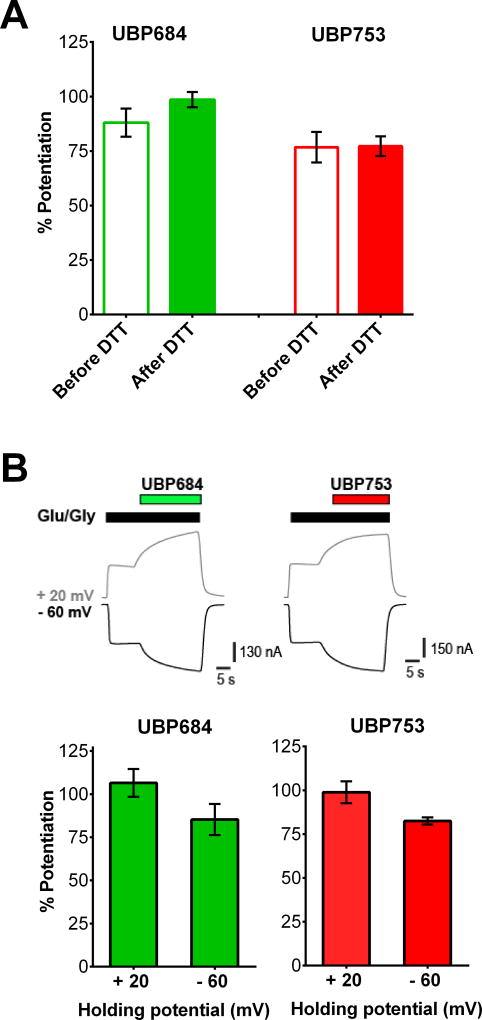
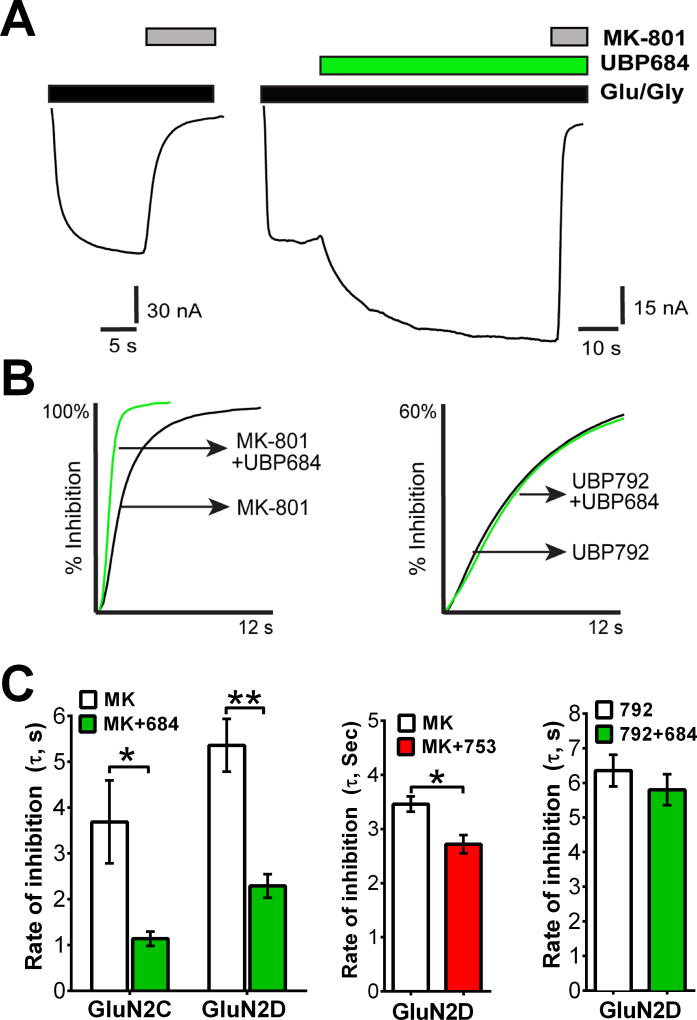
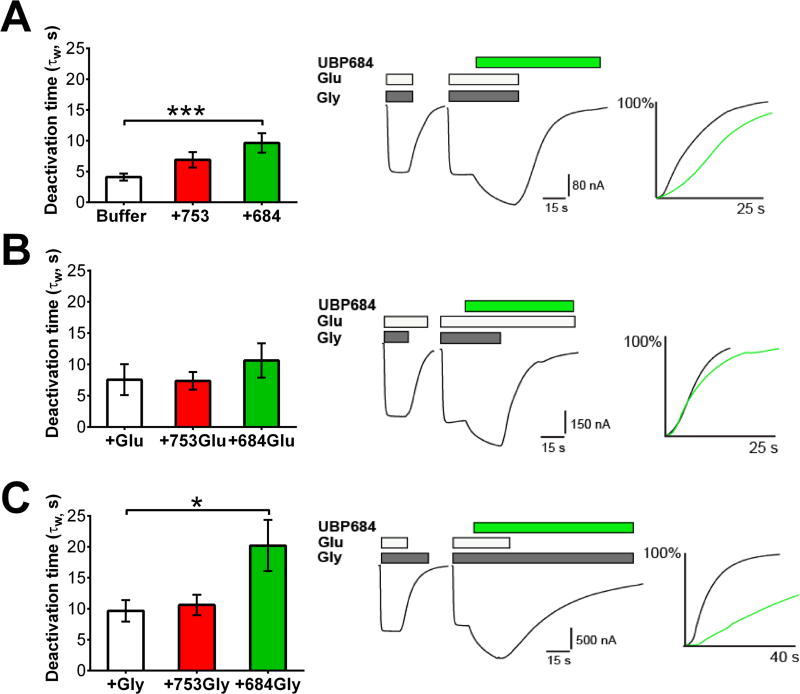
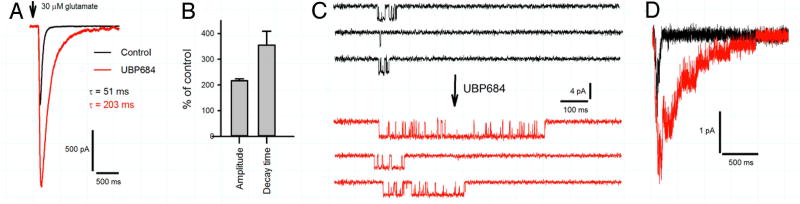
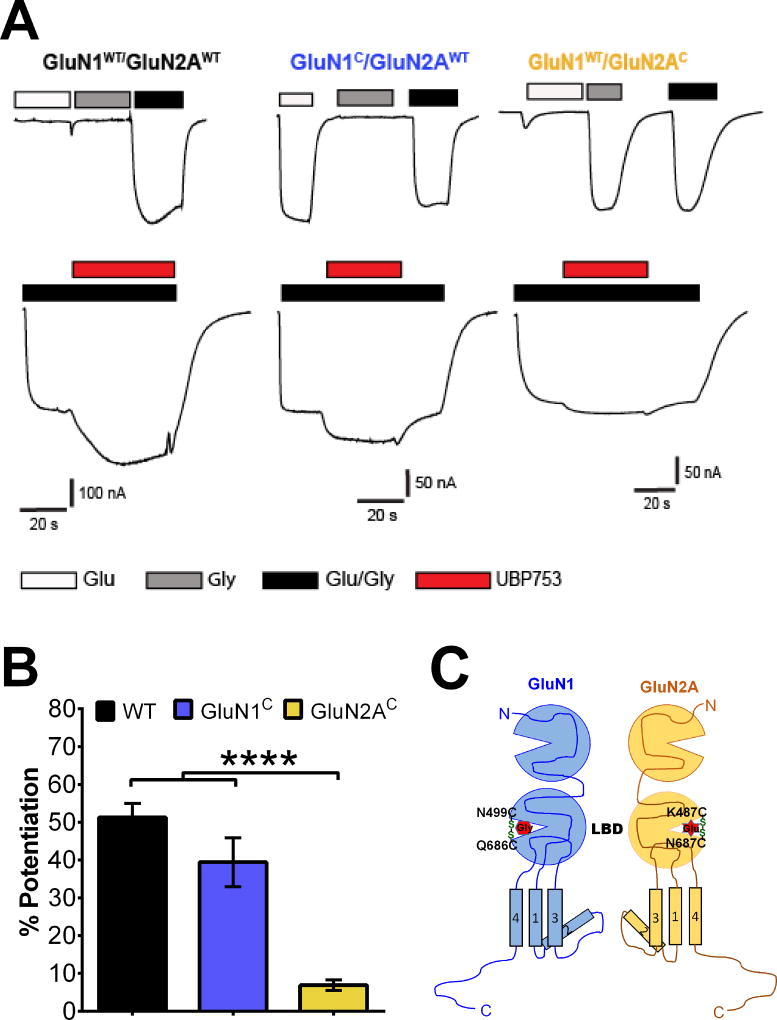
The theory that N-methyl-d-aspartate receptor (NMDAR) hypofunction is responsible for the symptoms of schizophrenia is well supported by many pharmacological and genetic studies. Accordingly, positive allosteric modulators (PAMs) that augment NMDAR signaling may be useful for treating schizophrenia. Previously we have identified several NMDAR PAMs containing a carboxylic acid attached to naphthalene, phenanthrene, or coumarin ring systems. In this study, we describe several functional and mechanistic properties of UBP684, a 2-naphthoic acid derivative, which robustly potentiates agonist responses at each of the four GluN1a/GluN2 receptors and at neuronal NMDARs. UBP684 increases the maximal l-glutamate/glycine response while having minor subunit-specific effects on agonist potency. PAM binding is independent of agonist binding, and PAM activity is independent of membrane voltage, redox state, and the GluN1 exon 5 N-terminal insert. UBP684 activity is, however, markedly pH-dependent, with greater potentiation occurring at lower pHs and inhibitory activity at pH 8.4. UBP684 increases channel open probability (Po) and slows receptor deactivation time upon removal of l-glutamate, but not glycine. The structurally related PAM, UBP753, reproduced most of these findings, but did not prolong agonist removal deactivation time. Studies using cysteine mutants to lock the GluN1 and GluN2 ligand-binding domains (LBDs) in the agonist-bound states indicate that PAM potentiation requires GluN2 LBD conformational flexibility. Together, these findings suggest that UBP684 and UBP753 stabilize the GluN2 LBD in an active conformation and thereby increase Po. Thus, UBP684 and UBP753 may serve as lead compounds for developing agents to enhance NMDAR activity in disorders associated with NMDAR hypofunction.

Keywords: Deactivation; Ligand-binding domain; N-methyl-d-aspartate; Positive allosteric modulator; Potentiator; l-glutamate.


Figures

Figure 1
Figure 1. Potentiation of GluN2A-D and native NMDARs by UBP684
(A) Chemical structures of UBP684 and UBP753. (B) Representative current traces showing UBP684 (100 µM, green bar) enhancement of GluN1a/GluN2A-D receptor-mediated currents evoked by 10 µM L-glutamate and 10 µM glycine (black bar). Scale: X-axis = 17 s, 10 s, 10 s, and 17 s and y-axis = 60 nA, 115 nA, 75 nA and 85 nA for GluN1/GluN2A, GluN1/GluN2B, GluN1/GluN2C, and GluN1/GluN2D traces respectively. (C) Dose-response for UBP684 potentiation of currents evoked by low (left panel) agonist concentrations (10 µM L-glutamate and 10 µM glycine, left panel) and high (right panel) agonist concentrations (300 µM L-glutamate and 300 µM glycine) at NMDARs containing GluN2A (red), GluN2B (green), GluN2C (blue), or GluN2D (gray) subunits. Values represent mean ± SEM % potentiation over the agonist-alone response. N = 5 – 12 oocytes per subunit. (D) Whole-cell recordings of CA1 pyramidal cell NMDAR responses to picospritzer pulse applications of 100 µM NMDA plus 100 µM glycine in the absence (control), presence of 60 µM UBP684 in the bath, or after UBP684 washout. The potentiation by UBP684 (60 µM) of NMDAR currents was reversed upon UBP684 washout (wash) and the NMDAR currents were blocked by 100 µM DL-AP5. Histogram (right) shows the mean ± S.E.M. potentiation relative to the initial agonist peak response for bath applied UBP684 and following washout. * significantly different from 0 % potentiation and from the wash condition (n = 5, p < 0.05).
Figure 2
Figure 2. Effect of UBP684 on L-glutamate and glycine potency and maximal response
Concentration-response for L-glutamate (left panel) and glycine (right panel) excitation of GluN2A- (A), GluN2B- (B), GluN2C- (C) and GluN2D- (D) containing NMDARs in the absence (black) or presence (red, GluN2A; green, GluN2B; blue, GluN2C; and gray, GluN2D) of 50 µM UBP684. In each experiment, the co-agonist (L-glutamate or glycine) was used at 10 µM. The responses from each oocyte were individually normalized with the response obtained from the highest concentration of the agonist-alone application in the same oocyte. Data represent mean ± S.E.M., n = 6 – 19 oocytes.
Figure 3
Figure 3. UBP753 potentiation of NMDAR activity and its effect on agonist affinity
(A) UBP753 concentration-response for the potentiation of NMDAR-mediated current induced by 10 µM of L-glutamate and 10 µM glycine and expressed as % potentiation of agonist-alone induced responses (n = 5–12 oocytes). (B) Single exponential fits the onset (τon) and offset (τoff) for UBP753 potentiation of GluN2D-containing NMDARs at different concentrations of UBP753 were plotted as 1/τ as a function of UBP753 concentration. Rates were determined by single-exponential fit of the onset-rates and offset-rates. As expected, onset was concentration-dependent and off-set was concentration independent. On-rate and off-rate was used to calculate Kd as described in the text. L-glutamate (C) or glycine (D) dose-response in the absence (black) or presence (red) of 30 µM UBP753 at GluN2D-containing NMDARs (n = 6 – 15 oocytes per curve). Co-agonist was present at 10 µM in both C and D. Data represent mean ± S.E.M.
Figure 4
Figure 4. UBP684/753 bind to both agonist-bound and agonist-unbound states of NMDARs
(A) UBP753 (top panel) and UBP684 (bottom panel) potentiation of agonist-evoked GluN1/GluN2B responses in five different drug-application protocols - left to right: agonist alone, sequential, co-application, pre-co application, and cotemporaneous. Drugs were applied as indicated by bars above the responses (black, 10 µM L-glutamate and 10 µM glycine), UBP753 (red, 100 µM) and UBP684 (green, 50 µM). Scale bar: horizontal = time in sec, vertical = current in nA. (B) Average agonist response onset rates (τw, weighted fit) for the different application protocols for UBP684, except for cotemporaneous which represents the onset of UBP684 potentiation. (C) Magnitude of UBP684 potentiation in the different drug application paradigms. Data represent mean ± SEM, **p<0.01, ***p<0.001, ****p<0.0001 (one-way ANOVA followed by Tukey’s multiple comparison test, n = 8 oocytes).
Figure 5
Figure 5. Effect of extracellular pH on the modulation of NMDAR activity by UBP684
(A) Representative current traces showing the effect of extracellular pH (7.4 and 8.4) on UBP684 activity at recombinant GluN1/GluN2A-D receptors. During a steady-state response evoked by 10 µM L-glutamate / 10 µM glycine (black bar), UBP684 (100 µM, green bar) was co-applied with the agonists. UBP684 potentiated NMDAR responses at pH 7.4 (left trace, see also Fig. 1B) and inhibited all responses at pH 8.4 (4 traces on right). (B) Percent response potentiation by UBP684 (100 µM) at the 4 GluN1a/GluN2 receptors at pH 7.4 (blue) and pH 8.4 (red). Values represent mean ± SEM, n = 6 – 9 oocytes. Inhibition is reflected by negative % potentiation values. (C) UBP753 (50 µM) modulation of GluN1a/GluN2C receptors at pH 6.4, 7.4, and 8.4, n = 14 or more oocytes. (D) Pregnenolone sulfate (PS, 100 µM) potentiation of GluN1a/GluN2A and GluN1a/GluN2B receptor responses evoked by 10 µM L-glutamate / 10 µM glycine at pH 7.4 (blue) and pH 8.4 (red), n = 8 oocytes. (E) Effect of pH on potentiation of GluN1a/GluN2C NMDAR responses by 30 µM CIQ, a GluN2C/GluN2D-selective PAM, n = 11 oocytes. (F) Effect of pH on 30 µM GNE-8324 potentiation of GluN1a/GluN2A receptor responses. Inhibition is reflected by negative % potentiation values, n = 15 oocytes. Data represent mean ± SEM, *p<0.05, **p<0.01, ****p<0.0001.
Figure 6
Figure 6. UBP684 interaction with protons and the N-terminal GluN1 insert
Proton inhibition of GluN2B- (A) and GluN2D- (B) containing NMDARs was determined in the absence (black) or presence (green) of 50 µM UBP684. Responses from each oocyte were normalized to the NMDAR response obtained at pH 8.5 in absence of UBP684 from the same oocyte, n = 8 – 12 oocytes. (C) UBP684 potentiation of GluN1a/GluN2D (blue, solid curve) and GluN1b/GluN2D (blue, dotted curve) receptors at pH 7.4. Values represent the % potentiation above the agonist-alone control response, n = 5 – 6 oocytes. (D) UBP684 inhibition of GluN1a/GluN2D (red, solid curve) and GluN1b/GluN2D (red, dotted curve) receptors at pH 8.4, n = 5 – 7 oocytes. Values represent the mean ± SEM % inhibition.
Figure 7
Figure 7. Effect of redox modulation and membrane potential on PAM activity
(A) Average % potentiation by UBP684 (50 µM, green bars) and UBP753 (50 µM, red bars) before (open bars) and after (solid bars) 3 mM DTT treatment of GluN2D-containing NMDARs for 3 min (n = 8 oocytes). (B) Top: represented traces showing the potentiation by UBP684 and UBP753 when membrane potential was held at + 20 mV (gray) or at − 60 mV (black). Bottom: Histogram showing average potentiation by UBP 684 (50 µM, green bars) and UBP753 (50 µM, red bars) at GluN1/GluN2C receptors when the membrane potential was held at + 20 mV or at − 60 mV (n = 4 oocytes). Data represent mean ± SEM.
Figure 8
Figure 8. Effect of UBP684 and UBP753 on the rate of MK-801 channel blockade as a measure of open channel probability
(A) GluN1/GluN2C receptor responses to 10 µM L-glutamate and 10 µM glycine and blocked by co-application of 1 µM MK-801 in the absence (left) or presence (right) of 100 µM UBP684. Drug applications are as indicated by the bars above the traces. Scale bars indicate current (nA) and time (sec). (B) Left: Normalized trace of MK-801 inhibition in the absence (black) and the presence (green) of UBP684. Right: Normalized trace of NMDAR response inhibition by 10 µM UBP792 in the absence (black) and the presence (green) of UBP684. (C) The mean rate of inhibition of GluN1/GluN2C and GluN1/GluN2D responses by MK-801 (left and middle graph) and UBP792 inhibition of GluN1/GluN2D responses (right graph) in the absence (open bars; n = 3 – 6 oocytes) and in the presence (solid bars; n = 4 – 6 oocytes) of 100 µM UBP684 or 50 µM UBP753 as indicated. Data represent mean ± SEM *p<0.05, * p<0.01.
Figure 9
Figure 9. UBP684 slows the deactivation time of NMDARs
(A) Receptor deactivation time was studied by removing agonists (10 µM L-glutamate or 10 µM glycine) after obtaining GluN1-1a/GluN2D steady-state response with /without UBP753 (50 µM) or UBP684 (50 µM). The deactivation time constant was obtained by fitting a two-component exponential function. A representative trace of agonist deactivation in absence or presence of UBP684 is shown in the middle and the superimposed, normalized deactivation trace with (green) and without (black) UBP684 is shown on the right (n = 7 – 15 oocytes per group). Data represent mean ± SEM ***p<0.001 (one-way ANOVA followed by Bonferroni’s multiple comparison test). (B) Deactivation time for glycine removal was studied in presence of L-glutamate and in the presence or absence of UBP684 (green) or UBP753 (red). Traces in the middle show the deactivation kinetics upon glycine removal with (green) and without (black) UBP684. Traces on the right are the corresponding normalized deactivation traces (with UBP684, green; without UBP684, black; n = 5 oocytes per group). Data represent mean ± SEM (C) The deactivation time for L-glutamate removal in the presence of glycine and in presence/absence of UBP 684 or UBP753. The trace in the middle shows the deactivation kinetics following L-glutamate removal and the trace on the right is the normalized trace of the deactivation kinetics (n = 6–7 oocytes per group). Scale bar: horizontal = time in sec, vertical = current in nA. Data represent mean ± SEM, *p<0.05 (one-way ANOVA followed by Bonferroni’s multiple comparison test).
Figure 10
Figure 10. Whole cell and single channel recordings in response to rapid agonist application; effects of UBP684 on responses by GluN1/GluN2A receptors expressed in HEK cells
(A) An NMDAR current evoked by a short pulse of Glu (30 µM) with (red trace) or without (black trace) 30 µM UBP684. (B) Quantification of the effect of UBP684 on peak amplitude and decay time constant (n = 4). (C) Effect on NMDAR single channel currents (representative traces from patch believed to contain only one channel), elicited by a short pulse of Glu. (D) An ensemble current (mean) composed of single channel responses as in C with (red) and without (black) 30 µM UBP684.
Figure 11
Figure 11. Effect of the LBD cleft conformation on potentiation by UBP753
(A) Representative recordings showing the effect of 10 µM L-glutamate (open bar), 10 µM glycine (gray bar), or both agonists (black bar) on wildtype (GluN1/GluN2A), GluN1 LBD-locked (GluN1c/GluN2A) and GluN2A LBD-locked (GluN1/GluN2Ac) NMDARs expressed in Xenopus laevis oocytes and (lower panel) the effect of 100 µM UBP753 (red bar) on agonist responses in the same three receptors as indicated. Scale bar: horizontal = time in sec, vertical = current in nA. (B) Histogram showing the average potentiation by UBP753 of agonist-induced (10 µM L-glutamate and 10 µM glycine) responses from oocytes expressing WT (black, n = 17 oocytes), GluN1 LBD-locked (blue, n = 9 oocytes) and GluN2A LBD-locked (yellow, n = 16 oocytes) receptors. Data represent the mean ± SEM, ****p<0.0001 (one-way ANOVA followed by Tukey’s multiple comparison test). (C) Schematic representing the two cysteine point mutations in the LBD region of GluN1 (N499C and Q686C) leading to the glycine binding site-locked conformation and in the LBD of GluN2A (K487C and N687C) leading to the L-glutamate binding site-locked conformation.

Similar articles

Cited by

References

    1. Bettini E, Sava A, Griffante C, Carignani C, Buson A, Capelli AM, Negri M, Andreetta F, Senar-Sancho SA, Guiral L, Cardullo F. Identification and characterisation of novel NMDA receptor antagonists selective for NR2A- over NR2B-containing receptors. J Pharmacol Exp Ther. 2010;335:636–644. - PubMed
    1. Blanke ML, VanDongen AM. Constitutive activation of the N-methyl-D-aspartate receptor via cleft-spanning disulfide bonds. J Biol Chem. 2008;283:21519–21529. - PMC - PubMed
    1. Bresink I, Benke TA, Collett VJ, Seal AJ, Parsons CG, Henley JM, Collingridge GL. Effects of memantine on recombinant rat NMDA receptors expressed in HEK 293 cells. Br J Pharmacol. 1996;119:195–204. - PMC - PubMed
    1. Buller AL, Larson HC, Schneider BE, Beaton JA, Morrisett RA, Monaghan DT. The molecular basis of NMDA receptor subtypes: native receptor diversity is predicted by subunit composition. J Neurosci. 1994;14:5471–5484. - PMC - PubMed
    1. Ceccon M, Rumbaugh G, Vicini S. Distinct effect of pregnenolone sulfate on NMDA receptor subtypes. Neuropharmacology. 2001;40:491–500. - PubMed

MeSH terms

LinkOut - more resources