. 2017 Jul 18;47(1):118-134.e8.
doi: 10.1016/j.immuni.2017.06.013. Epub 2017 Jul 11.

Human Secretory IgM Emerges from Plasma Cells Clonally Related to Gut Memory B Cells and Targets Highly Diverse Commensals

Affiliations

Human Secretory IgM Emerges from Plasma Cells Clonally Related to Gut Memory B Cells and Targets Highly Diverse Commensals

Giuliana Magri et al. Immunity. .

Abstract

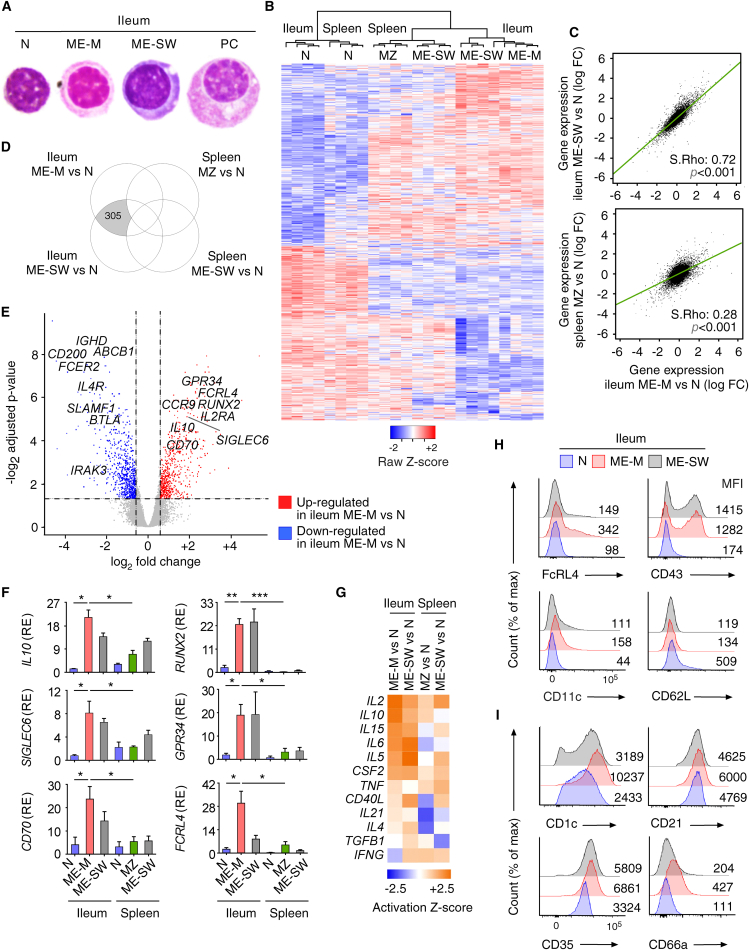
Secretory immunoglobulin A (SIgA) enhances host-microbiota symbiosis, whereas SIgM remains poorly understood. We found that gut IgM+ plasma cells (PCs) were more abundant in humans than mice and clonally related to a large repertoire of memory IgM+ B cells disseminated throughout the intestine but rare in systemic lymphoid organs. In addition to sharing a gut-specific gene signature with memory IgA+ B cells, memory IgM+ B cells were related to some IgA+ clonotypes and switched to IgA in response to T cell-independent or T cell-dependent signals. These signals induced abundant IgM which, together with SIgM from clonally affiliated PCs, recognized mucus-embedded commensals. Bacteria recognized by human SIgM were dually coated by SIgA and showed increased richness and diversity compared to IgA-only-coated or uncoated bacteria. Thus, SIgM may emerge from pre-existing memory rather than newly activated naive IgM+ B cells and could help SIgA to anchor highly diverse commensal communities to mucus.

Keywords: IgA; IgM; gut; human; memory B cells; microbiota; mucosa; plasma cells; repertoire.


Figures

None
Graphical abstract
Figure 1
Figure 1
Human PC-Ms Accumulate in the Gut together with ME-M B Cells and Include a Circulating Counterpart Expressing Gut-Homing Receptors (A) Flow cytometry (FCM) of IgM and IgA on CD19+CD38hiCD10 PCs from human ileum and colon. (B) Frequency of PC-Ms among total PCs, assessed by FCM. (C) FCM of selected surface molecules on naive (N) B cells, PC-Ms, and switched PCs (PC-SW) from human ileum. Numbers indicate mean fluorescence intensity (MFI). (D) Immunofluorescence analysis (IFA) of IgM (green), IgA (red), and DNA (blue) in human ileum and mouse small intestine (SI) lamina propria (LP). Original magnification, 20×. Scale bars, 50 μm. (E) Number of PC-Ms (top), PC-As (center) per mm2 of LP, and PC-M/PC-A ratio (bottom) from human or mouse SI assessed following tissue IFA. Data summarize six different tissue samples where at least four high-power microscopic fields were analyzed. (F and G) Representative FCM (F) and frequency (G) of β7+CCR9+ cells in human circulating PC-Ms, PC-As, and PC-G/Es. (H) Representative FCM showing IgM versus IgD staining on CD19+CD38CD10 B cells from different human tissues. (I) Frequency of ME-M B cells from tissues shown in (H). (J) FCM of IgD, CD24, CD27, and CD148 on naive, ME-M, and ME-SW B cells from ileum. Data show one representative result (A, F, H) of 12 (B), 8 (G), or 52 (I) experiments or are from one experiment of at least 3 with similar results (C, D, J). Results are presented as mean ± SEM; two-tailed unpaired Student’s t test (B and E) and one-way ANOVA with Tukey’s post hoc test (I). p < 0.05, ∗∗p < 0.01, ∗∗∗p < 0.001. See also Figure S1.
Figure 2
Figure 2
Human Gut ME-M B Cells Inhabit Mucosal Follicles, Show Post-GC Traits, Include a Circulating Counterpart Expressing Gut-Homing Receptors, and Emerge Early in Life (A) IFA of IgM (green), IgD (red), and DNA (blue) in human ileum tissue sections. Boxes correspond to enlarged right images. Original magnification, 20× (left) or 60× (right). Scale bars, 50 μm. (B) Number of IgM+IgD ME-M B cells from human intestine calculated by counting cells/mm2 following tissue IFA. Data summarize results from five different tissue samples where at least four microscopic fields were analyzed. (C) FCM of CCR7 and CXCR4 on naive, ME-M, and ME-SW B cells from human ileum and colon. (D) Replication history analyzed by KREC assay. Dashed line corresponds to past cell divisions in control GC B cells from human tonsils. (E and F) Representative FCM (E) and frequency (F) of human circulating β7+CCR9+ B cells. (G) IFA of IgM (green), IgD (red), IgA (magenta), and DNA (blue) in intestinal tissues from children. Boxes correspond to enlarged right images. Original magnification, 10× (top left), 20× (top right), 4× (mid left), 40× (mid right), 10× (bottom left), and 40× (bottom right). Scale bars, 50 μm. Data are from 1 of at least 3 experiments with similar results (A, C, G), summarize 3 experiments (D), or show 1 representative result (E) of 24 experiments (F). Results are presented as mean ± SEM; p < 0.05, ∗∗p < 0.01, ∗∗∗p < 0.001 (two-tailed unpaired Student’s t test). See also Figure S1.
Figure 3
Figure 3
Human Gut ME-M B Cells Are Transcriptionally Distinct from Naive B Cells and Express a Tissue-Specific Memory Gene Signature That Includes Multiple Activation Traits (A) May-Grünwald-Giemsa staining of sorted human intestinal cells. Original magnifications 100×. (B) Dendrogram of unsupervised agglomerative hierarchical cluster analysis and gene expression heatmap diagram displaying genes differentially expressed by naive, ME-M, and ME-SW B cells sorted from human ileum or naive, MZ, and ME-SW B cells from human spleen. (C) Scatterplot depicting robust multi-array average normalized expression. (D) Venn diagram showing transcripts exclusively differentially expressed by ME-M and ME-SW B cells versus naive B cells from human ileum. (E) Volcano plot representation of genes differentially expressed by ME-M B cells versus naive B cells from human ileum. Selected genes are highlighted. (F) qRT-PCR of mRNAs encoding selected genes in B cell population as in (B). (G) Ingenuity’s upstream regulator comparison analysis showing selected upstream regulators among cytokine and growth factors differentially expressed (p value > |log105|). (H and I) FCM of selected surface molecules on naive, ME-M, and ME-SW B cells from human ileum. Data are from one of three experiments with similar results (A, H, I), summarize results from four biological replicates (B–E, G), or summarize three independent experiments from at least three different donors (F). Mean ± SEM; p < 0.05; ∗∗p < 0.01; ∗∗∗p < 0.001 (two-tailed unpaired Student’s t test). See also Figures S2 and S3.
Figure 4
Figure 4
Human Gut ME-M B Cells Express a Post-GC Mutational Profile and Clonally Relate to Gut PC-Ms and Some PC-As (A) Pearson’s correlation coefficient matrix of IGHV gene usage by naive B cells and paired ME-M B cells, ME-A B cells, PC-Ms, and PC-As from human ileum or colon grouped by hierarchical clustering algorithm according to common gene set usage. Circle size and color saturation indicate correlation strength. (B and C) Relative mean frequency of IGHJ6 gene usage and mean number of IGHV gene mutations per 100 bp in gut B cell and PC subsets as in (A). (D) Frequency of Igλ-expressing cells calculated by FCM. (E and F) Circos plots depicting clonal relationships and IGHV gene mutations. (G) Morisita-Horn index showing clonal repertoire overlap between ME-M B cells from human ileum and all other B cell subsets as in (A). (H–J) Lineage tree reconstruction of inferred clonal families (colored circles) and their inferred germline (GL) and intermediate precursors (gray circles). Edges and numbers indicate mutations accumulated along the lineage tree. (K) IFA of ILFs from human ileum stained for AID (green), Ki-67 (red), and DNA (blue). Insets correspond to boxed areas in main images. Original magnification, 20× (top) or 40× (bottom). Scale bars, 50 μm. (L) PCR of switch circle Iα-Cμ transcripts (SCTs) as well as germline Iμ-Cμ, Iα-Cα1, and Iα-Cα2 transcripts (GTs) in naive, ME-M, and IgM+ GC B cells or PC-Ms from human ileum. Data are from 1 representative donor (E, F, H–L) or summarize results from 4 different donors (A–D, G). Error bars, SD; p < 0.05, ∗∗p < 0.01, ∗∗∗p < 0.001 (Welch’s t test and one-way ANOVA with Tukey’s post hoc test). See also Figures S4 and S5.
Figure 5
Figure 5
Human Gut ME-M B Cells Undergo Proliferation, PC Differentiation, IgM Secretion, and IgA Class Switching in Response to TD or TI Signals (A and B) FCM of CFSE dilution profiles (A) and GeoMean (% of max) of CFSE staining (B) in naive (N) and ME-M B cells from human ileum cultured for 5 days as indicated. Ctrl, medium alone. (C) FCM of CFSE and CD38 on naive (top) and ME-M (bottom) B cells from human ileum cultured as in (A) and (B). Numbers indicate percent of newly formed CD38hiCFSElo PCs. (D) FCM of IgM and IgA on CD38hiCFSElo plasmablasts emerging upon stimulation as in (A) and (B). (E) ELISA of IgM and IgA secreted by naive (N) and ME-M B cells from human ileum cultured for 5–7 days as in (A) and (B). (F) FCM of CD38, CD27, IgM, and IgA on sorted FcRL4 (left) or FcRL4+ (right) ME-M B cells from human ileum cultured for 5 days with medium alone (ctrl) or CD40L, IL-21, and IL-10. (G) qRT-PCR analysis of mRNA encoding AID (AICDA) in naive, FcRL4 ME-M, and FcRL4+ ME-M B cells from human ileum. Data represent one representative experiment of two with similar results (A–D, F) or summarize at least three different experiments (E, G). Results are presented as mean ± SEM; p < 0.05, ∗∗p < 0.01, ∗∗∗p < 0.001 (two-tailed unpaired Student’s t test).
Figure 6
Figure 6
Human IgM from Gut ME-M B Cells and SIgM from Gut PC-Ms Target Mucus-Embedded Commensals, Including Bacteria Dually Coated by SIgA (A) Strategy used to test reactivity of IgM secreted by human ME-M B cells and control naive (N) B cells from human ileum. LCL, lymphoblastoid cell line. (B) ELISA measuring reactivity for phosphorylcholine (PCh) and β-glucan of IgM secreted by EBV-transformed naive or ME-M B cells from human ileum. (C) Reactivity of IgM from naive (N) or ME-M B cells to SYTO BC+ mucus-embedded microbiota. (D) Experimental strategy used to measure free and microbiota-bound SIgM and SIgA from human gut mucus. (E) ELISA of free SIgM (blue) and SIgA (red) in mucus samples. (F and G) FCM of SIgA and SIgM bound to viable SYTO BC+ microbiota from human ileum or colon mucus (F) or from small intestine (SI) and large intestine (LI) lumen of wild-type C57BL/6 mice housed under SPF conditions (G). Data summarize at least 3 (B, C, bottom graph), 12 (E), or 20 (F, G, right graphs) experiments in addition to showing results from one representative experiment (C, cytogram and profiles; F, G left cytograms). Two-tailed paired Student’s t test (C, E) and one-way ANOVA with Tukey’s post hoc test (F, G). Results are presented as mean ± SEM; p < 0.05, ∗∗p < 0.01, ∗∗∗p < 0.001. See also Figure S6.
Figure 7
Figure 7
Human Mucus-Embedded Commensals Dually Coated by SIgM and SIgA Show Increased Richness and Diversity Compared to Uncoated or SIgA-Only-Coated Commensals (A) Strategy used to profile mucus-embedded microbiota from human ileum or colon by 16S rRNA gene sequencing following IgM/A sorting. (B and C) Relative abundance of phyla (B) and genera (C) in microbiota fractioned as in (A). Top 15 most abundant genera are depicted. (D) Rarefaction plots depicting phylogenetic richness (left; calculated by PD_whole_tree) and species diversity (right; calculated by Shannon index) of microbiota fractioned as in (A). Mean ± SD. (E) Boxplot distribution of mean relative abundance of phyla from bacteria fractioned as in (A). (F) Heatmap diagram of mean enrichement index (EI) among donors at the OTU level. Hierarchical clustering was used to group fractions and OTUs. OTUs with significantly different EI among fractions are shown in bold. Data are from one sequencing dataset from two different gut segments of one representative donor (B and C) or summarize 10 sequencing datasets from two different gut segments of 5 donors (D–F). p < 0.05, ∗∗p < 0.01, ∗∗∗p < 0.001 (Welch’s t test). See also Figure S7.

References

    1. Agarwal S., Mayer L. Pathogenesis and treatment of gastrointestinal disease in antibody deficiency syndromes. J. Allergy Clin. Immunol. 2009;124:658–664. - PMC - PubMed
    1. Aranburu A., Piano Mortari E., Baban A., Giorda E., Cascioli S., Marcellini V., Scarsella M., Ceccarelli S., Corbelli S., Cantarutti N. Human B-cell memory is shaped by age- and tissue-specific T-independent and GC-dependent events. Eur. J. Immunol. 2017;47:327–344. - PubMed
    1. Arpaia N., Campbell C., Fan X., Dikiy S., van der Veeken J., deRoos P., Liu H., Cross J.R., Pfeffer K., Coffer P.J., Rudensky A.Y. Metabolites produced by commensal bacteria promote peripheral regulatory T-cell generation. Nature. 2013;504:451–455. - PMC - PubMed
    1. Barak M., Zuckerman N.S., Edelman H., Unger R., Mehr R. IgTree: creating Immunoglobulin variable region gene lineage trees. J. Immunol. Methods. 2008;338:67–74. - PubMed
    1. Bemark M., Hazanov H., Strömberg A., Komban R., Holmqvist J., Köster S., Mattsson J., Sikora P., Mehr R., Lycke N.Y. Limited clonal relatedness between gut IgA plasma cells and memory B cells after oral immunization. Nat. Commun. 2016;7:12698. - PMC - PubMed

Publication types

MeSH terms