. 2017 Jul 18;47(1):107-117.e8.
doi: 10.1016/j.immuni.2017.06.015. Epub 2017 Jul 11.

Identification of Natural Regulatory T Cell Epitopes Reveals Convergence on a Dominant Autoantigen

Affiliations

Identification of Natural Regulatory T Cell Epitopes Reveals Convergence on a Dominant Autoantigen

John D Leonard et al. Immunity. .

Abstract

Regulatory T (Treg) cells expressing the transcription factor Foxp3 are critical for the prevention of autoimmunity and the suppression of anti-tumor immunity. The major self-antigens recognized by Treg cells remain undefined, representing a substantial barrier to the understanding of immune regulation. Here, we have identified natural Treg cell ligands in mice. We found that two recurrent Treg cell clones, one prevalent in prostate tumors and the other associated with prostatic autoimmune lesions, recognized distinct non-overlapping MHC-class-II-restricted peptides derived from the same prostate-specific protein. Notably, this protein is frequently targeted by autoantibodies in experimental models of prostatic autoimmunity. On the basis of these findings, we propose a model in which Treg cell responses at peripheral sites converge on those self-proteins that are most susceptible to autoimmune attack, and we suggest that this link could be exploited as a generalizable strategy for identifying the Treg cell antigens relevant to human autoimmunity.

Keywords: Aire; autoantibodies; autoantigens; autoimmune regulator; autoimmunity; immune tolerance; prostate cancer; regulatory T cells.


Figures

Figure 1
Figure 1
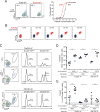
MJ23 T cells recognize an antigen derived from the prostatic protein Tcaf3. CD4+ T cells were isolated from MJ23tg Rag1−/− CD45.1/.1 or OT-IItg Rag1−/− CD45.1/.1 mice, labeled with CellTrace-Violet (CTV), and used as a probe for antigen. (a) In vitro stimulation of MJ23tg T cells by prostatic secretory extracts. 1 × 10⁴ MJ23tg T cells were cultured with 5 × 10⁴ CD11c+ cells from B6 spleen, plus secretory extracts prepared from the anterior, dorsolateral, or ventral prostate lobes of tumor-bearing TRAMP males, with or without anti-MHC-II blocking antibody. Dilution of CTV was assessed by flow cytometry on day 5. (b) In vitro stimulation of MJ23tg T cells by Tcaf3 protein. As in (a), MJ23tg or OT-IItg T cells were stimulated in vitro with 2 µg/mL recombinant Tcaf3 protein or 1 µM Ova323–339 peptide, and assayed on day 5. (c) In vivo stimulation of MJ23tg T cells by Tcaf3 protein. 1 × 10⁵ MJ23tg T cells were transferred i.v. into congenically disparate B6 female hosts. 2 hours after transfer, recipients were immunized with 5 µg Tcaf3 protein, 5 µg Tgm4 protein, or PBS alone. CD4+ T cells from the spleen (left panel) and pooled skin-draining lymph nodes (right panel) were analyzed for CTV dilution on day 5. (d) In vitro stimulation of MJ23tg T cells by Tcaf3 peptide. As in (a), MJ23tg or OT-IItg T cells were stimulated in vitro with 5 nM Tcaf3646–658 peptide, with or without anti-MHC-II Ab or isotype control. Dilution of CTV was analyzed on day 3. (e) Tcaf3646–658 peptide truncation analysis. As in (a), MJ23tg T cells were stimulated in vitro with 33 nM Tcaf3646–658 peptide variants, comprising serial truncations from the N- and/or C-termini. Dilution of CTV was analyzed on day 3. The core nonamer epitope predicted computationally is denoted by red shading. Percent of cells proliferated is shown as the mean ± SEM of three replicates. (f) Tcaf3646–658 peptide is required for the thymic development of MJ23tg Treg cells. Bulk thymocytes from MJ23tg Rag1−/− CD45.1/.1 females were transferred into 4-6-week-old Tcaf3+/+, Tcaf3+/tm1, or Tcaf3tm1/tm1 hosts, both male and female, and analyzed at day 7 for expression of CD25 and Foxp3. Left panels, representative flow cytometric analysis of Foxp3 and CD25 expression on MJ23tg and polyclonal thymocytes for recipients of the indicated genotype. Right panel, summary plot of data for MJ23tg thymocyte transfer into Tcaf3tm1/tm1 or Tcaf3+ (Tcaf3+/+ and Tcaf3+/tm1) recipients. Significance testing was performed using the Student’s t-test. ** indicates p < 0.01. (g) Tcaf3-specific autoantibodies can be detected in the serum of Aire−/−males. Recombinant Tcaf3 protein was resolved by SDS-PAGE, and subjected to Western blotting using serum from Aire-deficient (Aire−/−) or Aire+ (Aire+/+ or Aire+/−) littermates of the indicated ages. Data are representative of multiple independent experiments: (a) N = 4, (b) N = 3, (c) N = 3, (d) N = 5, (e) N = 3, (f) N = 2, (g) N = 3. See also Figure S1.
Figure 2
Figure 2
Analysis of Tcaf3-specific MJ23tg T cells using pMHC-II tetramers bearing a Tcaf3646–658 variant. (a) Potency of wild-type and variant Tcaf3 peptides. MJ23tg T cells were stimulated in vitro as in Figure 1 with wild-type Tcaf3646–658 peptide (Tcaf3-WT) or Tcaf3646–658 harboring a serine to tyrosine mutation at residue 648 (Tcaf3-648Y). Left, representative flow cytometry plots of in vitro cultures with 4 nM peptide, analyzed at day 3. Right, dose response curves fit to a cooperative model. Points denote the mean ± SEM of three replicates. (b) Staining of MJ23tg T cells by Tcaf3/I-Ab tetramers. MJ23tg Rag1−/− CD45.1/.1 T cells (red) were spiked into polyclonal CD45.2/.2 B6 splenocytes (blue) and co-stained with PE- and APC-labeled tetramers of I-Ab bearing the Tcaf3-648Y peptide (Tcaf3/I-Ab tetramers) at the indicated concentrations. (c–e). Expansion of endogenous Tcaf3-specific Treg cells by immunization with Tcaf3 peptide plus CFA. B6 (Aire+) or Aire−/− male mice were immunized with CFA only, Tcaf3646–658 peptide in CFA, or 2W1S peptide in CFA, as indicated. 14 days post-challenge, lymphocytes from the pooled spleen and lymph nodes were co-stained with PE- and APC-labeled Tcaf3/I-Ab tetramers or 2W1S/I-Ab tetramers, as indicated, and tetramer-binding cells were magnetically enriched. (c) Representative flow cytometric analysis of Foxp3 expression by magnetically enriched CD4+ T cells. Plots in the left column depict tetramer-PE vs. tetramer-APC staining, with double-tetramerneg and double-tetramer+ gates shown. The middle and right columns present histograms of Foxp3 expression by cells within the double-tetramerneg and double-tetramer+ gates, respectively. (d–e) Summary plots of the tetramer analysis in (c), depicting the total number of double-tetramer+ cells that express Foxp3 (d), and the percentage of double-tetramer+ T cells (e). Data are representative of multiple independent experiments: (a) N = 5, (b) N = 5, (c–e) N = 2. The mean ± SEM is indicated. Significance testing was performed using the nonparametric Mann-Whitney test. * indicates p < 0.05.
Figure 3
Figure 3
Detection of polyclonal Tcaf3/I-Ab-specific T cells in prostate tumors and prostatic autoimmune lesions. Tcaf3/I-Ab tetramer analysis of T cells from the prostates of tumor-bearing TRAMP males (a–b), Aire+/+males (c–d) and Aire−/− males (e–f). (a) Representative flow cytometric analysis of CD4+ T cells isolated from the dorsolateral lobe of prostate tumors from 6-7-month old TRAMP+/+ males, stained with Tcaf3/I-Ab or negative control 2W1S/I-Ab tetramers. Numbers indicate percentage of cells co-stained with PE- and APC-labeled tetramers (oval gates). (b) Summary plots of tetramer analysis in (a) for N = 12 mice. The mean ± SEM is shown. (c) Representative flow cytometric analysis of tetramer staining, as in (a), of CD4+ cells isolated from the prostates of 7-8-month-old Aire+/+ males. (d) Summary plots of analysis in (c). (e) Representative flow cytometric analysis of tetramer staining of CD4+ cells isolated from the prostates of 7-8-month-old Aire−/− males. (f) Summary plots of analysis in (e). (g) Representative analysis of Tcaf3/I-Ab tetramer-PE vs. Foxp3 staining of CD4+ T cells from the prostates of TRAMP vs. Aire−/− mice. (h) Summary plot of the proportion of Tcaf3/I-Ab double tetramer+ cells (oval gates in (a) and (e)) that express Foxp3. Data are representative of multiple independent experiments: (a–b) N = 2, (c–d) N = 2, (e–f) N = 2. Tetramer analyses were performed with 12.5 nM (Aire−/− and Aire+/+) or 20 nM (TRAMP) of each tetramer. Significance testing was performed using the nonparametric Mann-Whitney test. ** indicates p < 0.001; *** indicates p < 0.0001; n.s., not significant.
Figure 4
Figure 4
SP33 T cells recognize a distinct epitope derived from the prostatic protein Tcaf3. CD4+ T cells were sorted from SP33rg or OT-IItg Rag1−/− CD45.1/.1 mice, labeled with CellTrace-Violet (CTV), and used as a probe for antigen. (a) In vitro stimulation of SP33rg T cells by prostatic secretory extracts. 1 × 10⁴ SP33rg T cells were cultured with 5 × 10⁴ CD11c+ cells from B6.SJL spleen, plus secretory extracts prepared from the anterior, dorsolateral, or ventral prostate lobes of tumor-bearing TRAMP males with or without anti-MHC-II blocking antibody. Dilution of CTV was assessed by flow cytometry on day 5. (b) In vitro stimulation of SP33rg T cells by Tcaf3 protein. As in (a), SP33rg or OT-IItg T cells were stimulated in vitro with 2 µg/mL recombinant Tcaf3 protein or 1 µM Ova323–339 peptide, and assayed on day 3. (c) In vivo stimulation of SP33rg T cells by Tcaf3 protein. 6.6 × 10⁴ MJ23tg T cells were transferred i.v. into congenically disparate B6.SJL female hosts. 2 hours after transfer, recipients were immunized with 5 µg Tcaf3 protein, 5 µg Tgm4 protein, or PBS alone. CD4+ T cells from the spleen (left panel) and pooled skin-draining lymph nodes (right panel) were analyzed for CTV dilution on day 5. (d) In vitro stimulation of SP33rg T cells by Tcaf388–107 peptide. As in (a), SP33rg or OT-IItg T cells were stimulated in vitro with 5 nM Tcaf388–107 peptide, with or without anti-MHC-II Ab or isotype control, and 5 nM Tcaf3646–658 peptide. Dilution of CTV was analyzed on day 3. (e) Tcaf388–107 peptide truncation analysis. As in (a), SP33rg T cells were stimulated in vitro with 33 nM Tcaf388–107 peptide variants, comprising truncations from the N- and/or C-termini. Dilution of CTV was analyzed on day 3. The core nonamer epitope predicted computationally is denoted by red shading. Percent of cells proliferated is shown as the mean ± SEM of three replicates. Data are representative of multiple independent experiments: (a) N = 3, (b) N = 3, (c) N = 3, (d) N = 3, (e), N = 3. Significance testing was performed using the nonparametric Mann-Whitney test. * indicates p < 0.05. See also Figure S1.

Similar articles

Cited by

References

    1. Anderson MS, Venanzi ES, Klein L, Chen Z, Berzins SP, Turley SJ, von Boehmer H, Bronson R, Dierich A, Benoist C, Mathis D. Projection of an immunological self shadow within the thymus by the aire protein. Science. 2002;298:1395–1401. - PubMed
    1. Barnden MJ, Allison J, Heath WR, Carbone FR. Defective TCR expression in transgenic mice constructed using cDNA-based alpha- and beta-chain genes under the control of heterologous regulatory elements. Immunol Cell Biol. 1998;76:34–40. - PubMed
    1. Bautista JL, Lio CW, Lathrop SK, Forbush K, Liang Y, Luo J, Rudensky AY, Hsieh CS. Intraclonal competition limits the fate determination of regulatory T cells in the thymus. Nat Immunol. 2009;10:610–617. - PMC - PubMed
    1. Burzyn D, Kuswanto W, Kolodin D, Shadrach JL, Cerletti M, Jang Y, Sefik E, Tan TG, Wagers AJ, Benoist C, Mathis D. A special population of regulatory T cells potentiates muscle repair. Cell. 2013;155:1282–1295. - PMC - PubMed
    1. Chen J, Qian H, Horai R, Chan CC, Caspi RR. Mouse Models of Experimental Autoimmune Uveitis: Comparative Analysis of Adjuvant-Induced vs Spontaneous Models of Uveitis. Curr Mol Med. 2015;15:550–557. - PMC - PubMed

Publication types