. 2017 Oct:183:46-53.
doi: 10.1016/j.clim.2017.07.004. Epub 2017 Jul 12.

The ratio of circulating follicular T helper cell to follicular T regulatory cell is correlated with disease activity in systemic lupus erythematosus

Affiliations

The ratio of circulating follicular T helper cell to follicular T regulatory cell is correlated with disease activity in systemic lupus erythematosus

Bihua Xu et al. Clin Immunol. 2017 Oct.

Abstract

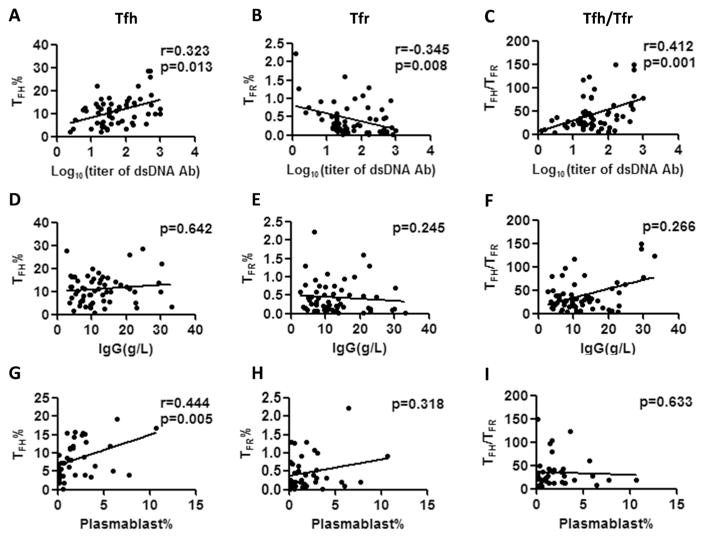
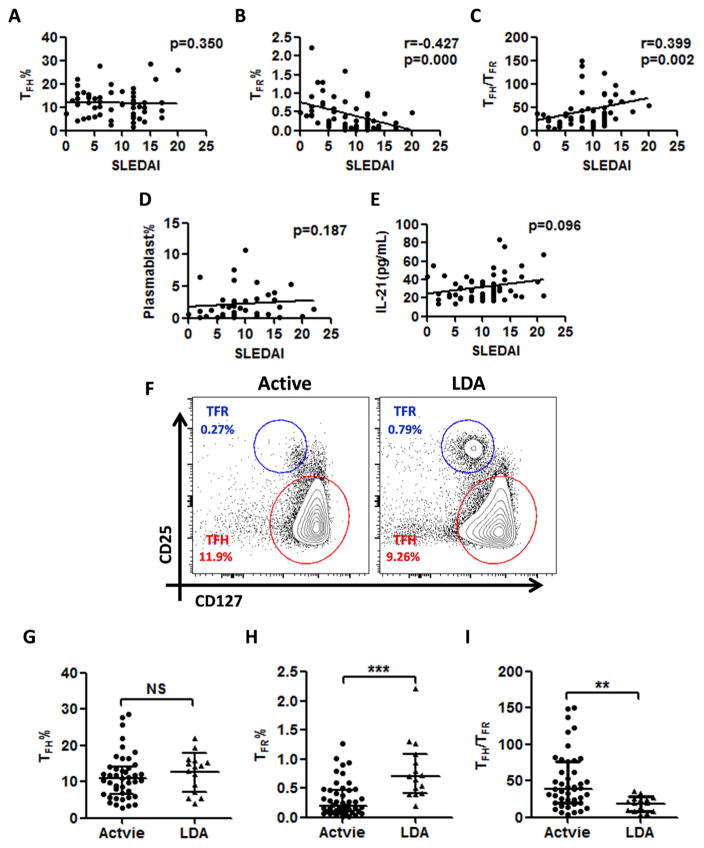
Follicular T regulatory (Tfr) cells inhibit follicular T helper (Tfh) cells mediated B cell responses. Tfh cells are involved in the pathogenesis of systemic lupus erythematosus (SLE). However, the role of Tfr cells in SLE remains unclear. The frequency of circulating Tfr and Tfh cells were examined in SLE patients and healthy controls. The frequency of circulating Tfr cell decreased and Tfh/Tfr ratio increased in SLE patients. Serum anti-dsDNA antibody level positively correlated with frequency of Tfh cells and Tfh/Tfr ratios but negatively correlated with the frequency of Tfr cells. Moreover, the frequency of Tfr and Tfh/Tfr ratio but not that of Tfh was correlated with diseases activity. In addition, increase in Tfr cell numbers and decrease in the Tfh/Tfr ratios were observed with successful treatments. Thus, Tfr cells should be considered as a biomarker for SLE and their role in the pathogenesis of SLE warrants further investigation.

Keywords: Biomarker; SLE; Tfh; Tfr.


Conflict of interest statement

Competing interests

All the authors have no interests to declare.

Figures

Fig. 1
Fig. 1
Circulating Tfr cells are decreased in the blood of patients with SLE compared to healthy controls. A, Gating strategy to identify circulating Tfh (CD4+CD25CD127intermediate-high CXCR5+) and Tfr (CD4+CD25+CD127low-intermediate CXCR5+) cells within the CD4+CXCR5+ T cells in human blood. B, MFI of Foxp3 expression on Tfh and Tfr cells respectively (n = 15). C, Contour plots of CD25 and CD127 expression on CD4+CXCR5+ T cells from a representative healthy control (left panel) and an SLE patient (right panel). D and E, Percentage of circulating Tfh (CD4+CD25CD127intermediate-high CXCR5+) cells and Tfr (CD4+CD25+ CD127low-intermediate CXCR5+) cells among CD4+ T cells in patients with SLE (n = 58) and healthy controls (n = 24). F, The Tfh/Tfr ratio in SLE patients and HCs. Data are represented as mean ± SD or median ± interquartile range. Data points represent individual subjects. NS = not significant, **p < 0.01, ***p < 0.001.
Fig. 2
Fig. 2
Correlation between the percentage of Tfh and Tfr cells with serum anti-dsDNA antibody and IgG level in SLE patients. A–C, Correlation between the serum anti-dsDNA antibody with the percentage of Tfh cells, Tfr cells and the Tfh/Tfr ratio, respectively (n = 58). D–F, Correlation between the titer of serum IgG level with the percentage of Tfh cells, Tfr cells and Tfh/Tfr ratio, respectively (n = 58). G–I, Correlation between the percentage of plasmablasts with the percentage of Tfh cells, Tfr cells and Tfh/Tfr ratio, respectively (n = 39). Data points represent individual subjects. *p < 0.05, **p < 0.01.
Fig. 3
Fig. 3
PD-1 and ICOS expression on Tfr and Tfh cells in SLE patients and controls. A, Gates for the expression of PD-1 and ICOS were set using isotype staining of PD-1 and ICOS on Tfh and Tfr cells from SLE patient (left panel). Contour plots of ICOS and PD-1 expression on Tfh cell and Tfr cell from a representative healthy control (middle panel) and a SLE patient (right panel). B and C, The percentage of PD-1highICOShigh cell among CD4+CXCR5+cells in patients with SLE and healthy controls. D, Flow-cytometric histograms of PD-1 and ICOS expressions of Tfh and Tfr cells from a representative healthy control (black line) and a SLE patient (red line), respectively. E and F, MFI of PD-1 (E) and ICOS (F) on Tfh cell in SLE patients (n = 58) and healthy controls (n = 24). G and H, MFI of PD-1 (G) and ICOS (H) on Tfr cell in SLE patients (n = 58) and healthy controls (n = 24). I, Flow-cytometric histograms of Ki-67 expression on Tfh cell and Tfr cell from a representative healthy control (black line) and a SLE patient (red line). J and K, Percentage of Ki-67+ Tfh cell (J) and Tfr cell (K) in SLE patients (n = 38) and healthy controls (n = 17), respectively. Data are represented as mean ± SD or median ± interquartile range. Data points represent individual subjects. NS = not significant, *p < 0.05, **p < 0.01.
Fig. 4
Fig. 4
Correlation of plasma IL-21 with Tfh and Tfr cells in SLE patients. A, The IL-21 level was measured in plasma from healthy controls (n = 24) and SLE patients (n = 58). B and C, Correlation of plasma IL-21 level with the percentage of Tfh and Tfr cells in SLE patients (n = 58). D, Correlation of plasma IL-21 level with the Tfh/Tfr ratio in SLE patients (n = 58). Data are represented as mean ± SD. Data points represent individual subjects. **p < 0.01, ***p < 0.001.
Fig. 5
Fig. 5
Correlation of SLEDAI with Tfh cells, Tfr cells, plasmablasts and plasma IL-21 level in SLE patients. A and B, Correlation of SLEDAI with the percentage of Tfh and Tfr cells in SLE patients (n = 58). C, The correlation between SLEDAI and Tfh/Tfr ratio (n = 58). D, Correlation between SLEDAI and percentage of circulating plasmablasts (n = 39). E, The correlation between SLEDAI and the plasma IL-21 level (n = 58). F, Contour plots of CD25 and CD127 expression on CD4+CXCR5+ T cells from a representative active (left panel) and a LDA (right panel) patient. G and H, Percentage of Tfh (CD4+CD25CD127intermediate-high CXCR5+) cells and Tfr (CD4+CD25+CD127low-intermediate CXCR5+) cells among CD4+ T cells in active (n = 43) and LDA (n = 15) patients. I, The Tfh/Tfr ratio in active (n = 43) and LDA (n = 15) patients. Data are represented as mean ± SD or median ± interquartile range. Data points represent individual subjects. NS = not significant, **p < 0.01, ***p < 0.001.
Fig. 6
Fig. 6
Circulating Tfr cells were increased after treatment. A, Contour plots of CD25 and CD127 expression on CD4+CXCR5+ T cells from a representative active SLE patient before (left panel) and after (right panel) 4 weeks of treatment. B and C, Percentage of Tfh (CD4+CD25CD127intermediate-high CXCR5+) cells and Tfr (CD4+CD25+CD127low-intermediate CXCR5+) cells among CD4+ T cells before and after treatment (n = 13). D, The Tfh/Tfr ratio in SLE patients before and after treatment (n = 13). Data points represent individual subjects. NS = not significant, **p < 0.01, ***p < 0.001.

References

    1. Comte D, Karampetsou MP, Tsokos GC. T cells as a therapeutic target in SLE. Lupus. 2015;24(4–5):351–363. - PMC - PubMed
    1. Blanco P, Ueno H, Schmitt N. T follicular helper (Tfh) cells in lupus: activation and involvement in SLE pathogenesis. Eur J Immunol. 2016;46(2):281–290. - PubMed
    1. D’Cruz DP, Khamashta MA, Hughes GR. Systemic lupus erythematosus. Lancet. 2007;369(9561):587–596. - PubMed
    1. Tsokos GC. Systemic lupus erythematosus. N Engl J Med. 2011;365(22):2110–2121. - PubMed
    1. Craft JE. Follicular helper T cells in immunity and systemic autoimmunity. Nat Rev Rheumatol. 2012;8(6):337–347. - PMC - PubMed

Publication types

MeSH terms