. 2017 Oct 1;313(4):H810-H827.
doi: 10.1152/ajpheart.00181.2017. Epub 2017 Jul 14.

Gq-activated fibroblasts induce cardiomyocyte action potential prolongation and automaticity in a three-dimensional microtissue environment

Affiliations

Gq-activated fibroblasts induce cardiomyocyte action potential prolongation and automaticity in a three-dimensional microtissue environment

C M Kofron et al. Am J Physiol Heart Circ Physiol. .

Abstract

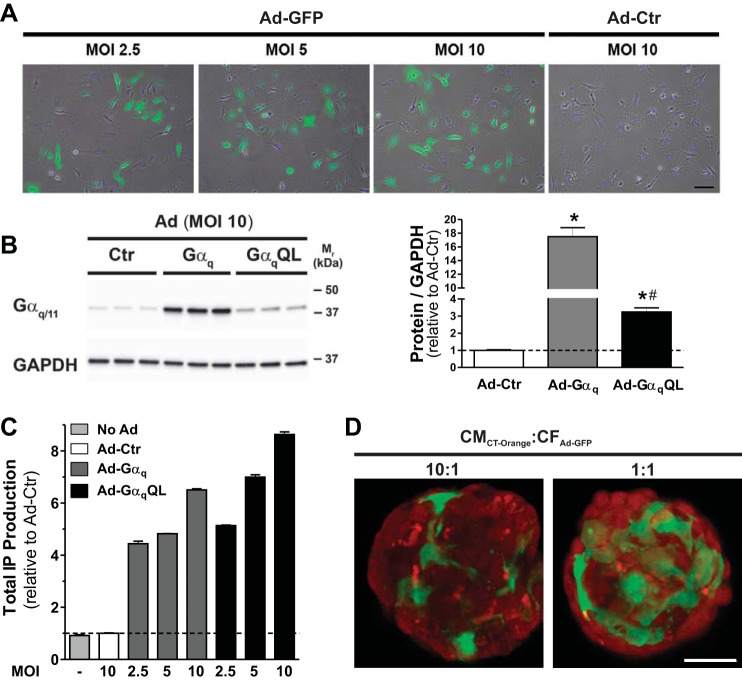
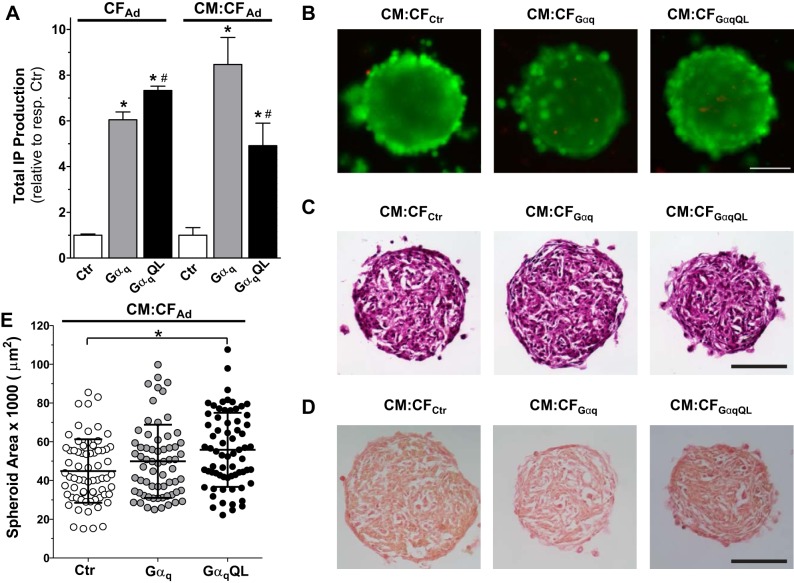
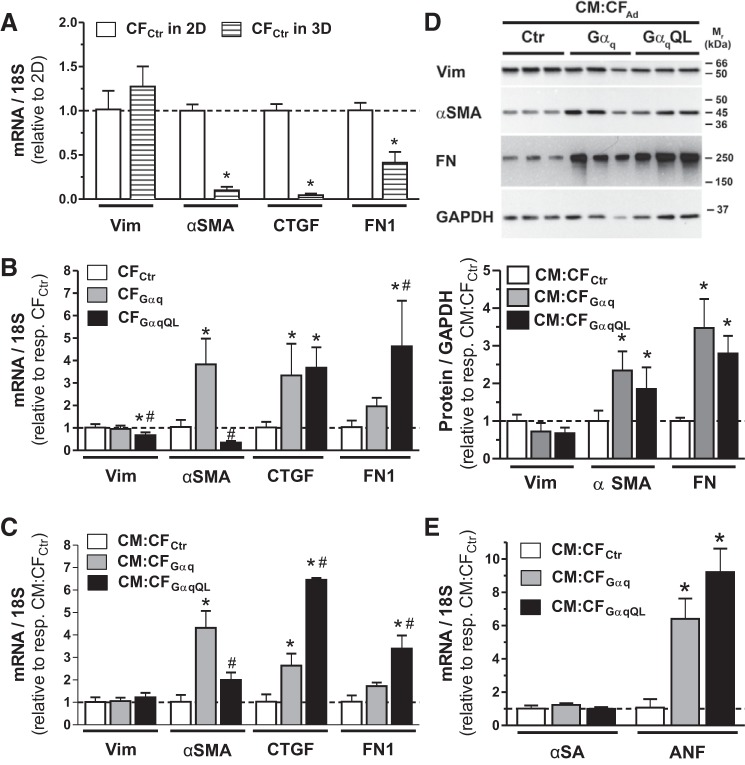
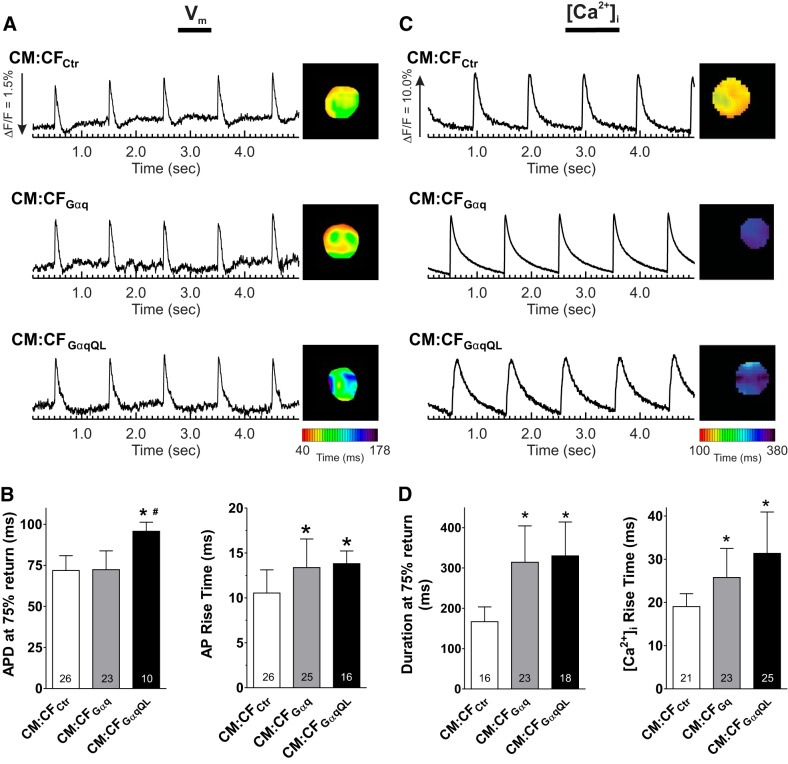
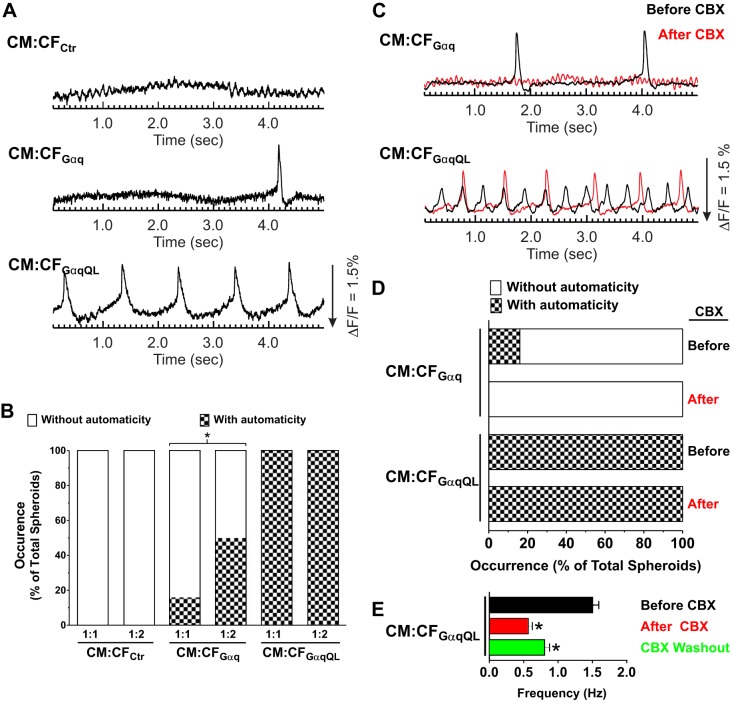
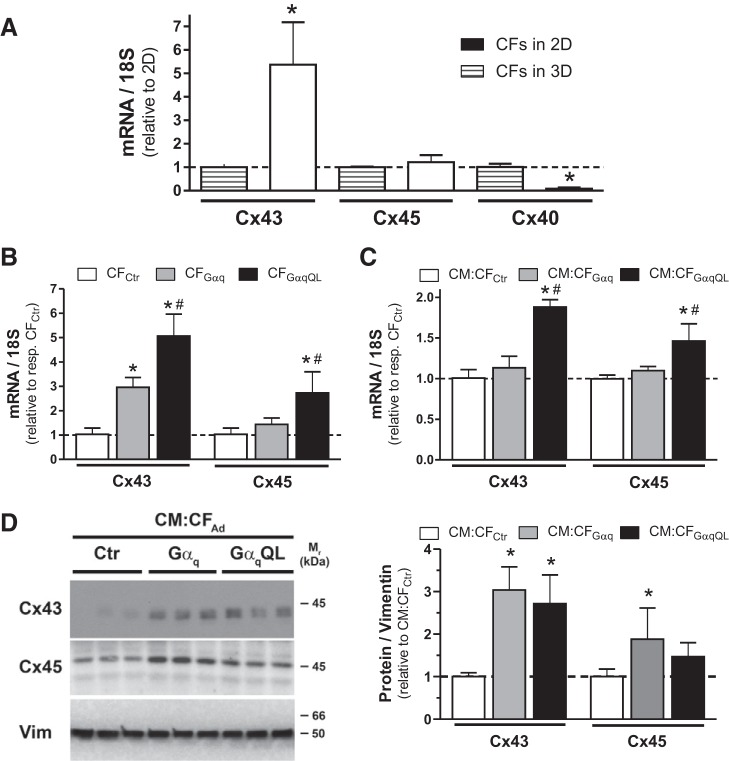
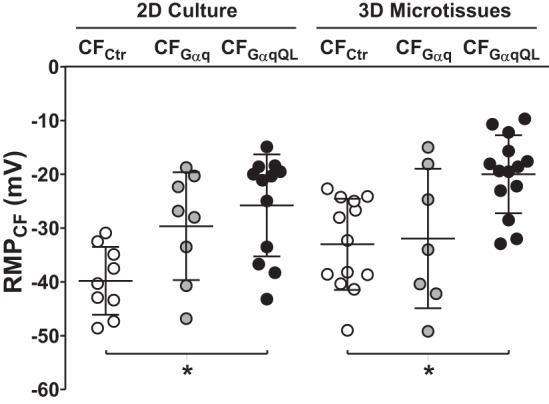
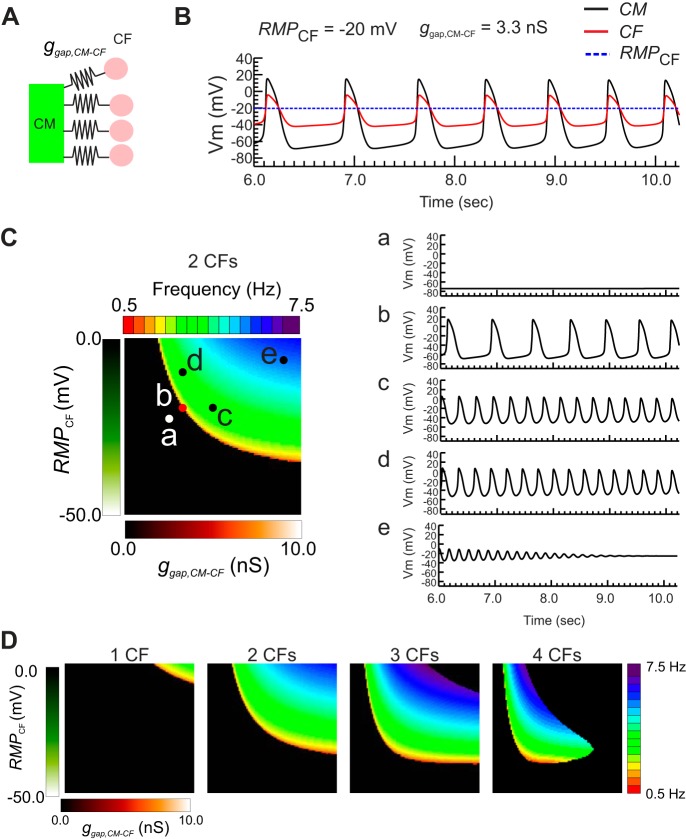
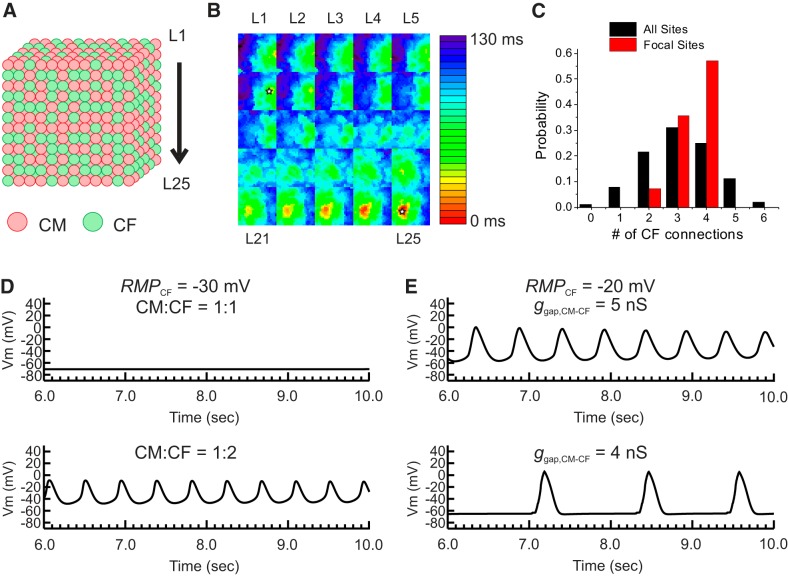
Cardiac fibroblasts (CFs) are known to regulate cardiomyocyte (CM) function in vivo and in two-dimensional in vitro cultures. This study examined the effect of CF activation on the regulation of CM electrical activity in a three-dimensional (3-D) microtissue environment. Using a scaffold-free 3-D platform with interspersed neonatal rat ventricular CMs and CFs, Gq-mediated signaling was selectively enhanced in CFs by Gαq adenoviral infection before coseeding with CMs in nonadhesive hydrogels. After 3 days, the microtissues were analyzed by signaling assay, histological staining, quantitative PCR, Western blots, optical mapping with voltage- or Ca2+-sensitive dyes, and microelectrode recordings of CF resting membrane potential (RMPCF). Enhanced Gq signaling in CFs increased microtissue size and profibrotic and prohypertrophic markers. Expression of constitutively active Gαq in CFs prolonged CM action potential duration (by 33%) and rise time (by 31%), prolonged Ca2+ transient duration (by 98%) and rise time (by 65%), and caused abnormal electrical activity based on depolarization-induced automaticity. Constitutive Gq activation in CFs also depolarized RMPCF from -33 to -20 mV and increased connexin 43 and connexin 45 expression. Computational modeling confers that elevated RMPCF and increased cell-cell coupling between CMs and CFs in a 3-D environment could lead to automaticity. In conclusion, our data demonstrate that CF activation alone is capable of altering action potential and Ca2+ transient characteristics of CMs, leading to proarrhythmic electrical activity. Our results also emphasize the importance of a 3-D environment where cell-cell interactions are prevalent, underscoring that CF activation in 3-D tissue plays a significant role in modulating CM electrophysiology and arrhythmias.NEW & NOTEWORTHY In a three-dimensional microtissue model, which lowers baseline activation of cardiac fibroblasts but enables cell-cell, paracrine, and cell-extracellular matrix interactions, we demonstrate that selective cardiac fibroblast activation by enhanced Gq signaling, a pathophysiological trigger in the diseased heart, modulates cardiomyocyte electrical activity, leading to proarrhythmogenic automaticity.

Keywords: activated cardiac fibroblasts; arrhythmias; automaticity; cardiac myocytes; three-dimensional models.


Figures

Fig. 1.
Fig. 1.
Adenoviral infection of neonatal rat ventricular cardiac fibroblasts (CFs). A: representative merged epifluorescent and phase contrast images of neonatal rat ventricular CFs in two-dimensional (2-D) cell culture, 3 days after infection with Ad-GFP (or Ad-Ctr) at indicated multiplicities of infection (MOIs). Cells were stained with Hoechst for 20 min before mounting. Scale bar = 100 μm. B: representative Western blot of Gαq/11 expression in cell lysates (10 µg protein/lane) collected from CFs in 2-D cultures, 3 days after infection with indicated adenoviruses at MOI 10 (left). GAPDH was used as the loading control. Group data are means ± SD (right). *P < 0.05 vs. Ad-Ctr; #P < 0.05 vs. Ad-Gαq (ANOVA). C: basal inositol phosphate (IP) production in CFs 72 h after infection with the indicated adenoviruses at MOI 2.5, 5, and 10. Three wells from a 6-well plate were pooled for each sample (n = 3 for each condition). Similar results were obtained in two other experiments testing a total of two and four batches of Ad-Gαq and Ad-GαqQL, respectively. D: representative confocal images from sections of cardiomyocyte (CM):CF microtissues composed of a 10:1 or 1:1 ratio of CellTracker Orange-labeled CMs (CMCT-Orange) and Ad-GFP-infected CFs (CFAd-GFP) 2 days after coseeding in hydrogels. Scale bar = 50 μm.
Fig. 2.
Fig. 2.
Cardiac fibroblast (CF)-restricted Gαq activation in spherical cardiac microtissues. A: basal inositol phosphate (IP) production in microtissues after adenoviral infection of CFs with the indicated adenoviruses for 2 h before cell seeding in nonadhesive hydrogels alone (CFAd) or with cardiomyocytes (CMs) (CM:CFAd). Microtissues from 6 hydrogels in the 12-well format were pooled for each sample (n = 3 for each condition). *P < 0.05 vs. control (Ctr); #P < 0.05 vs. Gαq (ANOVA). B: fluorescent images of representative Live/Dead-stained whole CM:CFAd microtissues containing the indicated infected CFs 3 days after infection and cell seeding. Scale bar = 100 µm. C and D: bright-field images of representative hematoxylin and eosin (C)- and Sirius Red (D)-stained cryosections (10 µm thick) of CM:CFAd microtissues fixed after 3 days in three-dimensional (3-D) culture. Scale bars = 100 µm. E: area of CM:CFAd microtissues after 3 days in 3-D culture. Values are means ± SD; n = 65–70 microtissues/condition. *P < 0.05 (ANOVA).
Fig. 3.
Fig. 3.
Cardiac fibroblast (CF)-restricted Gαq overexpression leads to CF activation and atrial natriuretic factor (ANF) expression. CFs were infected with the indicated adenoviruses for 2 h before being seeded. CFs were seeded alone in standard two-dimensional (2-D) culture (A) or were seeded in hydrogels in three-dimensional (3-D) culture alone (CFAd; B) or together with CMs (1:1, CM:CFAd) (CE). After the indicated days, cells or microtissues were harvested for mRNA extraction (pooled from 2−3 wells for each condition, 6-well and 12-well plates for 2-D and 3-D, respectively) or protein extraction (pooled from 3 hydrogels in 6-well format for each condition). A: relative mRNA expression for the indicated proteins assessed by quantitative PCR (qPCR) analysis of cells cultured in 2-D monolayers or in 3-D as described. Values are means ± SD; n = 5–6 per condition. *P < 0.05 vs. 2-D (Student’s t-test). B and C: relative mRNA expression for the indicated proteins in CFAd (B) or CM:CFAd microtissues (C) assessed by qPCR analysis after 3 days in 3-D culture. Values are means ± SD for n = 6 (B) or n = 3 (C) samples/condition. *P < 0.05 vs. control (Ctr); #P < 0.05 vs. Gαq (ANOVA). D, top: representative Western blots of microtissue lysates after 2 days in 3-D culture (10 µg protein/lane) probed with the indicated antibodies. GAPDH was used as the loading control. Similar changes were observed after 3 and 4 days in culture (not shown). Bottom: pooled group data. Values are means ± SD; n = 4–7 samples/condition. *P < 0.05 vs. Ctr (ANOVA). E: relative mRNA expression of the indicated proteins in CM:CFAd microtissues assessed by qPCR analysis after 3 days in 3-D culture. Values are means ± SD; n = 3 samples/condition. *P < 0.05 vs. Ctr (ANOVA). αSA, α sarcomeric actinin; αSMA, α-smooth muscle actin; CTGF, connective tissue growth factor; FN, fibronectin; Vim, vimentin.
Fig. 4.
Fig. 4.
q activation in cardiac fibroblasts (CFs) prolongs action potential (AP) and Ca2+ transient duration and rise time in cardiomyocyte (CM):CF microtissues. CMs and CFs infected with the indicated adenoviruses were coseeded at a 1:1 ratio in hydrogels. After 3 days in three-dimensional (3-D) culture, microtissues were loaded with di-4-ANEPPS or Rhod2-AM for optical mapping of membrane potentials (Vm; left) or Ca2+ transients ([Ca2+]i; right) under paced conditions (1 Hz). A and C: representative traces and duration maps of paced Vm and [Ca2+]i recordings obtained from the indicated microtissues paced at 1 Hz. B and D: quantification of the duration at 75% return (left) and rise time (right) of APs and [Ca2+]i in CM:CFAd (1:1) microtissues. Values were averaged from all the pixels of single spheroids (~60 pixels/spheroid). Values are means ± SD for the indicated numbers. *P < 0.05 vs. control (Ctr); #P < 0.05 vs. Gαq (ANOVA). Data shown are from a representative experiment in which both Vm and [Ca2+]i were recorded in the same batch of microtissues. Comparable recordings and differences between the experimental groups were obtained in two and four additional independent experiments for Vm and [Ca2+]i, respectively. APD, AP duration.
Fig. 5.
Fig. 5.
q activation in cardiac fibroblasts (CFs) causes automaticity in unpaced cardiomyocyte (CM):CF microtissues that is mitigated by partial gap junction inhibition. CMs and CFs infected with the indicated adenovirus were coseeded in 1:1 or 1:2 ratios in hydrogels. After 3 days in three-dimensional (3-D) culture, microtissues were loaded with di-4-ANNEPS and optically mapped in the absence of electrical stimulation. A: representative membrane potential (Vm) traces of 1:1 CM:CFAd microtissues illustrating automacity in unpaced microtissues. B: group data for the occurrence of automacity within 5-s recordings, expressed as a percentage of total microtissues recorded for each condition per hydrogel. *P < 0.05 (Fisher’s exact test). C: representative Vm traces of unpaced CM:CFGαq and CM:CFGαqQL microtissues (1:1) from A that were optically mapped in the absence of electrical stimulation both before (black) and after (red) administration of carbenoxolone (CBX; 100 μM, 10 min), illustrating that automacity was mitigated by CBX. The traces recorded before and after CBX are from the same microtissue. D: group data for the occurrence of automacity within 5-s recordings before and after 100 μM CBX administration for 10 min (expressed as percentages of total microtissues recorded for each condition). E: unpaced CM:CFGαqQL microtissues were perfused with 100 μM CBX for 30 min followed by a washout period of 30 min. Averaged frequency of the automaticity observed before CBX (n = 34), after CBX (n = 31), and after CBX washout (n = 27) is shown. Values are means ± SD. *P < 0.05 (Student’s t-test).
Fig. 6.
Fig. 6.
q activation in cardiac fibroblasts (CFs) increases gap junction protein expression in CFAd and CM:CFAd microtissues. CFs were infected with indicated adenoviruses for 2 h before being seeded in hydrogels alone (CFAd) or together with CMs (CM:CFAd, 1:1). After 3 days in three-dimensional (3-D) culture, microtissues were harvested for mRNA extraction (pooled from 3 hydrogels in 12-well format per condition) and protein extraction (pooled from 3 hydrogels in 6-well format per condition). A: relative mRNA expression of indicated connexin (Cx) isoforms assessed by quantitative PCR (qPCR) analysis of CFs cultured in two-dimensional (2-D) monolayers for 3 days (pooled from 2−3 wells from a 6-well plate) or in 3-D as described. Values are means ± SD; n = 5–6 samples/condition). *P < 0.05 vs. 2-D (Student’s t-test). B and C: relative mRNA expression of Cx43 and Cx45 in CFAd and CM:CFAd assessed qPCR analysis after 3 days in 3-D culture. Values are means ± SD; n = 6 samples/condition. *P < 0.05 vs. control (Ctr); #P < 0.05 vs. Gαq (ANOVA). D: representative Western blots (left) of microtissue lysates after 3 days in 3-D culture (10 µg protein/lane) probed with the indicated antibodies. Vimentin was used as the loading control. Similar results were obtained after 2 days (not shown). Group data (right) are means ± SD; n = 5 samples/condition. *P < 0.05 vs. Ctr (ANOVA).
Fig. 7.
Fig. 7.
Elevated resting membrane potential (RMP) in GαqQL-activated cardiac fibroblasts (CFs). CFs were infected with the indicated adenoviruses for 2 h before being seeded alone in two-dimensional (2-D) or three-dimensional (3-D) cultures. For electrophysiology experiments, cells were digested after 3 days in 2-D culture and allowed to reattach for 6–12 h before being patch clamped, and microtissues were harvested after 2 days in 3-D culture and allowed to attach to coverslips for 24 h before being probed with a microelectrode. Depicted are resting membrane potentials from individual recordings and group data (means ± SD; n = 8–14 each). *P < 0.05 vs. control (Ctr; ANOVA).
Fig. 8.
Fig. 8.
Computer modeling study predicts that elevated resting membrane potential of cardiac fibroblasts (RMPCF) and increased cardiac myocyte (CM)-cardiac fibroblast (CF) coupling facilitate automaticity. A: schematics of CM-CF coupling in the computational modeling study. The number of CFs connected to a single CM was increased from n = 1 to n = 4. B: representative membrane potential (Vm) traces from CM (black), CF (red), and reference trace of unconnected CF RMP (dotted blue). Vm of CF also oscillated in parallel with CM through electrotonic current flow between CM and CF through gap junctions. C: map of automaticity frequencies in the parameter space of gap coupling conductance between CM-CF (ggap,CM-CF; x-axis) and RMPCF (y-axis) when n = 2 CFs were connected (left). RMPCF was varied from −50 to 0 mV, and ggap,CM-CF was varied from 0 to 10 nS. Right, representative Vm traces of CM from the locations marked on the frequency map. The characteristics of Vm traces can be categorized into five groups: without automaticity at low RMPCF and/or ggapCM-CF (a), automaticity associated with a slow rise of Vm during the resting period (b), acceleration of automaticity when ggap,CM-CF increases (c), acceleration of automaticity caused by elevation of RMPCF (d), and Vm reaches close to RMPCF with dampening Vm oscillations (e). D: maps of automaticity frequencies in the same parameter space of ggap,CM-CF (x-axis) and RMPCF (y-axis) with one to four CFs coupled to CM. The map for two CFs is the same as in C. Increase of connected CFs promoted automaticity at lower RMPCF and ggap,CM-CF.
Fig. 9.
Fig. 9.
Computational modeling study of the three-dimensional (3-D) effect of cardiomyocyte (CM)-cardiac fibroblast (CF) interactions on automaticity. A: schematics of 3-D cube modeling. CMs and CFs were randomly distributed to have 1:1 or 1:2 ratios in a cube of 25 × 2 5 × 25 cells. B: representative activation map of automaticity from the 3-D cube. The activation maps of each layer labeled as L1−L25 in A are shown in 5 × 5 grids, starting the top layer in the top left corner. In this set of CM:CF distribution, automaticity was originated from two sites (open star). C: the number of CFs connected to a single CM in 3-D cube. The parameter set was chosen based on the single CM-CF simulation shown in Fig. 8. The resting membrane potential of a CF (RMPCF) was set to −20 mV and gap junction coupling conductance between CM-CF (ggap,CM-CF) was set to 5 nS. With these parameter settings, automaticity was not observed when n = 1 CF was connected (Fig. 8D). A total of 12 randomly generated CM:CF = 1:1 distributions were tested. The black histogram bars indicate the number of CFs connected to CM from all the CMs in the 3-D cube, which shows that the majority of CMs have connections with three CFs on average. The red histogram bars represent the number of CFs connected only to CMs that initiate automaticity. The initiation sites of automaticity showed a larger number of CFs connected to CMs. D: effect of increased CFs on automaticity. RMPCF was set to −30 mV and showed no automaticity. When the CM:CF ratio was increased from 1:1 to 1:2, automaticity appeared, suggesting that a higher density of CF promotes automaticity as seen experimentally for CM:CFGαq (see Fig. 5B). E: effect of ggap,CM-CF on automaticity. A reduction of ggap,CM-CF from 5 to 4 nS decreased the frequency of automaticity, which replicates the effect of carbenoxolone we observed experimentally in CM:CFGαqQL (see Fig. 5E). Vm, membrane potential.

Similar articles

Cited by

References

    1. Achilli TM, Meyer J, Morgan JR. Advances in the formation, use and understanding of multi-cellular spheroids. Expert Opin Biol Ther 12: 1347–1360, 2012. doi:10.1517/14712598.2012.707181. - DOI - PMC - PubMed
    1. Adams JW, Sakata Y, Davis MG, Sah VP, Wang Y, Liggett SB, Chien KR, Brown JH, Dorn GW 2nd. Enhanced Gαq signaling: a common pathway mediates cardiac hypertrophy and apoptotic heart failure. Proc Natl Acad Sci USA 95: 10140–10145, 1998. - PMC - PubMed
    1. Ali SR, Ranjbarvaziri S, Talkhabi M, Zhao P, Subat A, Hojjat A, Kamran P, Müller AM, Volz KS, Tang Z, Red-Horse K, Ardehali R. Developmental heterogeneity of cardiac fibroblasts does not predict pathological proliferation and activation. Circ Res 115: 625–635, 2014. doi:10.1161/CIRCRESAHA.115.303794. - DOI - PubMed
    1. Antzelevitch C, Burashnikov A. Overview of basic mechanisms of cardiac arrhythmia. Card Electrophysiol Clin 3: 23–45, 2011. doi:10.1016/j.ccep.2010.10.012. - DOI - PMC - PubMed
    1. Askar SF, Bingen BO, Swildens J, Ypey DL, van der Laarse A, Atsma DE, Zeppenfeld K, Schalij MJ, de Vries AA, Pijnappels DA. Connexin43 silencing in myofibroblasts prevents arrhythmias in myocardial cultures: role of maximal diastolic potential. Cardiovasc Res 93: 434–444, 2012. doi:10.1093/cvr/cvr351. - DOI - PubMed