. 2017 Sep;175(1):77-91.
doi: 10.1104/pp.17.00452. Epub 2017 Jul 14.

Manipulation of a Senescence-Associated Gene Improves Fleshy Fruit Yield

Affiliations

Manipulation of a Senescence-Associated Gene Improves Fleshy Fruit Yield

Bruno S Lira et al. Plant Physiol. 2017 Sep.

Abstract

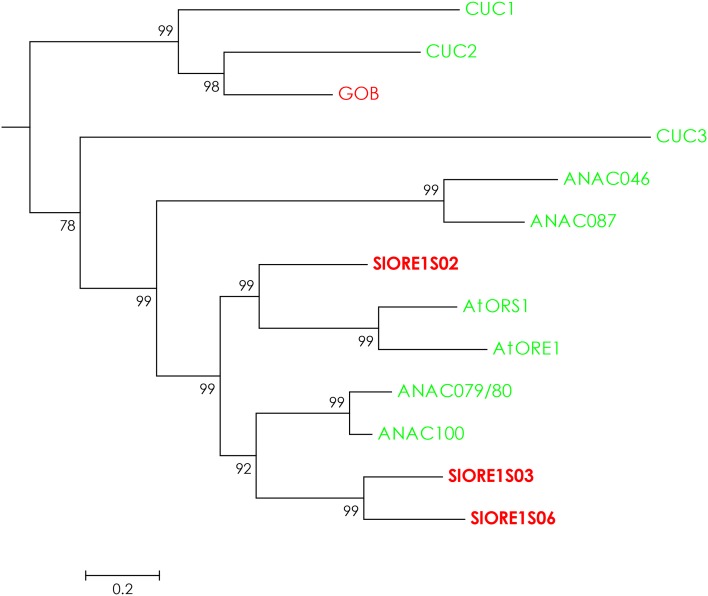
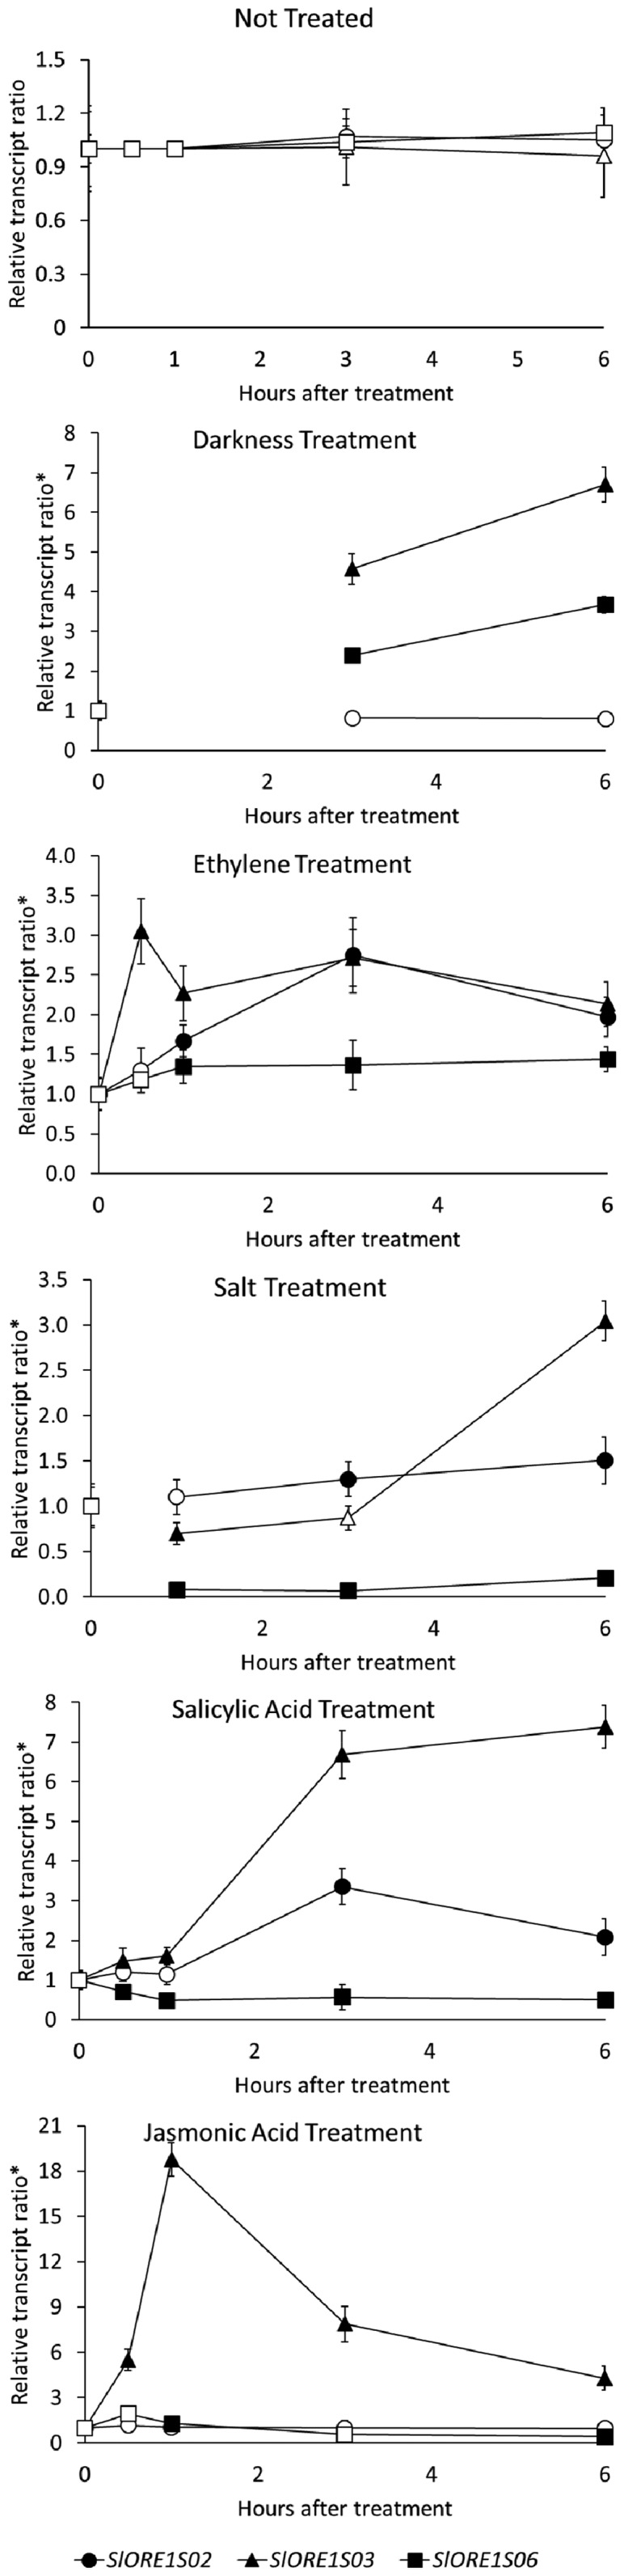
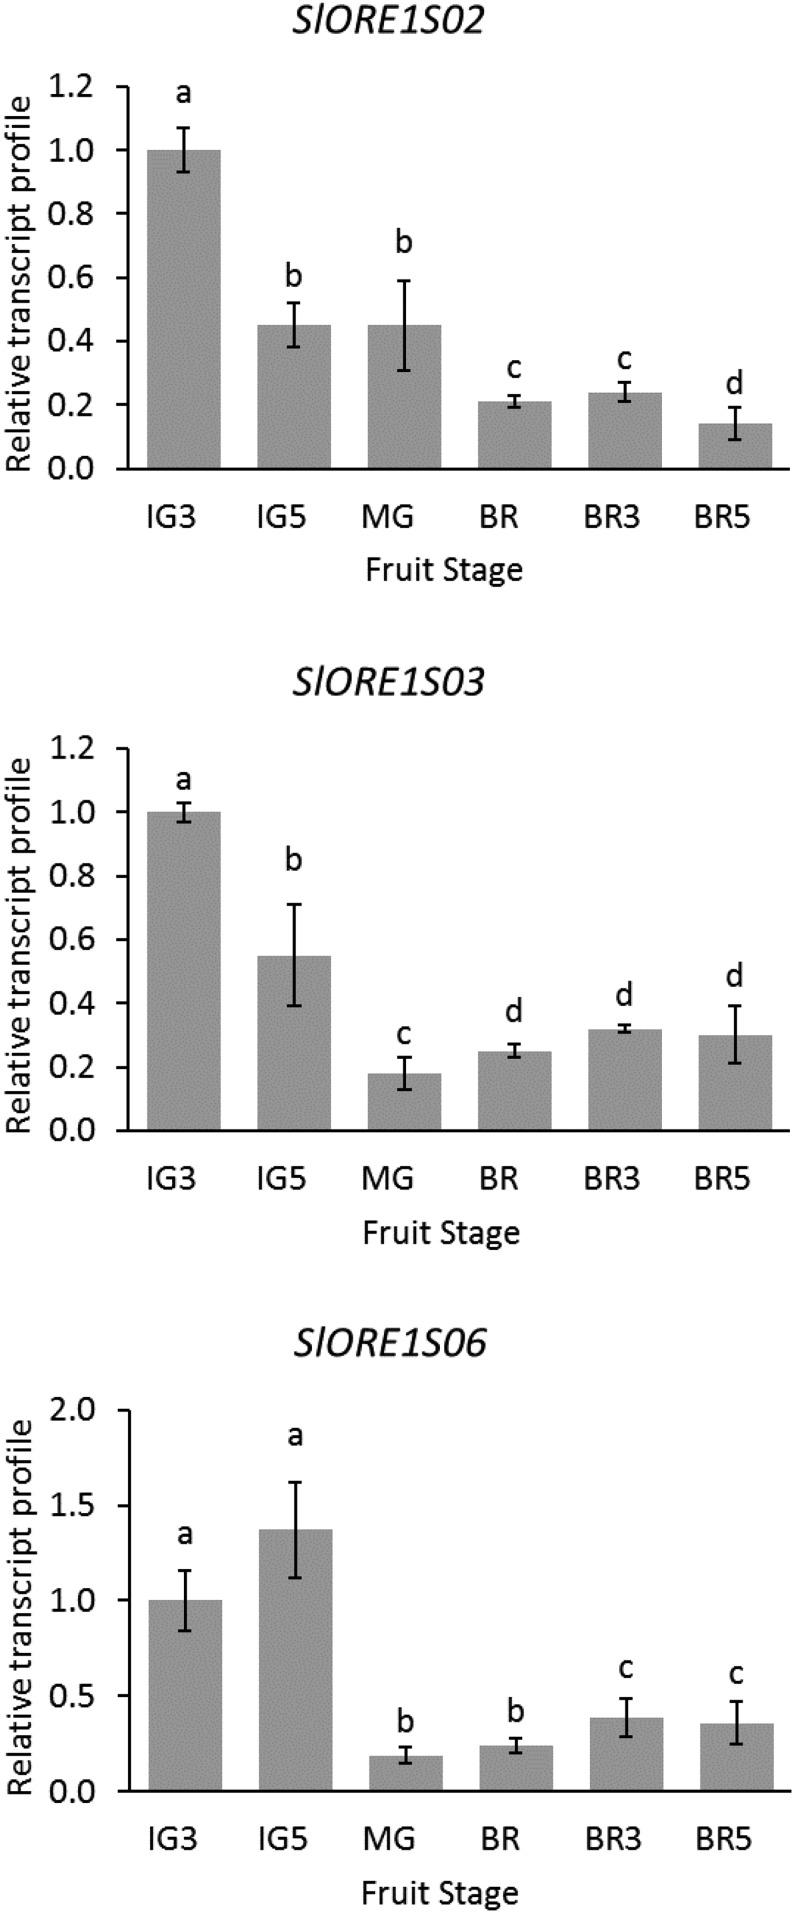
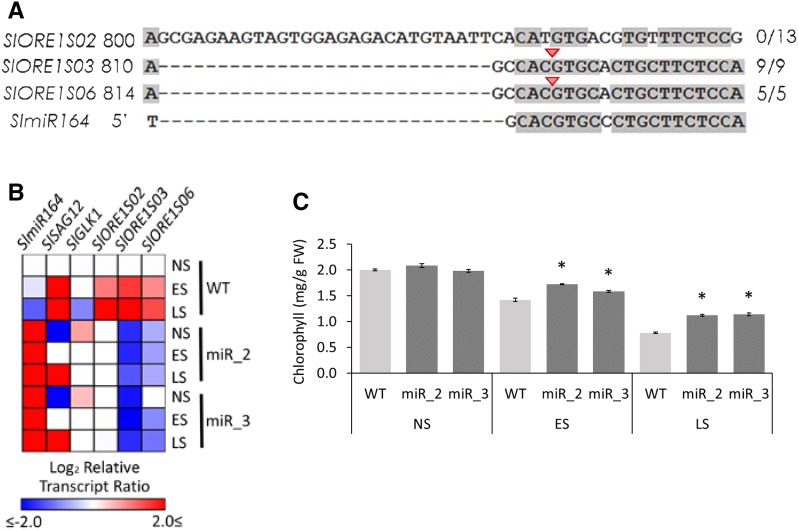
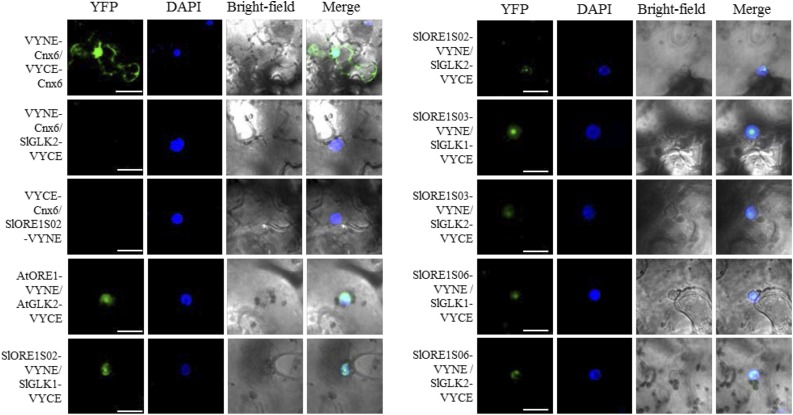
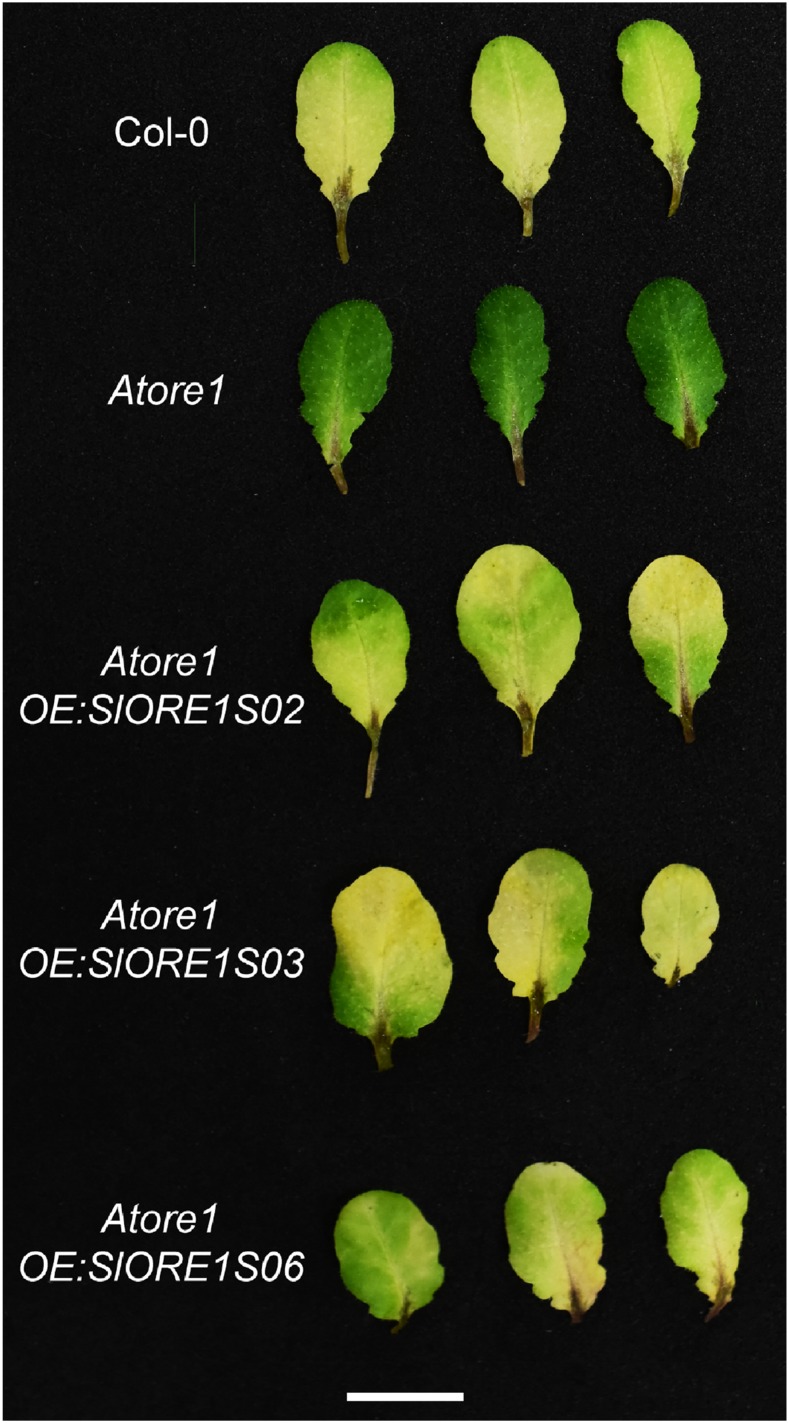
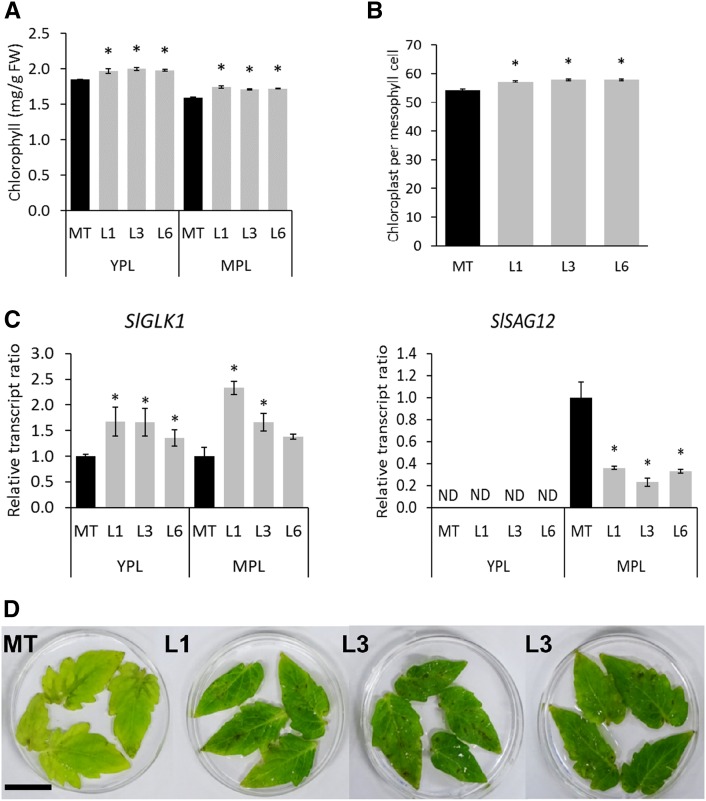
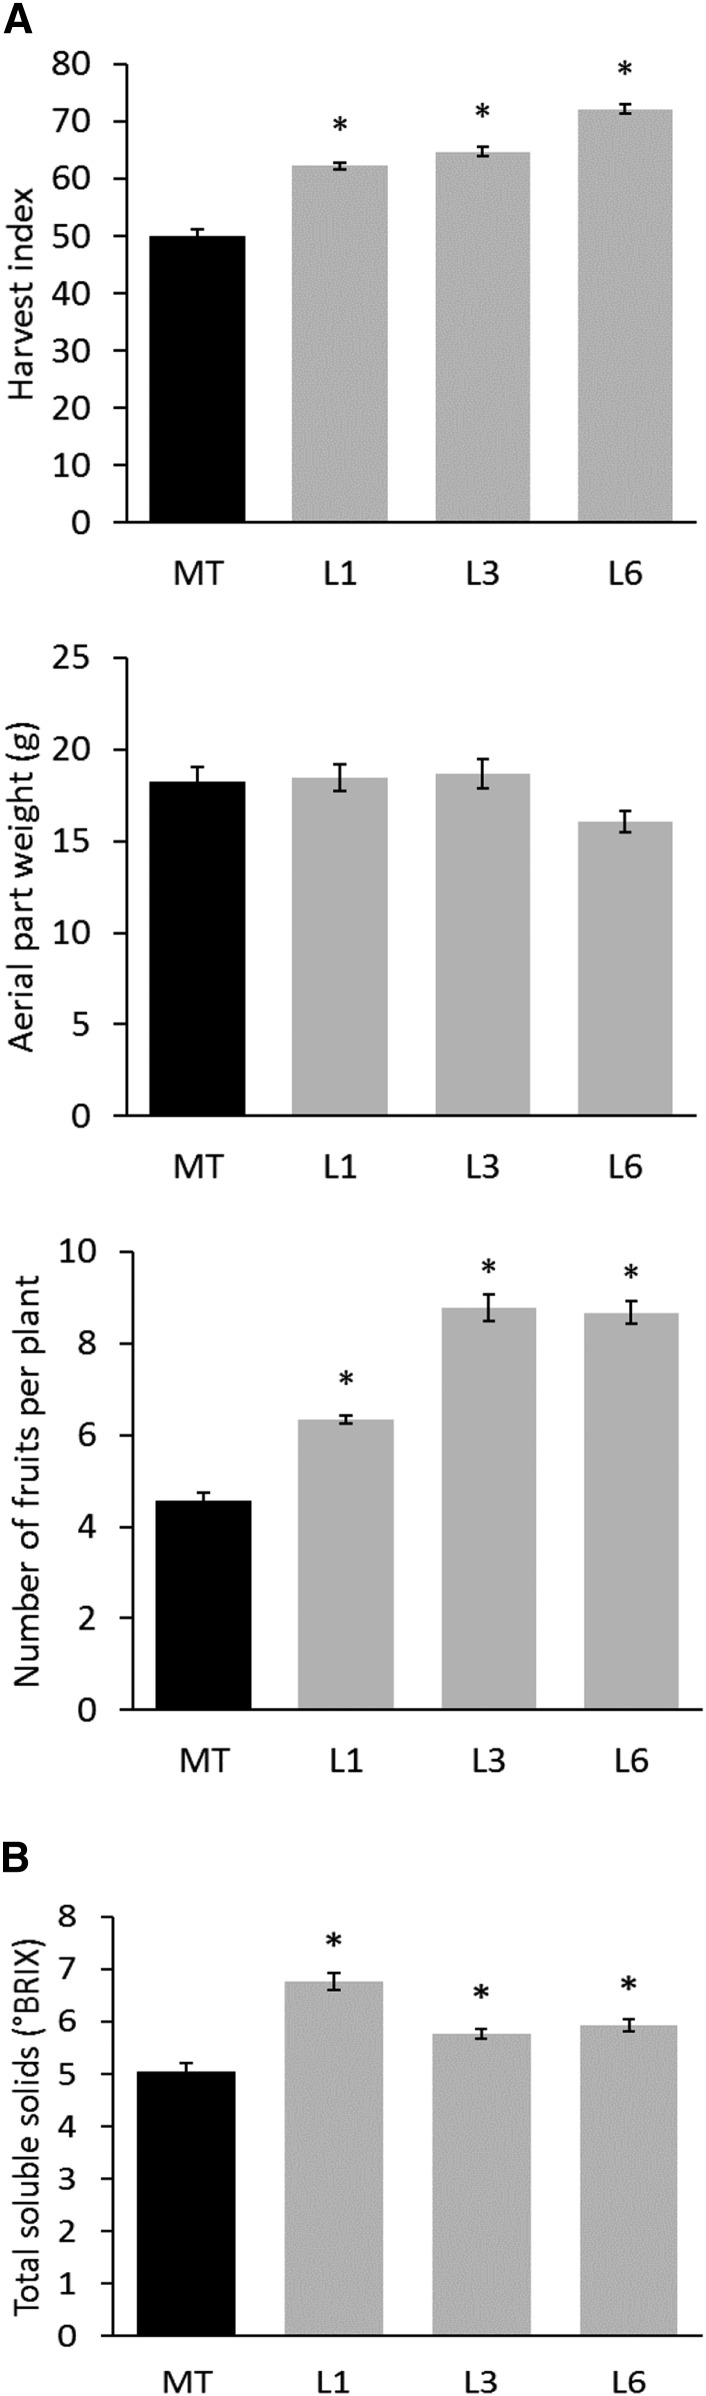
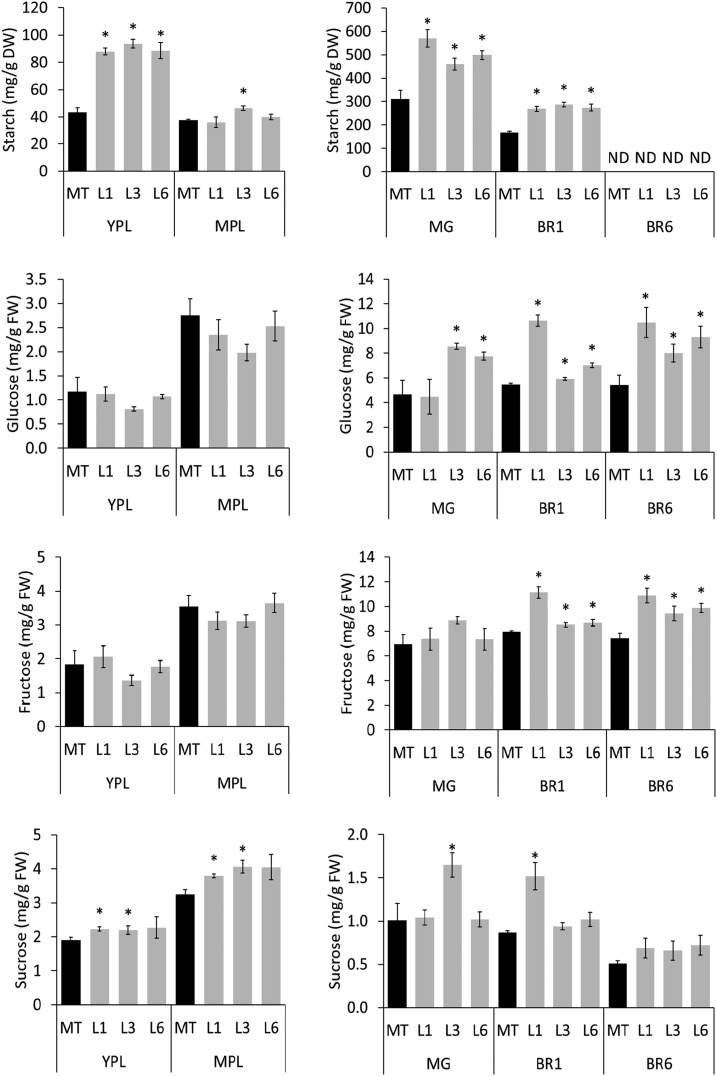
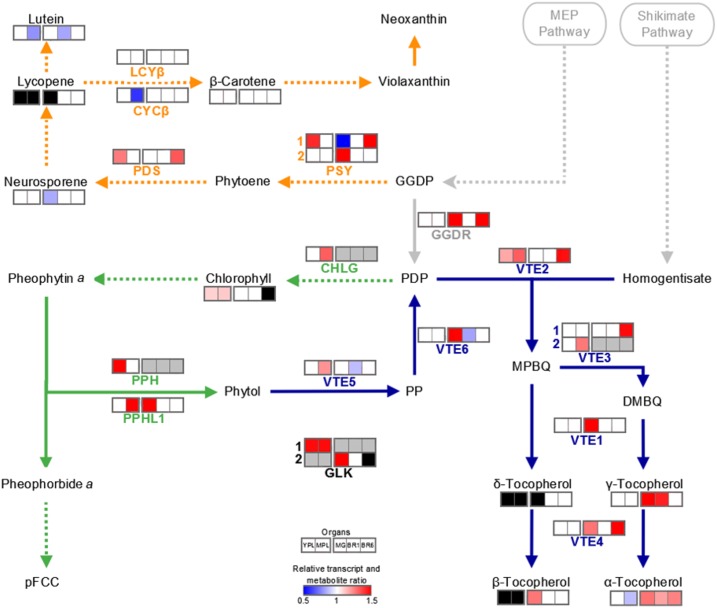
Senescence is the process that marks the end of a leaf's lifespan. As it progresses, the massive macromolecular catabolism dismantles the chloroplasts and, consequently, decreases the photosynthetic capacity of these organs. Thus, senescence manipulation is a strategy to improve plant yield by extending the leaf's photosynthetically active window of time. However, it remains to be addressed if this approach can improve fleshy fruit production and nutritional quality. One way to delay senescence initiation is by regulating key transcription factors (TFs) involved in triggering this process, such as the NAC TF ORESARA1 (ORE1). Here, three senescence-related NAC TFs from tomato (Solanum lycopersicum) were identified, namely SlORE1S02, SlORE1S03, and SlORE1S06. All three genes were shown to be responsive to senescence-inducing stimuli and posttranscriptionally regulated by the microRNA miR164 Moreover, the encoded proteins interacted physically with the chloroplast maintenance-related TF SlGLKs. This characterization led to the selection of a putative tomato ORE1 as target gene for RNA interference knockdown. Transgenic lines showed delayed senescence and enhanced carbon assimilation that, ultimately, increased the number of fruits and their total soluble solid content. Additionally, the fruit nutraceutical composition was enhanced. In conclusion, these data provide robust evidence that the manipulation of leaf senescence is an effective strategy for yield improvement in fleshy fruit-bearing species.


Figures

Figure 1.
Figure 1.
Phylogenetic representation of the NAC transcription factor subfamily that includes AtORE1 and SlORE1s. Shown is a detail of the phylogenetic reconstruction obtained from an alignment of the protein sequences of all NAC transcription factors of Arabidopsis (green) and tomato (red) obtained from the Plant Transcription Factor Database (Supplemental Table S1). Three putative AtORE1 orthologs (in boldface), named SlORE1S02, SlORE1S03, and SlORE1S06 according to their chromosome positions, were identified.
Figure 2.
Figure 2.
Transcript profiles of SlORE1s in response to senescence-inducing treatments. Transcript profiles are shown for SlORE1s in leaves of 4-week-old in vitro-grown plants after senescence-inducing treatments. Values represent means ± se from at least three biological replicates normalized against the 0-h sample. *, Each treatment relative transcript ratio is expressed as the ratio between the treatment value and the corresponding untreated control. Statistically significant differences relative to the 0-h treatment are represented with black symbols (P < 0.05).
Figure 3.
Figure 3.
Transcript profiles of SlORE1s along fruit development and ripening. IG, Immature green stage; MG, mature green stage; BR, breaker stage; BRX, X days after breaker stage. Values represent means ± se from at least three biological replicates normalized to the corresponding IG3 sample. Statistically significant differences are represented with letters (P < 0.05).
Figure 4.
Figure 4.
Regulation of SlORE1s by SlmiR164. A, Highlight of the alignment of SlORE1s and SlmiR164 showing the putative binding sites. Validation by a modified 5′ RACE assay identified cleaved transcripts of SlORE1S03 and SlORE1S06. The red arrowheads and the numbers on the right indicate the inferred cleavage sites and the fractions of positive cloned PCR products ending at the site, respectively. The shading threshold of alignment = 75%. B, Heat map representing the transcript profiles of nonsenescent (NS), early-senescing (ES), and late-senescing (LS) leaves of wild-type control (WT) and OEmiR164a (lines miR_2 and miR_3) genotypes. Values represent means of at least three biological replicates normalized against the nonsenescent wild-type sample. Statistically significant differences in comparison with the nonsenescent wild type are represented as colored squares (P < 0.05). The relative transcript values are detailed in Supplemental Table S2. C, Chlorophyll contents in NS, ES, and LS leaves. Values represent means ± se from at least three biological replicates. Asterisks denote statistically significant differences compared with the wild-type control (P < 0.05.) FW, Fresh weight.
Figure 5.
Figure 5.
Analysis of SlGLK and SlORE1 protein-protein interactions by BiFC. VYNE and VYCE fusion proteins were transiently expressed in tobacco leaves by infiltration with A. tumefaciens. VYNE-Cnx6/VYCE-Cnx6 and AtORE1/AtGLK2 (Gehl et al., 2009) were used as technical and biological positive controls, respectively. VYNE-Cnx6/SlGLK2-VYCE and VYCE-Cnx6/SlORE1S02-VYNE interactions were used as negative controls. SlORE-SlGLK interaction was confirmed as evidenced by the YFP fluorescence detected. YFP, DAPI nuclear marker, bright-field, and merged signals are indicated above the columns. Bars = 20 μm, except in VYNE-Cnx6/VYCE-Cnx6 images, where bars = 40 μm.
Figure 6.
Figure 6.
SlORE1s partially recover Atore1 senescence impairment. Detached leaves from 3-month-old Col-0, Atore1 mutant, Atore1-OE:SlORE1S02, Atore1-OE:SlORE1S03, and Atore1-OE:SlORE1S06 plants were kept in darkness for 7 d to induce senescence. While Atore1 displayed no signs of senescence, the yellowish color of the genotypes overexpressing SlORE1s hints at an ongoing senescence program, yet not to the extent observed in the Col-0 genotype. Bar = 1 cm.
Figure 7.
Figure 7.
SlORE1S02 knockdown affects leaf aging. A, Chlorophyll content in leaves. Values represent means ± se from at least three biological replicates. Asterisks denote statistically significant differences compared with the MT control (P < 0.05). FW, Fresh weight. B, Number of chloroplasts per mesophyll cell of MPL. Values represent means ± se from at least 45 cells. Asterisks denote statistically significant differences compared with the MT control (P < 0.05). C, SlGLK1 and SlSAG12 transcript ratios in YPL and MPL leaves. Values represent means ± se from at least three biological replicates normalized against the respective sample from the MT control. Asterisks denote statistically significant differences compared with the MT control (P < 0.05). The relative transcript values are available in Supplemental Table S4. D, SlORE1S02 knockdown effects on dark-induced senescence in tomato leaves. Detached leaflets from 120-d-old plants kept 10 d in darkness retained greenness, while MT control leaflets turned yellow. Bar = 5 cm.
Figure 8.
Figure 8.
SlORE1S02 knockdown increases yield and brix. A, HI, aerial part weight, and ripe fruit number in MT and SlORE1S02 knockdown lines. Values represent means ± se from at least six biological replicates. Asterisks denote statistically significant differences compared with the MT control genotype (P < 0.05). B, Total soluble solids of ripe fruits measured in brix units. Values represent means ± se from at least 12 biological replicates. Asterisks denote statistically significant differences compared with the MT control genotype (P < 0.05).
Figure 9.
Figure 9.
SlORE1S02 knockdown alters the sugar profile in leaves and fruits. The contents of starch and soluble sugars in leaves and fruits of SlORE1S02 knockdown lines are shown. Values represent means ± se from at least three biological replicates. Asterisks denote statistically significant differences compared with the MT control genotype (P < 0.05). BR, Breaker stage; BR6, 6 d after breaker stage; DW, dry weight; FW, fresh weight; MG, mature green stage; ND, not detected.
Figure 10.
Figure 10.
Isoprenoid metabolism. Schematic representation shows the interconnection between chlorophyll synthesis and degradation (green), carotenogenesis (orange), and tocopherol biosynthetic (blue) pathways. Dotted lines denote that intermediate steps were omitted. The heat map represents statistically significant differences in relative transcript and metabolite amounts detected in SlORE1S02 knockdown lines compared with the corresponding organ of the MT control genotype (P < 0.05). For simplicity, the mean of three transgenic line values is represented when at least two were statistically significant different compared with the MT control. The absolute metabolite and relative transcript values are detailed in Supplemental Tables S3 and S4. Black and gray colors indicate that transcripts were not detected or not addressed, respectively. Enzymes and compounds are named according to the following abbreviations: CHLG, chlorophyll synthase; CYCβ, chromoplast-specific β-lycopene cyclase; GGDP, geranylgeranyl diphosphate; GGDR, geranylgeranyl diphosphate reductase; LCYβ, chloroplast-specific β-lycopene cyclase; MEP, methylerythritol 4-phosphate; MPBQ, 2-methyl-6-geranylgeranylbenzoquinol; PDP, phytyl diphosphate; PDS, phytoene desaturase; pFCC, primary fluorescent chlorophyll catabolite; PP, phytyl phosphate; PPH, pheophytinase; PPHL1, pheophytinase-like1; PSY, phytoene synthase; VTE1, tocopherol cyclase; VTE2, homogentisate phytyl transferase; VTE3, 2,3-dimethyl-5-phytylquinol methyltransferase; VTE4, tocopherol C-methyl transferase; VTE5, phytol kinase; VTE6, phytyl phosphate kinase. Adapted from Almeida et al. (2016).

Similar articles

Cited by

References

    1. Almeida J, Asís R, Molineri VN, Sestari I, Lira BS, Carrari F, Peres LEP, Rossi M (2015) Fruits from ripening impaired, chlorophyll degraded and jasmonate insensitive tomato mutants have altered tocopherol content and composition. Phytochemistry 111: 72–83 - PubMed
    1. Almeida J, Azevedo MdaS, Spicher L, Glauser G, vom Dorp K, Guyer L, del Valle Carranza A, Asis R, de Souza AP, Buckeridge M, et al. (2016) Down-regulation of tomato PHYTOL KINASE strongly impairs tocopherol biosynthesis and affects prenyllipid metabolism in an organ-specific manner. J Exp Bot 67: 919–934 - PMC - PubMed
    1. Balazadeh S, Riaño-Pachón DM, Mueller-Roeber B (2008) Transcription factors regulating leaf senescence in Arabidopsis thaliana. Plant Biol (Stuttg) (Suppl 1) 10: 63–75 - PubMed
    1. Balazadeh S, Siddiqui H, Allu AD, Matallana-Ramirez LP, Caldana C, Mehrnia M, Zanor MI, Köhler B, Mueller-Roeber B (2010) A gene regulatory network controlled by the NAC transcription factor ANAC092/AtNAC2/ORE1 during salt-promoted senescence. Plant J 62: 250–264 - PubMed
    1. Barker L, Kühn C, Weise A, Schulz A, Gebhardt C, Hirner B, Hellmann H, Schulze W, Ward JM, Frommer WB (2000) SUT2, a putative sucrose sensor in sieve elements. Plant Cell 12: 1153–1164 - PMC - PubMed

LinkOut - more resources