. 2017 Jul 14;6(7):e006394.
doi: 10.1161/JAHA.117.006394.

Dipeptidyl Peptidase-4 Regulates Hematopoietic Stem Cell Activation in Response to Chronic Stress

Affiliations

Dipeptidyl Peptidase-4 Regulates Hematopoietic Stem Cell Activation in Response to Chronic Stress

Enbo Zhu et al. J Am Heart Assoc. .

Abstract

Background: DPP4 (Dipeptidyl peptidase-4)-GLP-1 (glucagon-like peptide-1) and its receptor (GLP-1R) axis has been involved in several intracellular signaling pathways. The Adrβ3 (β3-adrenergic receptor)/CXCL12 (C-X-C motif chemokine 12) signal was required for the hematopoiesis. We investigated the novel molecular requirements between DPP4-GLP-1/GLP-1 and Adrβ3/CXCL12 signals in bone marrow (BM) hematopoietic stem cell (HSC) activation in response to chronic stress.

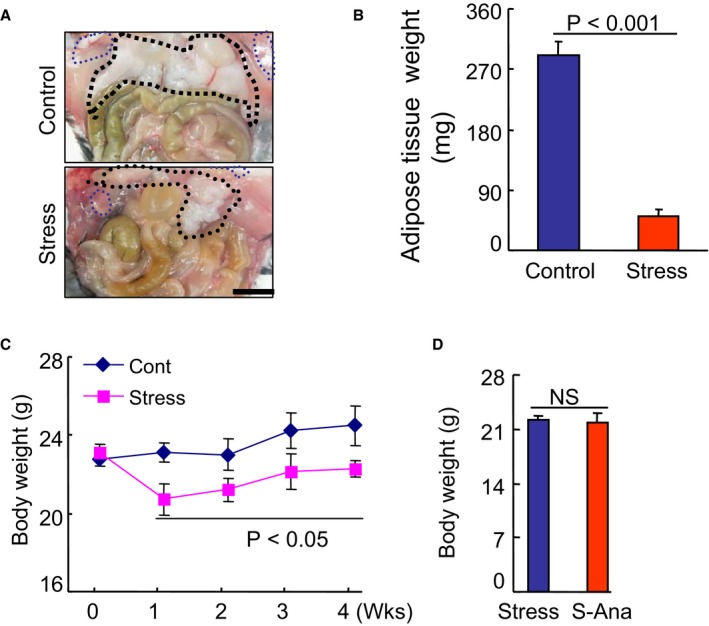
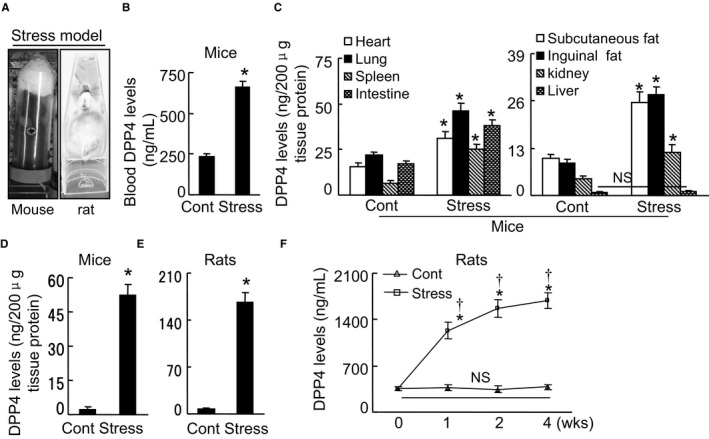
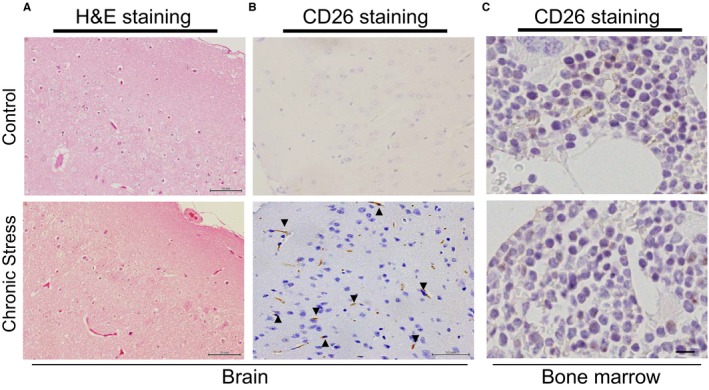
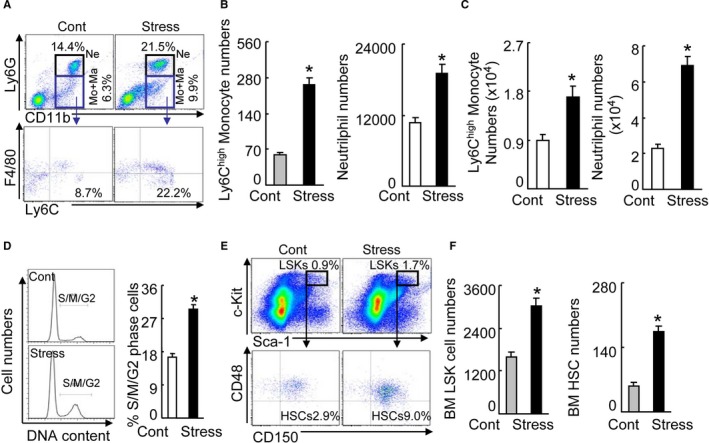
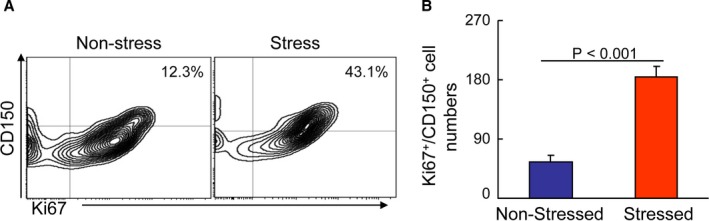
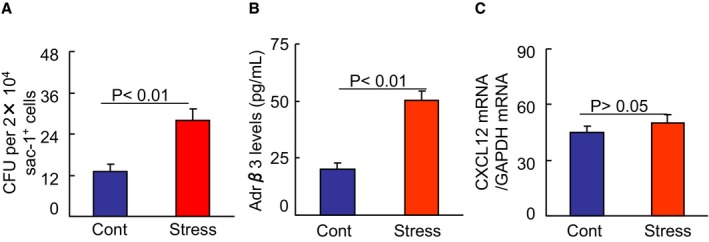
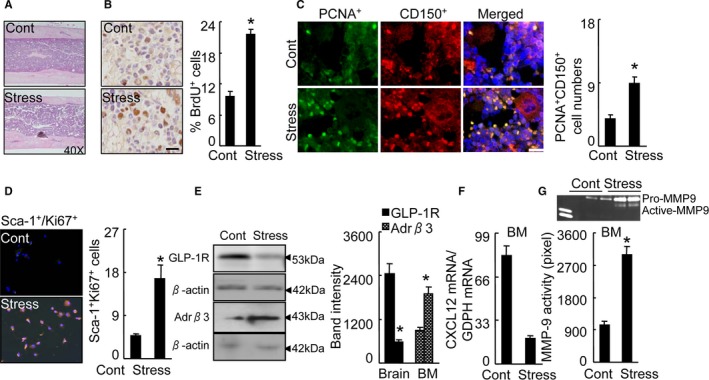
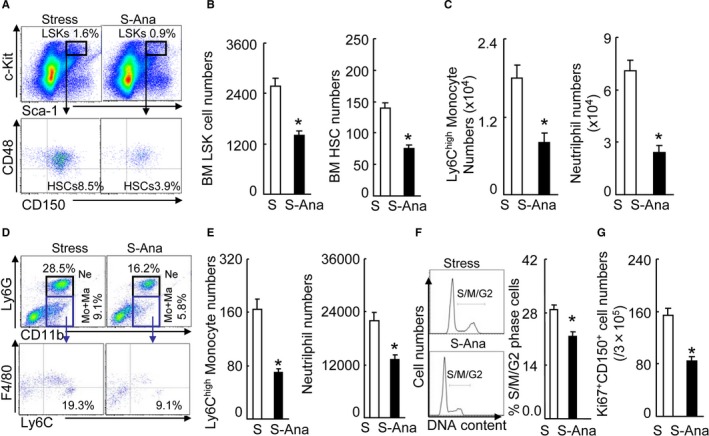
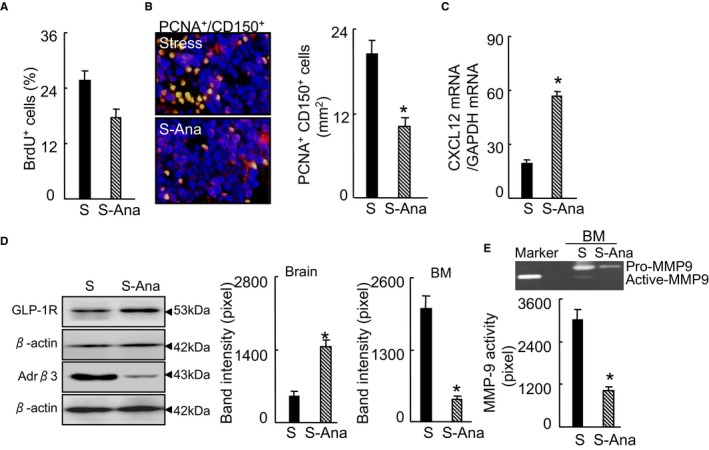
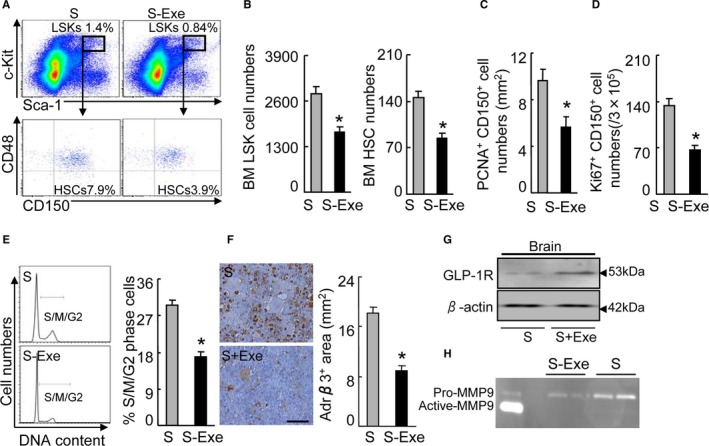
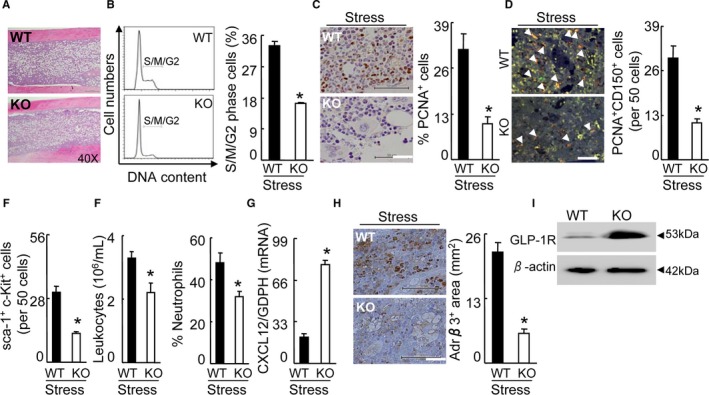
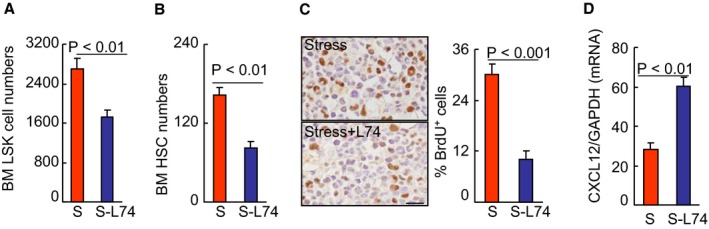
Methods and results: Male 8-week-old mice were subjected to 4-week intermittent restrain stress and orally treated with vehicle or the DPP4 inhibitor anagliptin (30 mg/kg per day). Control mice were left undisturbed. The stress increased the blood and brain DPP4 levels, the plasma epinephrine and norepinephrine levels, and the BM niche cell Adrβ3 expression, and it decreased the plasma GLP-1 levels and the brain GLP-1R and BM CXCL12 expressions. These changes were reversed by DPP4 inhibition. The stress activated BM sca-1highc-KithighCD48lowCD150high HSC proliferation, giving rise to high levels of blood leukocytes and monocytes. The stress-activated HSC proliferation was reversed by DPP4 depletion and by GLP-1R activation. Finally, the selective pharmacological blocking of Adrβ3 mitigated HSC activation, accompanied by an improvement of CXCL12 gene expression in BM niche cells in response to chronic stress.

Conclusions: These findings suggest that DPP4 can regulate chronic stress-induced BM HSC activation and inflammatory cell production via an Adrβ3/CXCL12-dependent mechanism that is mediated by the GLP-1/GLP-1R axis, suggesting that the DPP4 inhibition or the GLP-1R stimulation may have applications for treating inflammatory diseases.

Keywords: glucagon‐like peptide‐1; inflammation; stress.


Figures

Figure 1
Figure 1
The effects of stress on body weight (BW) in the control and stressed mice. A and B, Representative pictures and quantitative data showing the loss of subcutaneous fat and inguinal fat in the stressed mice (Student t test). C, The changes in BW during the 4‐week follow‐up period in both groups (2‐way repeated‐measures ANOVA and Bonferroni post hoc test). D, There were no significant differences in BW in the stress group mice (Student t test). Scar bar, 50 μm. Values are mean±SE (n=8–10). P<0.05 vs corresponding controls; NS indicates not significant; S‐Ana, stressed anagliptin treatment.
Figure 2
Figure 2
Chronic stress increased the blood and tissue DPP4 levels. A, The mouse/rat immobilized stress model. B through D, In the mice, the levels of DPP4 protein in the blood (B, Student t test), eight tissues (C, heart, lung, spleen, intestine, subcutaneous fat, inguinal fat, kidney, liver; ANOVA and Tukey's post hoc test), and brains (D, Student t test). E, The levels of DPP4 protein in the rat brains (Student t test). F, The changes in blood DPP4 levels during the follow‐up period (2‐way repeated‐measures ANOVA and Bonferroni post hoc test). Data are means±SEM (n=6–8). *P<0.01 vs controls; P<0.01 vs corresponding controls; DPP4 indicates dipeptidyl peptidase‐4; H&E, hematoxylin–eosin; NS, not significant.
Figure 3
Figure 3
Stress increased the CD26 protein expression in the brain. A, Routine H&E staining of the brain tissue samples of nonstressed and stress mice. B and C, Immunostaining with CD26 antibody showed the expression of CD26 in the brains and the BM of both experimental groups. Scale bar, 50 μm. BM indicates bone marrow; H&E, hematoxylin–eosin.
Figure 4
Figure 4
Chronic stress‐activated HSC proliferation in the bone marrow (BM). A, Gating for the enclosed 2 populations isolated from peripheral blood (PB) cells of 2 experimental groups (upper panels) and identifying for neutrophils as LyG6high CD11bhigh (top‐right quadrants) and subanalyzing LyG6lowLy6Chigh (bottom‐right quadrants) for monocytes as LyG6low CD11bhighF4/80lowLyChigh (lower panels). B, PB monocytes and neutrophil numbers in nonstressed (Cont) and stressed mice (Stress) mice after 4 weeks of stress (n=6–8, Student t test). C, BM monocytes and neutrophil numbers after 4 weeks of stress (n=6–8, Student t test). D, Representative histogram of DNA content during the cell cycle (left) and the distribution of S/M/G2 cells expressed as a percentage of total BM cells (right) (n=6–8, Mann–Whitney U test). E, Gating for the enclosed linsca‐1+c‐Kit+ cell (LSK) population isolated from BM cells of 2 experimental groups (upper panels) and subanalyzed linc‐KithighSca‐1high CD48low CD150high hematopoietic stem cell (HSC; lower panels). F, BM LSK and HSC numbers next to gates represent population frequencies (%) of nonstressed and stressed mice after 4 weeks of stress (n=6–8, Student t test). Data are mean±SEM. *P<0.01 vs nonstressed control mice; NS indicates not significant.
Figure 5
Figure 5
Chronic stress‐activated BM CD150+ cell proliferation. A and B, Representative images of the histograms and combined quantitative for the Ki67+/CD150+ cells in the bone marrow (BM) of the nonstressed and stressed mice. Values are mean±SEM (n=6, Student t test).
Figure 6
Figure 6
Chronic stress augmented colony‐forming capacity and Adrβ3 activity in BM sca‐1+ cells. A, First, 2×10⁴ BM sca‐1+ cells were seeded on a 3‐mm dish in duplicate and incubated for 7 days. Colonies were counted using a low‐magnification inverted microscope. Colony‐forming unit (CFU) assay showed an increased colony‐forming capacity of the sac‐1+ cells from stressed BM. B, The extracts of the sac‐1+ cells (100 μg/well) from the BM of nonstressed and stressed mice were subjected to an Adrβ3 ELISA. Stress had increased levels of Adrβ3 activity in the BM‐derived sac‐1+ cells. C, Following culturing in serum‐free DMEM overnight, the sac‐1+ cells were cultured in the presence and absence of the GLP‐1R agonist exenatide (5 nmol/L) for 24 h, and the levels of CXCL12 mRNA were analyzed by quantitative real‐time PCR. GLP‐1 had no effect on CXCL12 mRNA. Values are mean±SEM (n=5–8, Student t test). BM indicates bone marrow; CXCL12, C‐X‐C motif chemokine 12; GLP‐1, glucagon‐like peptide‐1; PCR, polymerase chain reaction.
Figure 7
Figure 7
Stress‐activated BM CD150+ HSC proliferation. A, Routine H&E staining on BM niche structures of control and stressed mice. B, Immunoreactive staining of BM niches for BrdU. Bar graphs: The percentage of positive cells (per 2×10² cells) (n=5, Student t test). C, Double immunofluorescence of the BM niches for PCNA (green) and CD150 (red). Bar graphs: The numbers of double‐positive PCNA + CD150+ cells (orange, n=6, Student t test). D, Double immunofluorescence of cultured BM cells for sca‐1 and Ki67. Bar graphs: The numbers of double‐positive sca‐1+Ki67+ cells (orange, n=6, Student t test). E, Representative Western images and quantitative data for brain GLP‐1R protein and Adrβ3 protein of BM sca‐1+ cells (n=3, Student t test). F, Quantitative real‐time PCR for CXCL12 mRNA in BM sca‐1+ cells of 2 experimental group mice (n=6, Student t test). G, Representative gelatin zymography images and quantitative data for MMP9 activity in BM sca‐1+ cells (n=3, Student t test). Data are mean±SEM. *P<0.01 vs control mice. Adrβ3 indicates adrenergic receptor β3; BM, bone marrow; BrdU, bromodeoxyuridine; CXCL12, C‐X‐C motif chemokine 12; GLP‐1R, glucagon‐like peptide‐1 receptor; H&E, hematoxylin and eosin; HSC, hematopoietic stem cells; MMP9, matrix metalloproteinase 9; PCR, polymerase chain reaction; PCNA, proliferating cell nuclear antigen.
Figure 8
Figure 8
DPP4 inhibition suppressed the activated HSC proliferation in the BM. A, Gating for the LSK cell population isolated from BM cells of stress‐alone (S) and stressed‐anagliptin treatment (S‐Ana) group mice (upper panels) and subanalyzed linc‐KithighSca‐1high CD48low CD150high HSC (lower panels). B, BM LSK and HSC numbers next to gates represent population frequencies (%) of 2 groups after 4 weeks of stress (n=6–8, Student t test). C, Ly6Chigh monocytes and neutrophils in the BM (n=6–8, Student t test). D, Gating for the enclosed 2 populations isolated from PB cells of 2 groups (upper panels) and identifying for neutrophils as LyG6high CD11bhigh (top‐right quadrants) and subanalyzing LyG6lowLy6Chigh (bottom‐right quadrants) for monocytes as LyG6low CD11bhighF4/80lowLyChigh (lower panels). E, PB monocytes and neutrophil numbers in 2 groups of mice after 4 weeks of stress (n=6–8, Student t test). F, Representative histogram of DNA content during the cell cycle (left) and the distribution of S/M/G2 cells expressed as a percentage of total BM cells (right) (n=5, Mann–Whitney U test). G, FACS analysis show the numbers of Ki67/+ CD150+ cells in the BM. Data are mean±SEM. *P<0.01 vs stressed‐alone control. BM indicates bone marrow; DPP4, dipeptidyl peptidase‐4; FACS, fluorescence activated cell sorter; HSC, hematopoietic stem cells; LSK, linsca‐1+c‐Kit+; PB, peripheral blood; S‐Ana, stressed‐exenatide treatment.
Figure 9
Figure 9
DPP4 inhibition rectified the stress‐induced BM CD150+ cell hyperproliferation. A, Quantitative data for the percentage of BrdU+ proliferating cells (per 2×10² BM cells) in the BM niches of 2 experimental group mice (n=5, Student t test). B, Double immunofluorescence of BM niches for proliferating CD150+ cells (PCNA + CD150+). Bar graphs: The numbers of double‐positive PCNA + CD150+ cells (n=6, Student t test). C, CXCL12 mRNA in BM sca‐1+ cells of the experimental group mice (n=6, Student t test). D, Representative Western blotting images and quantitative data for brain GLP‐1R protein and Adrβ3 protein of BM sca‐1+ cells (n=3, Student t test). E, Representative gelatin zymography images and quantitative data for MMP9 activity in BM sca‐1+ cells (n=3, Student t test). Data are mean±SEM. *P<0.01 vs stress‐alone control mice. Adrβ3 indicates adrenergic receptor β3; BM, bone marrow; BrdU, bromodeoxyuridine; CXCL12, C‐X‐C motif chemokine 12; DPP4, dipeptidyl peptidase‐4; GAPDH, glyceraldehyde 3‐phosphate dehydrogenase; GLP‐1R, glucagon‐like peptide‐1 receptor; MMP9, matrix metalloproteinase 9; PCNA, proliferating cell nuclear antigen; S‐Ana, stressed‐anagliptin treatment.
Figure 10
Figure 10
GLP‐1R stimulation redressed the activated CD150+ cell proliferation in response to stress. A, Gating for the LSK cell population isolated from BM cells of stress‐alone (S) and stressed‐exenatide treatment (S‐Ana) group mice (upper panels) and subanalyzed Linc‐KithighSca‐1high CD48low CD150high HSC (lower panels). B, BM LSK and HSC numbers next to gates represent population frequencies (%) of 2 experimental groups after 4 weeks of stress (n=6–8, Student t test). C, Quantitative data for the numbers of PCNA +/CD150+ cells in the BM niches. D, FACS analysis shows the numbers of Ki67/+ CD150+ cells in the BM. E, Representative histogram of DNA content during the cell cycle (left) and the distribution of S/M/G2 cells expressed as a percentage of total BM cells (right) (n=6, Mann–Whitney U test). F, Immunoreactive staining of BM niches for Adrβ3. Bar graphs: The percentage of positive area (mm2) (n=6 control, n=5 S‐Exe, Student t test). F, Representative Western bands for brain GLP‐1R protein expression. H, Representative gelatin zymography images for pro‐MMP9 and active‐form MMP9 activities in the BM sca‐1+ cells of the control and S‐Exe mice. Data are mean±SEM. *P<0.01 vs stress‐alone control mice. BM indicates bone marrow; FACS, fluorescence‐activated cell sorter; GLP‐1R, glucagon‐like peptide‐1 receptor; HSC, hematopoietic stem cells; LSK, linsca‐1+c‐Kit+; MMP9, matrix metalloproteinase 9; PCNA, proliferating cell nuclear antigen; S‐Ana, stressed anagliptin treatment; S‐Exe, stressed‐exenatide treatment.
Figure 11
Figure 11
DPP4−/− rectified the activated BM CD150+ cell proliferation in response to stress. A, Routine H&E staining on BM of stressed DPP4+/+ (WT) and DPP4−/− (KO) rats. B, Representative histogram of DNA content during the cell cycle (left) and the distribution of S/M/G2 cells expressed as a percentage of total BM cells (right) (n=5, Student t test). C, Immunoreactive staining of BM niches for PCNA. Bar graphs: Proliferating PCNA + cells (per 2×10² BM cells) (n=6, Student t test). Scale bars, 50 μm. D, Double immunofluorescence of BM niches for PCNA and CD150. Bar graphs: The numbers of double‐positive PCNA + CD150+ cells (orange; n=6, Student t test). Arrowheads indicate double PCNA+ and CD150+ cells. Scale bars, 50 μm. E, Quantitative data for the numbers of sca‐1+c‐Kit+‐positive cells in the BM niches of both groups (n=6, Student t test). Scale bars, 50 μm. F, The numbers of blood leukocytes and the percentage of blood neutrophils in both groups (n=6, stressed DPP4+/+ rats; n=8 stressed DPP4−/− rats; Student t test). G, Quantitative real‐time PCR for CXCL12 genes in the BM sca‐1+ cells (n=6, Student t test). H, Immunoreactive staining of BM niches for Adrβ3. Bar graphs: The percentage of positive area per mm2 (n=5, Student t test). Scale bars, 50 μm. I, Representative Western bands for brain GLP‐1R protein expression in both genotype rats. Data are mean±SE. *P<0.01 vs stress‐alone control rats. Adrβ3 indicates adrenergic receptor β3; BM, bone marrow; CXCL12, C‐X‐C motif chemokine 12; DPP4, dipeptidyl peptidase‐4; GLP‐1R, glucagon‐like peptide‐1 receptor; H&E, hematoxylin and eosin; PCNA, proliferating cell nuclear antigen; PCR, polymerase chain reaction.
Figure 12
Figure 12
DPP4 inhibition suppressed the activated HSC proliferation in the BM. A and B, BM LSKs and HSC numbers in the BM of stress‐alone (S) and stress+L748337 (S‐L74) mice after 4 weeks of stress (n=6, Student t test). C, Immunoreactive staining of BM niches for BrdU. Bar graphs: The percentage of positive cells (per 2×10² cells) (n=5, Student t test). D, CXCL12 mRNA in BM sca‐1+ cells of the experimental group mice (n=6, Student t test). Data are mean±SE. BM indicates bone marrow; BrdU, bromodeoxyuridine; CXCL12, C‐X‐C motif chemokine 12; DPP4, dipeptidyl peptidase‐4; GAPDH, glyceraldehyde 3‐phosphate dehydrogenase; HSC, hematopoietic stem cells; LSK, linsca‐1+c‐Kit+ cell.

References

    1. Gu HF, Tang CK, Yang YZ. Psychological stress, immune response, and atherosclerosis. Atherosclerosis. 2012;223:69–77. - PubMed
    1. Heidt T, Sager HB, Courties G, Dutta P, Iwamoto Y, Zaltsman A, von Zur Muhlen C, Bode C, Fricchione GL, Denninger J, Lin CP, Vinegoni C, Libby P, Swirski FK, Weissleder R, Nahrendorf M. Chronic variable stress activates hematopoietic stem cells. Nat Med. 2014;20:754–758. - PMC - PubMed
    1. Courties G, Herisson F, Sager HB, Heidt T, Ye Y, Wei Y, Sun Y, Severe N, Dutta P, Scharff J, Scadden DT, Weissleder R, Swirski FK, Moskowitz MA, Nahrendorf M. Ischemic stroke activates hematopoietic bone marrow stem cells. Circ Res. 2015;116:407–417. - PMC - PubMed
    1. Jing L, Tamplin OJ, Chen MJ, Deng Q, Patterson S, Kim PG, Durand EM, McNeil A, Green JM, Matsuura S, Ablain J, Brandt MK, Schlaeger TM, Huttenlocher A, Daley GQ, Ravid K, Zon LI. Adenosine signaling promotes hematopoietic stem and progenitor cell emergence. J Exp Med. 2008;212:649–663. - PMC - PubMed
    1. Tzeng YS, Li H, Kang YL, Chen WC, Cheng WC, Lai DM. Loss of Cxcl12/Sdf‐1 in adult mice decreases the quiescent state of hematopoietic stem/progenitor cells and alters the pattern of hematopoietic regeneration after myelosuppression. Blood. 2011;117:429–439. - PubMed

MeSH terms