. 2017 Sep 1;49(9):473-483.
doi: 10.1152/physiolgenomics.00043.2017. Epub 2017 Jul 14.

Relationships between gastrointestinal microbiota and blood group antigens

Affiliations

Relationships between gastrointestinal microbiota and blood group antigens

Anuhya Gampa et al. Physiol Genomics. .

Abstract

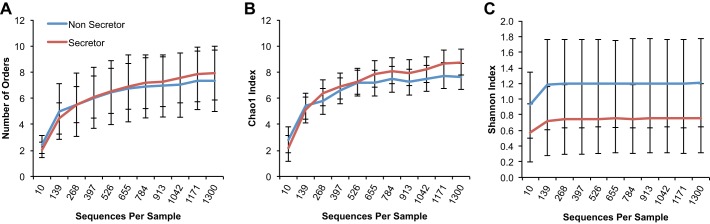
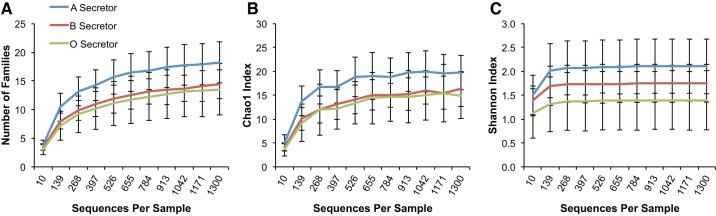
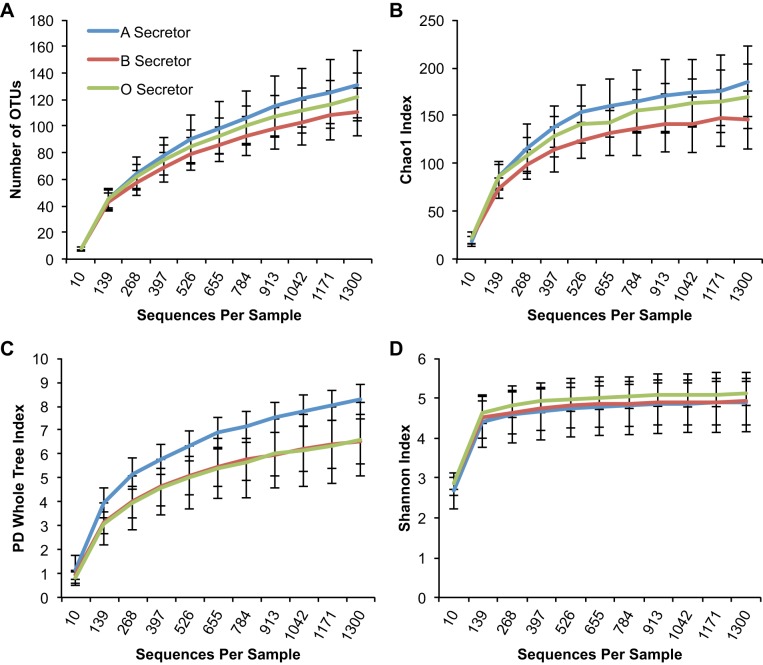
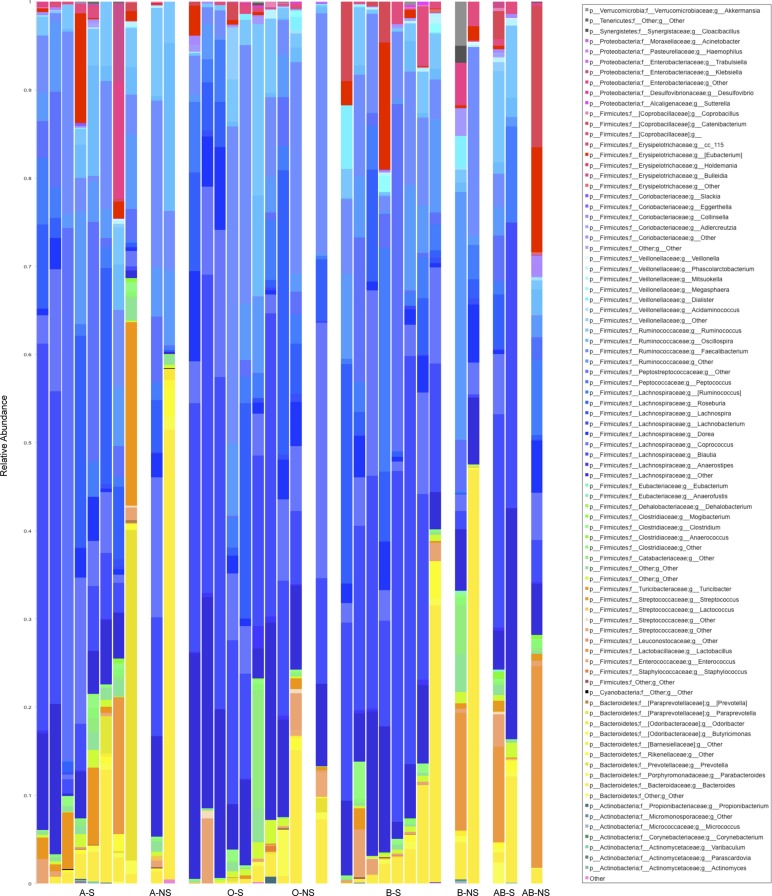
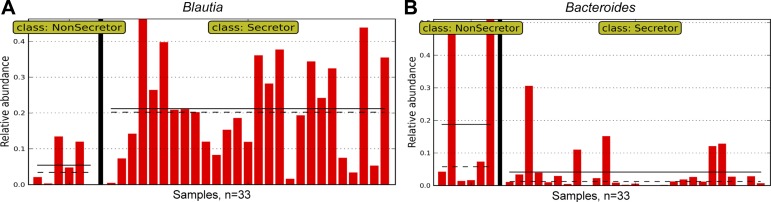
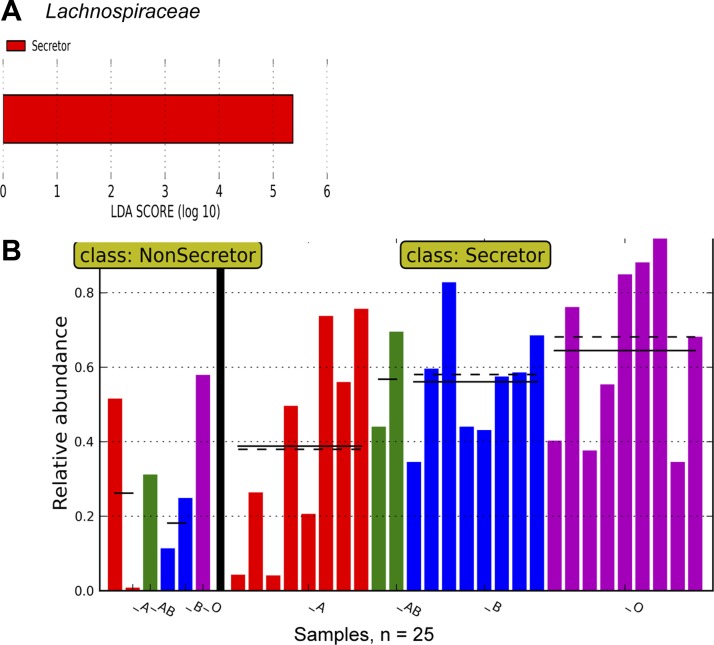
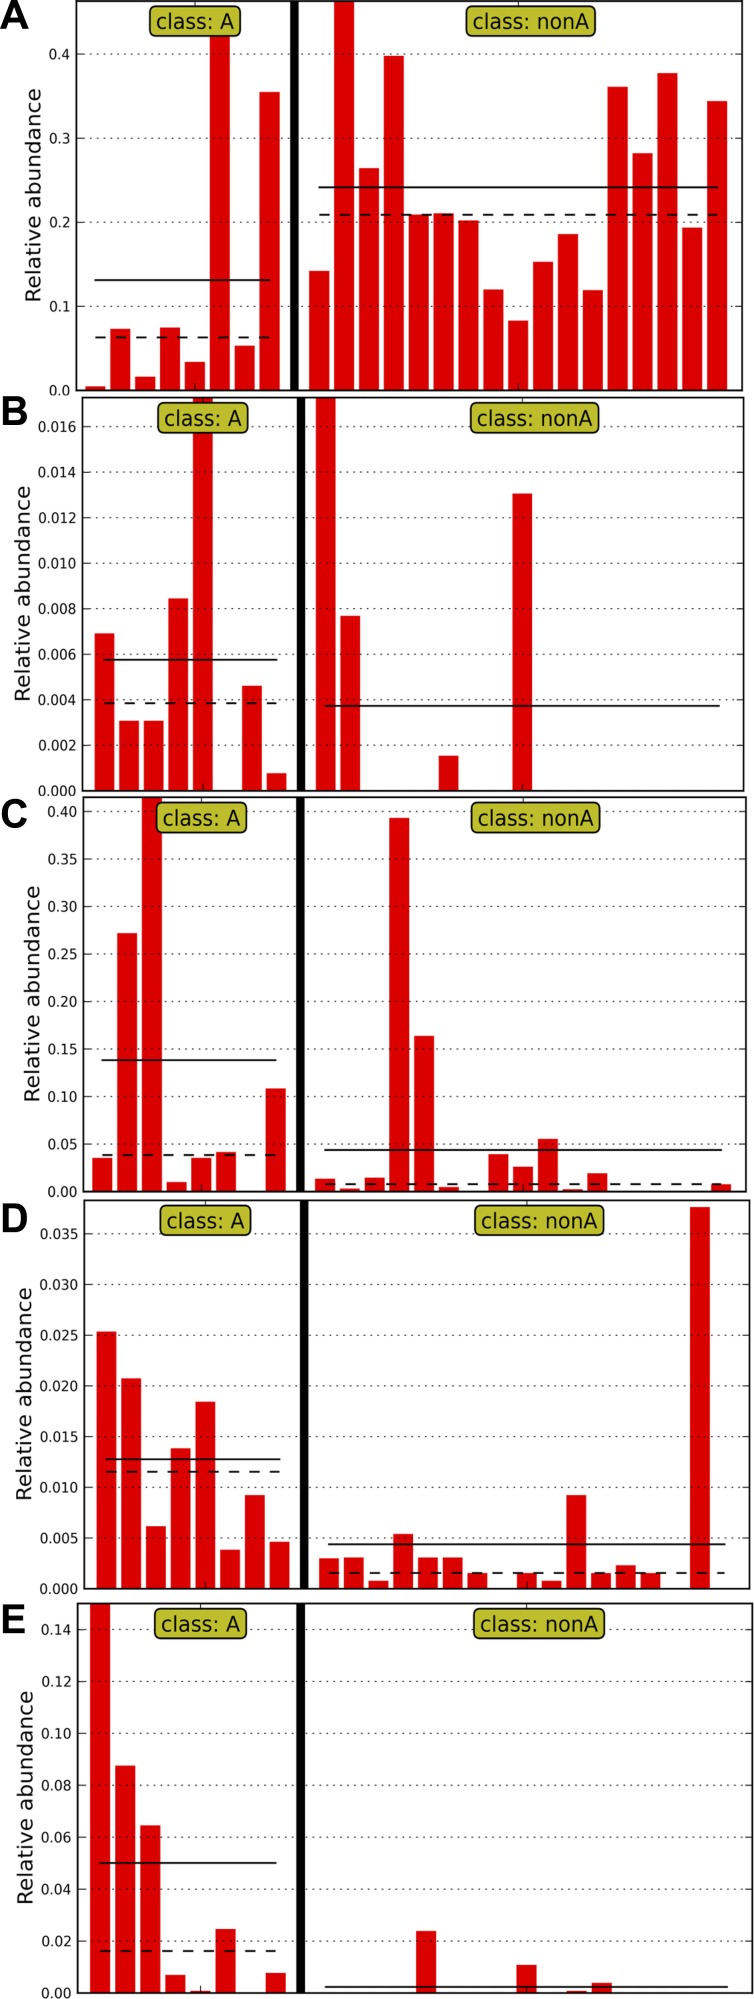
FUT2 is a gene for a fucosyltransferase that encodes expression of ABO blood group antigens found on gastrointestinal mucosa and secretions. We hypothesized that the fecal microbiomes of healthy subjects, with blood group antigens A, B, and O, have differing compositions. We analyzed 33 fecal and blood specimens from healthy subjects for FUT2 genotype, and the fecal microbiome was determined by 454 pyrosequencing. Our data show that being a blood group secretor is associated with less diversity at higher orders of taxonomy; and the presence of blood group A antigens in the secretor subjects are associated with an expansion families of bacteria within the gut. Furthermore, our study confirms the previous findings that secretors and nonsecretors have differing bacterial taxa. This extends the previous findings by demonstrating that the impact of being a nonsecretor is higher than that of individual blood group antigens. Additionally, we demonstrate that both secretor status and blood group antigen expression especially affect the Lachnospiraceae family of bacteria within the gut microbiome, with lower abundances noted in nonsecretors and higher abundances in secretors of various blood groups. We further note specific differences in blood group A-secretors demonstrating that the genus Blautia is lower in the group A-secretors compared with the non-A-secretors and that this reduction is accompanied by higher abundances of members of the Rikenellaceae, Peptostreptococcaceae, Clostridiales, and Turicibacter This study offers a first insight into the relationship between the fecal microbiome and blood group antigens in secretors.

Keywords: bacteria; blood group antigens; fucosyltransferase- FUT2; gastrointestinal microbiome; gastrointestinal secretions.


Figures

Fig. 1.
Fig. 1.
Shannon index trends higher in nonsecretors vs. secretors at the order level. y-Axis shows alpha diversity as assessed by the following indexes: Richness (i.e., total number of orders) (P > 0.05) (A), Chao1 index (P > 0.05) (B), and Shannon index (P = 0.069) (C). x-Axis depicts sequences per sample. Statistical comparisons were made at the maximum rarified depth.
Fig. 2.
Fig. 2.
Alpha diversity is higher in A-secretors vs. non-A-secretors at the family level. Among the secretor samples, blood group A-secretors have a significant increase in both the number of families and Chao1 index compared with blood group B- and O-secretors. y-Axis shows alpha diversity as assessed by the following indexes: Richness (i.e., total number of families) (P = 0.029) (A), Chao1 index (P = 0.044) (B), and Shannon index (P > 0.05) (C). x-Axis depicts sequences per sample. Statistical comparisons were made at the maximum rarified depth.
Fig. 3.
Fig. 3.
Phylogenetic diversity is higher in A-secretors vs. non-A-secretors at the Operational taxonomic unit (OTU) level. Among the secretor samples, blood group A-secretors have a significant increase in the Phylogenetic Diversity (PD)-Whole Tree index compared with blood group B- and O-secretors. y-Axis shows alpha diversity as assessed by the following indexes: Richness (i.e., total number of OTUs) (P > 0.05) (A), Chao1 index (P > 0.05) (B), PD-Whole Tree Index (P = 0.041) (C), Shannon index (P > 0.05) (D). x-Axis depicts sequences per sample. Statistical comparisons were made at the maximum rarified depth.
Fig. 4.
Fig. 4.
Stacked histogram of bacterial genera by secretor status and blood group. Each column in the stacked histogram represents 1 sample and has different color bars within it, and these bars are proportional to the percent relative bacterial abundance of each genera within the sample, summing up to 100%. y-Axis represents the relative abundance (i.e., percent abundance) of each genus. The order of samples is organized along the x-axis by blood group and secretor status: A-S (A-secretors); A-NS (A-nonsecretors); O-S (O-secretors); O-NS (O-nonsecretors); B-S (B-secretors); B-NS (B-nonsecretors); AB-S (AB-secretors); AB-NS (AB-nonsecretors) going from left to right of the graph. Total number of subjects is 33.
Fig. 5.
Fig. 5.
Boxplots of Unifrac distances between of secretors of the same blood group. A: unweighted Unifrac distances in the y-axis. B: weighted Unifrac distances in the y-axis. The distribution of distances between each pair of A-secretors (i.e., blood group A to blood group A secretor distances) is shown at left along the x-axis. The distribution of distances between each pair of B-secretors (i.e., blood group B to blood group B secretor distances) is shown in the mid part of the graph along the x-axis. The distribution of distances between each pair of O-secretors (i.e., blood group O to blood group O secretor distances) is shown right along the x-axis. Horizontal black lines reflect median values. Significant P values are shown only, by blue horizontal lines, and represent Student t-test results, adjusted for multiple comparisons using a Bonferroni correction.
Fig. 6.
Fig. 6.
Linear discriminant analysis effect size (LEFSE) analysis indicates genera associated with secretor status. The genus Blautia is more abundant in the secretors compared with nonsecretors; and the genus Bacteroides is more abundant in nonsecretors compared with secretors. Each column represents the relative abundance in a single sample. y-Axis represents the relative abundance (i.e., percent abundance) value. A: the relative abundance of Blautia in all samples. B: the relative abundance of Bacteroides in all samples. The nonsecretor subjects are shown to the left of the graph, and the secretor subjects are shown to the right. The continuous and dotted black horizontal lines represent mean and median abundance values, respectively.
Fig. 7.
Fig. 7.
LEFSE analysis by secretor status and blood group indicates a rise in Lachnospiraceae in secretors and variation in Lachnospiraceae abundance by blood group among the secretors. A: the results of LEFSE analysis when both secretor status (primary grouping) and blood group (subgrouping) are taken into account in the analysis, and the linear discriminant analysis (LDA) score (log 10) in secretors vs nonsecretors is shown, depicting an increased relative abundance of Lachnospiraceae. B: the relative abundance of Lachnospiraceae in all samples. Each column represents the relative abundance in a single sample. y-Axis represents the relative abundance (i.e., percent abundance) value. The nonsecretor subjects are shown to the left of the graph, and the secretor subjects are shown to the right. Samples from individuals with blood group A are colored red, those with blood group AB are colored green, those with blood group B are colored blue, and those with blood group O are colored magenta. Lachnospiraceae are least abundant in A-secretors with an increasing abundance in B-secretors and the highest abundance in O-secretors. The continuous and dotted black horizontal lines represent mean and median abundance values, respectively.
Fig. 8.
Fig. 8.
LEFSE analysis indicates bacterial taxa associated with A-secretors vs. non-A-secretors (i.e., B-secretors and O-secretors). In all of the panels, each column represents the relative abundance in a single sample, and the y-axis represents the relative abundance (i.e., percent abundance) value. Samples from subjects who are blood group A-secretors are shown to the left of the graph, and those from non-A-secretors (i.e., B-secretors and O-secretors) are shown to the right. The continuous and dotted black horizontal lines in each panel represent mean and median abundance values, respectively. A: within the family Lachnospiraceae, the genus Blautia is more abundant in the non-A-secretor samples compared with A-secretor samples. Conversely, genera within the Rikenellaceae family shown in B, genera within the Peptostreptococcaceae family shown in C, genera within the Clostridiales order shown in D, and Turicibacter shown in E are more abundant in A-secretor samples.

References

    1. Arumugam M, Raes J, Pelletier E, Le Paslier D, Yamada T, Mende DR, Fernandes GR, Tap J, Bruls T, Batto JM, Bertalan M, Borruel N, Casellas F, Fernandez L, Gautier L, Hansen T, Hattori M, Hayashi T, Kleerebezem M, Kurokawa K, Leclerc M, Levenez F, Manichanh C, Nielsen HB, Nielsen T, Pons N, Poulain J, Qin J, Sicheritz-Ponten T, Tims S, Torrents D, Ugarte E, Zoetendal EG, Wang J, Guarner F, Pedersen O, de Vos WM, Brunak S, Doré J, Antolín M, Artiguenave F, Blottiere HM, Almeida M, Brechot C, Cara C, Chervaux C, Cultrone A, Delorme C, Denariaz G, Dervyn R, Foerstner KU, Friss C, van de Guchte M, Guedon E, Haimet F, Huber W, van Hylckama-Vlieg J, Jamet A, Juste C, Kaci G, Knol J, Lakhdari O, Layec S, Le Roux K, Maguin E, Mérieux A, Melo Minardi R, M’rini C, Muller J, Oozeer R, Parkhill J, Renault P, Rescigno M, Sanchez N, Sunagawa S, Torrejon A, Turner K, Vandemeulebrouck G, Varela E, Winogradsky Y, Zeller G, Weissenbach J, Ehrlich SD, Bork P; MetaHIT Consortium . Enterotypes of the human gut microbiome. Nature 473: 174–180, 2011. doi: 10.1038/nature09944. - DOI - PMC - PubMed
    1. Caporaso JG, Bittinger K, Bushman FD, DeSantis TZ, Andersen GL, Knight R. PyNAST: a flexible tool for aligning sequences to a template alignment. Bioinformatics 26: 266–267, 2010. doi: 10.1093/bioinformatics/btp636. - DOI - PMC - PubMed
    1. Caporaso JG, Kuczynski J, Stombaugh J, Bittinger K, Bushman FD, Costello EK, Fierer N, Peña AG, Goodrich JK, Gordon JI, Huttley GA, Kelley ST, Knights D, Koenig JE, Ley RE, Lozupone CA, McDonald D, Muegge BD, Pirrung M, Reeder J, Sevinsky JR, Turnbaugh PJ, Walters WA, Widmann J, Yatsunenko T, Zaneveld J, Knight R. QIIME allows analysis of high-throughput community sequencing data. Nat Methods 7: 335–336, 2010. doi: 10.1038/nmeth.f.303. - DOI - PMC - PubMed
    1. Costello EK, Lauber CL, Hamady M, Fierer N, Gordon JI, Knight R. Bacterial community variation in human body habitats across space and time. Science 326: 1694–1697, 2009. doi: 10.1126/science.1177486. - DOI - PMC - PubMed
    1. Eckburg PB, Bik EM, Bernstein CN, Purdom E, Dethlefsen L, Sargent M, Gill SR, Nelson KE, Relman DA. Diversity of the human intestinal microbial flora. Science 308: 1635–1638, 2005. doi: 10.1126/science.1110591. - DOI - PMC - PubMed

Substances

LinkOut - more resources