. 2017 Aug 1;114(31):8259-8264.
doi: 10.1073/pnas.1704725114. Epub 2017 Jul 14.

Subunit conformational variation within individual GroEL oligomers resolved by Cryo-EM

Affiliations

Subunit conformational variation within individual GroEL oligomers resolved by Cryo-EM

Soung-Hun Roh et al. Proc Natl Acad Sci U S A. .

Abstract

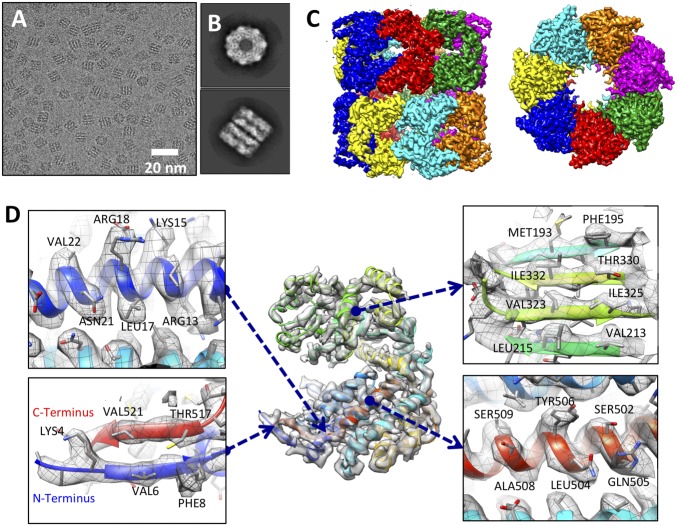
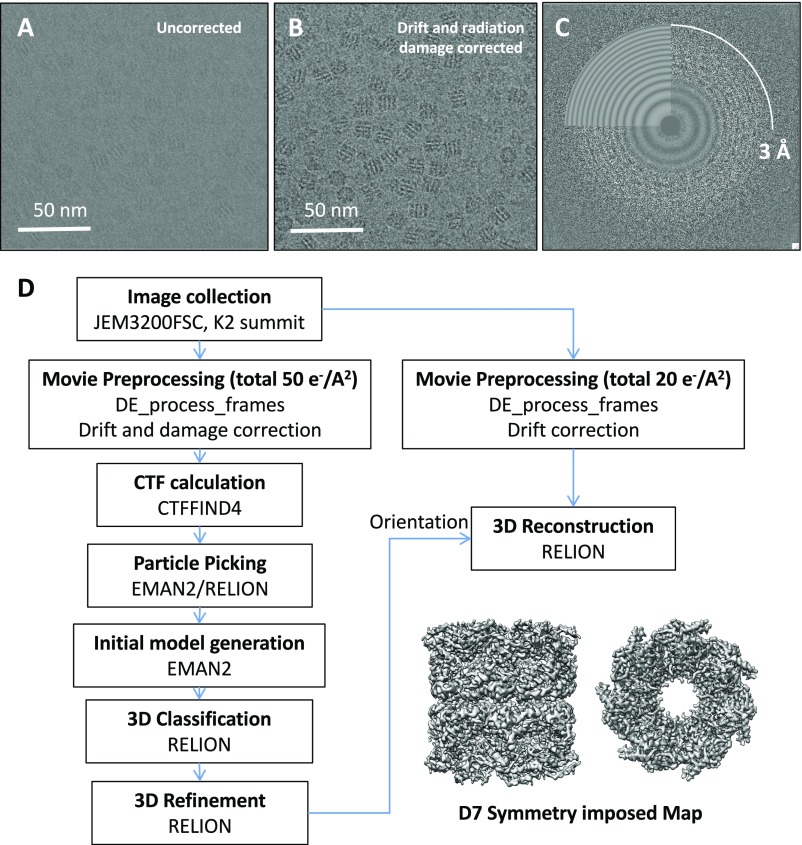
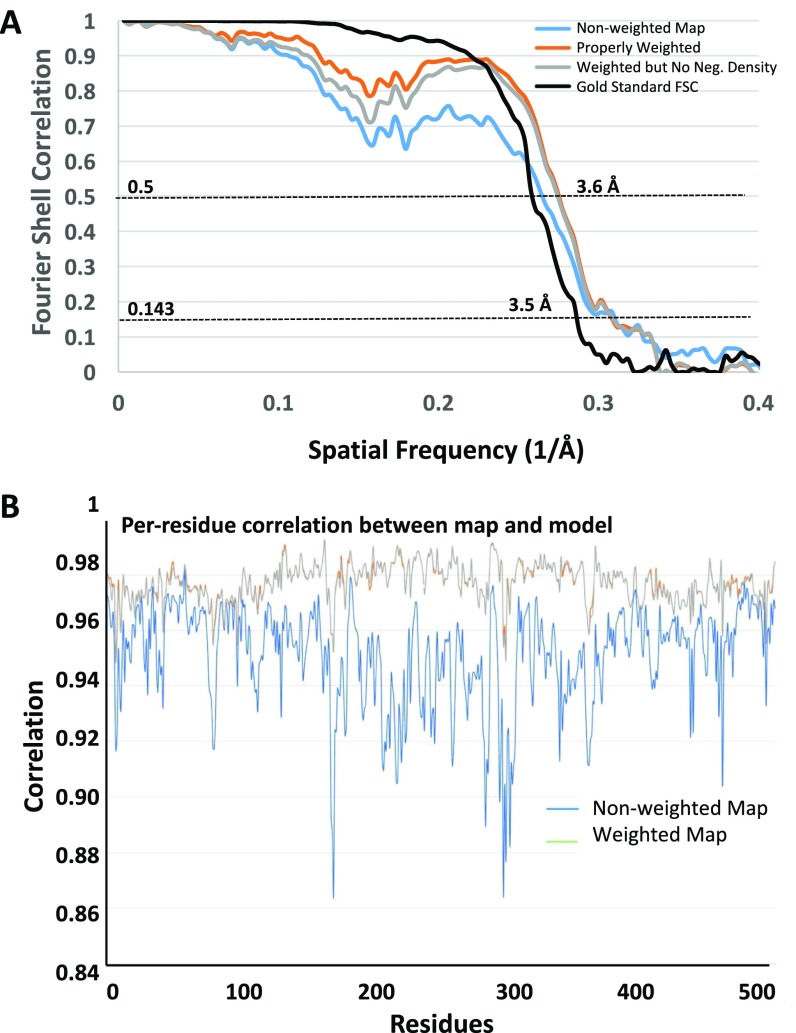
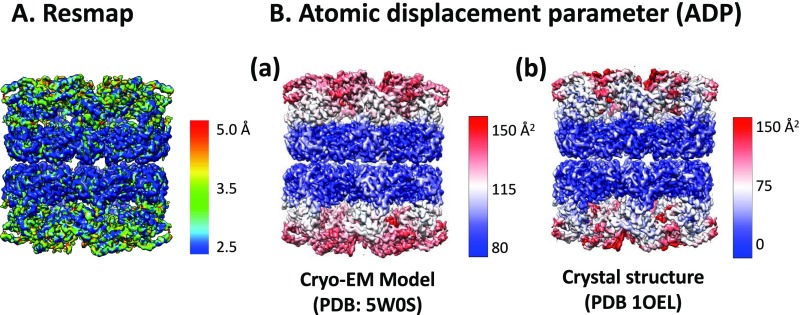
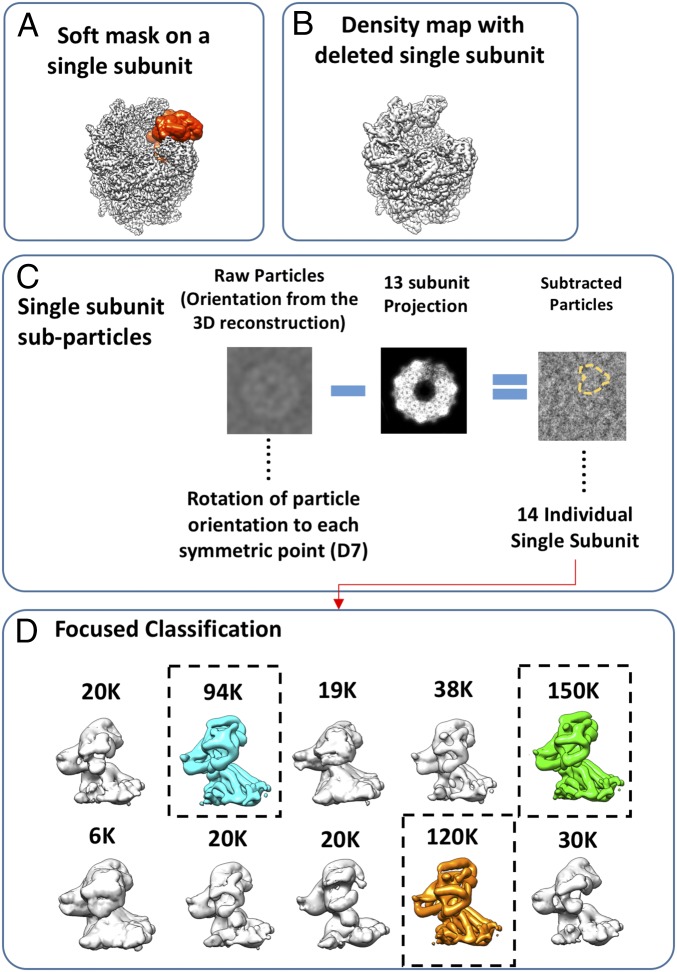
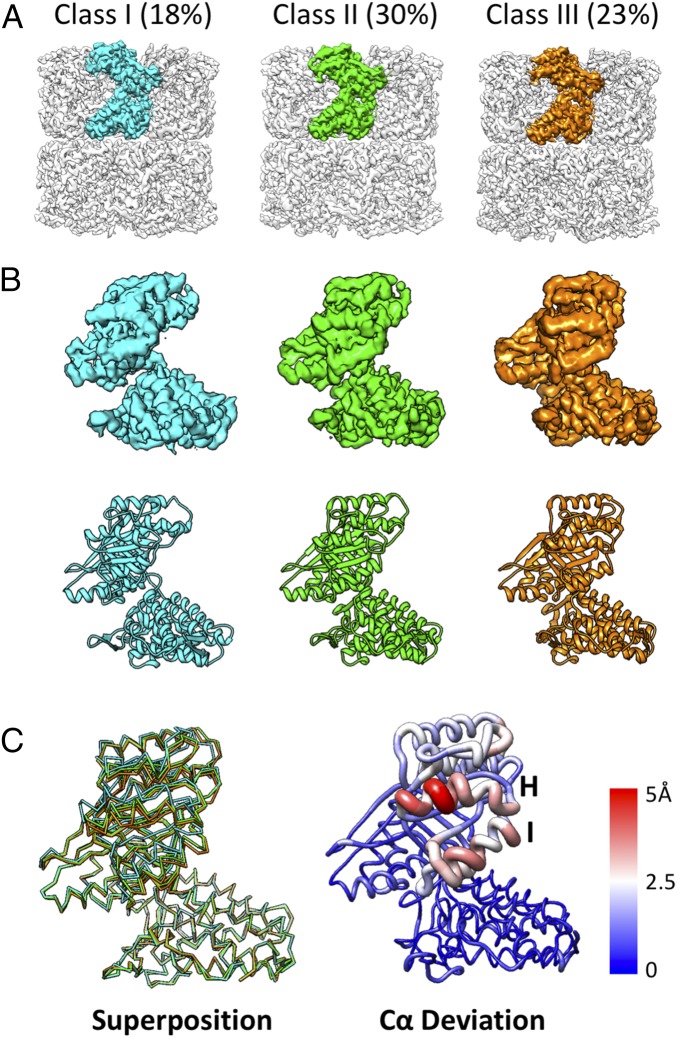
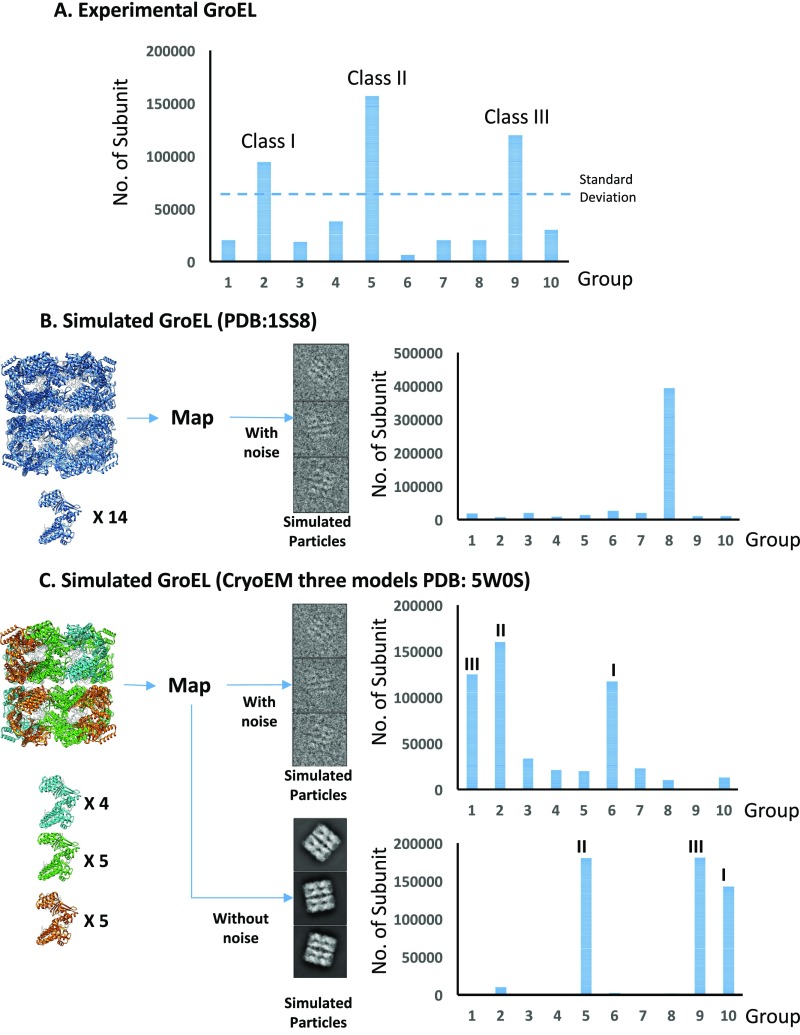
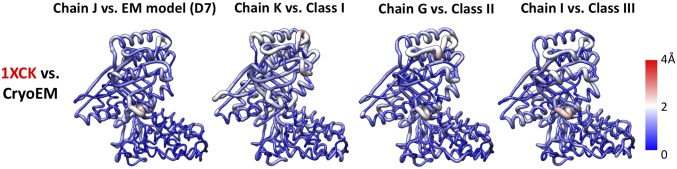
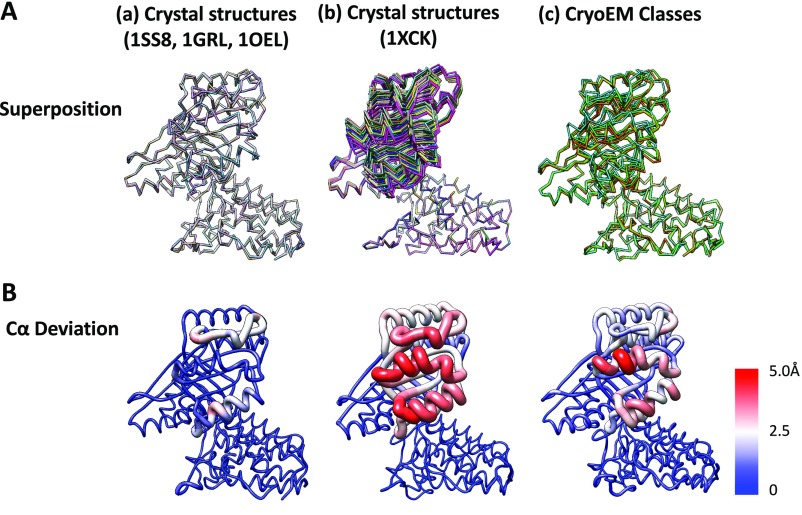
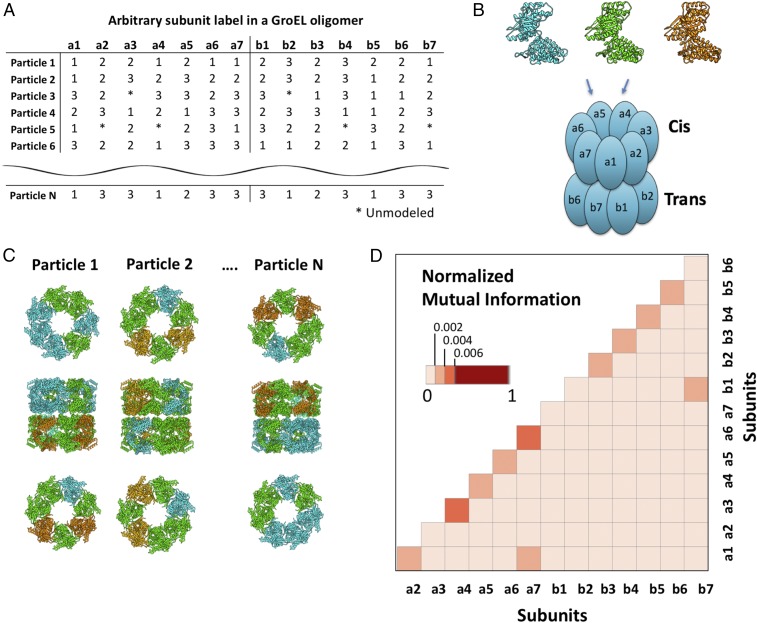
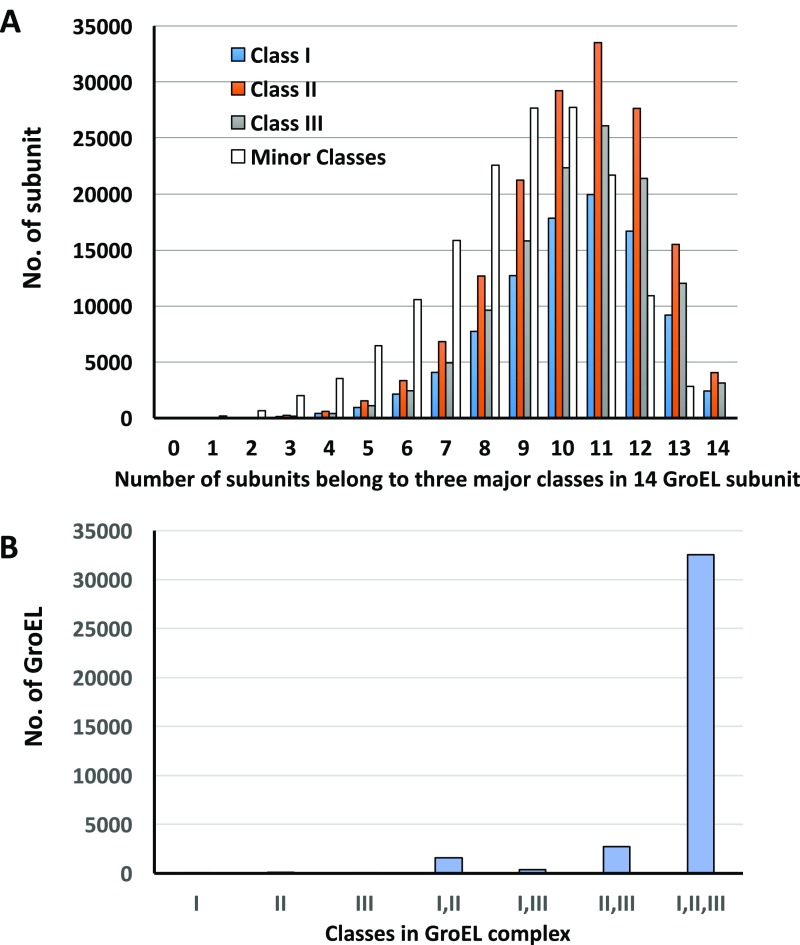
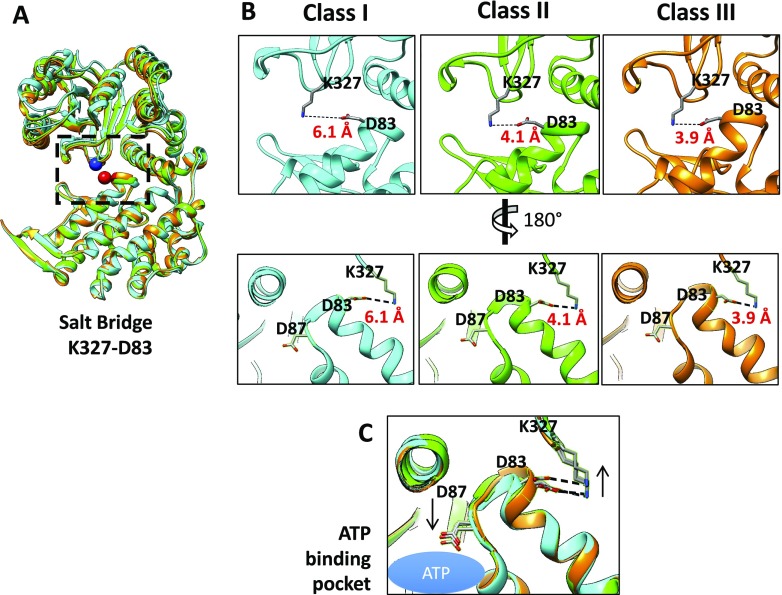
Single-particle electron cryo-microscopy (cryo-EM) is an emerging tool for resolving structures of conformationally heterogeneous particles; however, each structure is derived from an average of many particles with presumed identical conformations. We used a 3.5-Å cryo-EM reconstruction with imposed D7 symmetry to further analyze structural heterogeneity among chemically identical subunits in each GroEL oligomer. Focused classification of the 14 subunits in each oligomer revealed three dominant classes of subunit conformations. Each class resembled a distinct GroEL crystal structure in the Protein Data Bank. The conformational differences stem from the orientations of the apical domain. We mapped each conformation class to its subunit locations within each GroEL oligomer in our dataset. The spatial distributions of each conformation class differed among oligomers, and most oligomers contained 10-12 subunits of the three dominant conformation classes. Adjacent subunits were found to more likely assume the same conformation class, suggesting correlation among subunits in the oligomer. This study demonstrates the utility of cryo-EM in revealing structure dynamics within a single protein oligomer.

Keywords: atomic-model per-particle; chaperonin; conformational variation; cryo-EM; focused classification.


Conflict of interest statement

Conflict of interest statement: W.C. and K.H.D. are coauthors of a 2015 paper, which was a report of a community effort of different cryo-EM experts to evaluate the contrast transfer function parameter determination of different datasets of cryo-EM images using different software. They did not have any direct collaboration on this work.

Figures

Fig. 1.
Fig. 1.
Cryo-EM map and model of apo-GroEL. (A) A typical motion-corrected raw image of vitrified GroEL particles recorded on a Gatan K2 direct detector. (B) Reference-free 2D class averages for top and side views. (C) Side and end-on views of the 3.5-Å 3D cryo-EM map of apo-GroEL. Each subunit is colored differently (EMD-8750). (D) Segmented cryo-EM map for a single subunit with the model superimposed (PDB ID code 5W0S). Representative areas revealing high-resolution features are highlighted in the side panels.
Fig. S1.
Fig. S1.
A typical motion-corrected and radiation damage-compensated K2-summit image created using DE-process-frame.py. (A) Uncorrected sum image of a total dose of 50 e/A2. (B) Identical micrograph after drift correction and radiation damage weighting of frozen hydrated GroEL chaperonin. (C) Power spectrum of an image showing simulated contrast transfer function rings on the top left and experimental results. The rings extend to ∼3 Å. (D) A workflow diagram for the reconstruction of maps with imposed D7 symmetry. Early frame images with 20 e/A2 were used for the final map reconstruction (EMD-8750).
Fig. S2.
Fig. S2.
Gold standard FSC and map vs. model FSC. (A) Gold standard FSC curve showing 3.5 Å resolution at 0.143. The FSC between the 3.5-Å map and the refined model shows a similar resolution at 0.5. (B) Per-residue correlation between the map and the model.
Fig. S3.
Fig. S3.
Exploring the localized flexibility on the E. coli chaperonin GroEL. (A) Color-coded local resolution distribution for the 3.5-Å map created from experimental data. (B) Atomic displacement parameter: color-coded B-factor distribution of the 3.5-Å cryo-EM model (PDB ID code 5W0S) and the 2.8-Å crystal structure (PDB ID code 1OEL).
Fig. 2.
Fig. 2.
Single subunit focused 3D classification. (A) Location of the soft mask on a single subunit. (B) Density map with deleted single subunit. (C) Subtraction of the projection including 13 subunits from original particles resulted in single subunit subparticles. (D) Subunit-focused classification into 10 groups.
Fig. 3.
Fig. 3.
Conformational variants of GroEL subunits. (A) Focused classification and localized reconstruction resulted in three major converged classes of subunits with different populations. (B) Segmented subunit maps (EMD-8750) and respective model (PDB ID code 5W0S), rotated with respect to the view shown in A. (C) Superposition and C-alpha deviation distribution of the three classes derived from the cryo-EM map.
Fig. S4.
Fig. S4.
Detecting conformational variants of the E. coli chaperonin GroEL. (A) Focused classification resulted in three converged classes with different populations: class I, 18%; class II, 30%; class III, 23%; 29% of the total population was discarded because of low-resolution convergence. (B) An identical processing protocol used on simulated single-conformation data resulted in a single dominant population. (C) Identical processing of simulated data with three cryo-EM conformations resulted in three major populations; simulated particles with experimental noise (Top) and without noise (Bottom).
Fig. 4.
Fig. 4.
The three major conformational variants match conformations in the GroEL crystal structure. Distances between C-alphas matched between the cryo-EM models and selected crystal subunit structures from 1XCK.
Fig. S5.
Fig. S5.
Superposition and rmsd of cryo-EM classes and crystal structures. (A) Superposition and (B) rmsd of the C-alpha backbone of subunits in (a) three apo-GroEL crystal structures with imposed symmetry (PDB ID codes 1OEL, 1SS8, and 1GRL), and 14 different conformations in (b) 1XCK and (c) cryo-EM classes.
Fig. 5.
Fig. 5.
Structural correlation between adjacent subunits among conformational variants in a single apo-GroEL oligomer. (A) Subunit conformations for each GroEL particle. (B) Assembly of subunit conformations to the respective subunit location of each GroEL complex. (C) Models for one GroEL particle at a time. (D) Correlation based on normalized mutual information between pairs of subunits.
Fig. S6.
Fig. S6.
Subunit-based structural analysis. (A) Numbers of subunits in GroEL falling into the three major class conformations. (B) Composition of conformations in the single GroEL particles.
Fig. S7.
Fig. S7.
Apical domain flexibility is linked with chemical switches in apo-GroEL. (A) Three superimposed cryo-EM conformations and the locations of salt bridge between K327 (blue) and D83 (red). (B) Distance of each salt bridge in three cryo-M conformations. (C) Superposition of three cryo-EM models, showing the orientation change of D87 in the ATP-binding pocket according to the change in the salt bridge distance between K327 and D87.

References

    1. Libich DS, Fawzi NL, Ying J, Clore GM. Probing the transient dark state of substrate binding to GroEL by relaxation-based solution NMR. Proc Natl Acad Sci USA. 2013;110:11361–11366. - PMC - PubMed
    1. Fiaux J, Bertelsen EB, Horwich AL, Wüthrich K. NMR analysis of a 900K GroEL-GroES complex. Nature. 2002;418:207–211. - PubMed
    1. Cheng Y, Grigorieff N, Penczek PA, Walz T. A primer to single-particle cryo-electron microscopy. Cell. 2015;161:438–449. - PMC - PubMed
    1. Liao M, Cao E, Julius D, Cheng Y. Structure of the TRPV1 ion channel determined by electron cryo-microscopy. Nature. 2013;504:107–112. - PMC - PubMed
    1. Ludtke SJ, et al. De novo backbone trace of GroEL from single particle electron cryomicroscopy. Structure. 2008;16:441–448. - PubMed

Publication types

MeSH terms

Associated data