

Effects of Lipoic Acid on High-Fat Diet-Induced Alteration of Synaptic Plasticity and Brain Glucose Metabolism: A PET/CT and 13C-NMR Study
- PMID: 28710347
- PMCID: PMC5511189
- DOI: 10.1038/s41598-017-05217-z
Effects of Lipoic Acid on High-Fat Diet-Induced Alteration of Synaptic Plasticity and Brain Glucose Metabolism: A PET/CT and 13C-NMR Study
Abstract
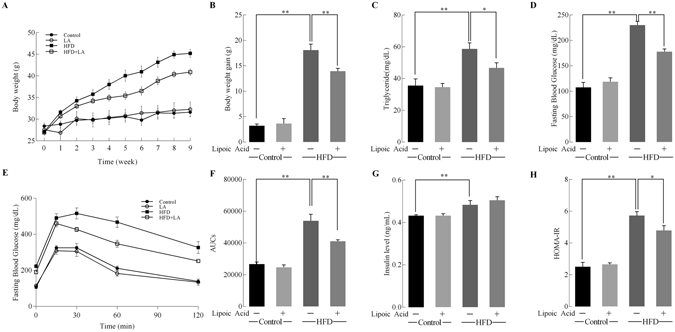
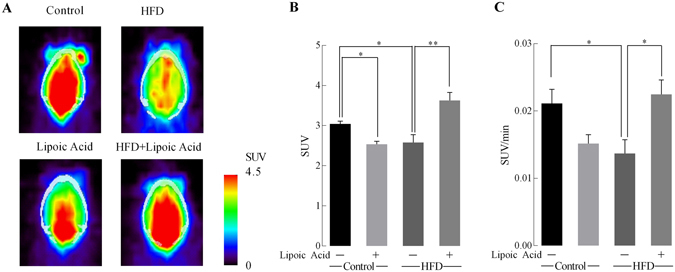
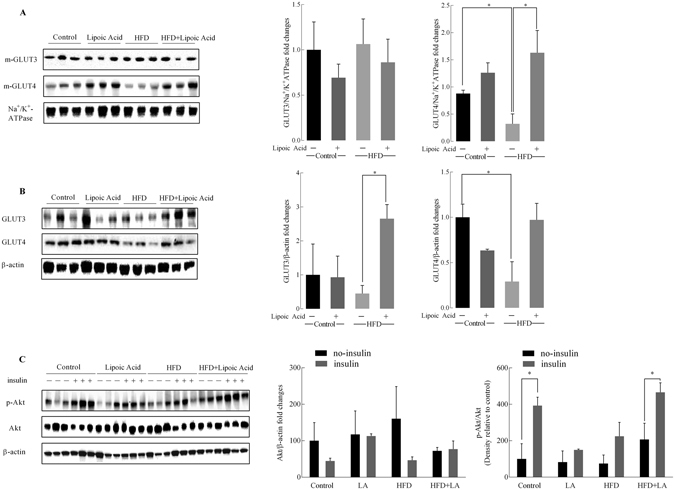
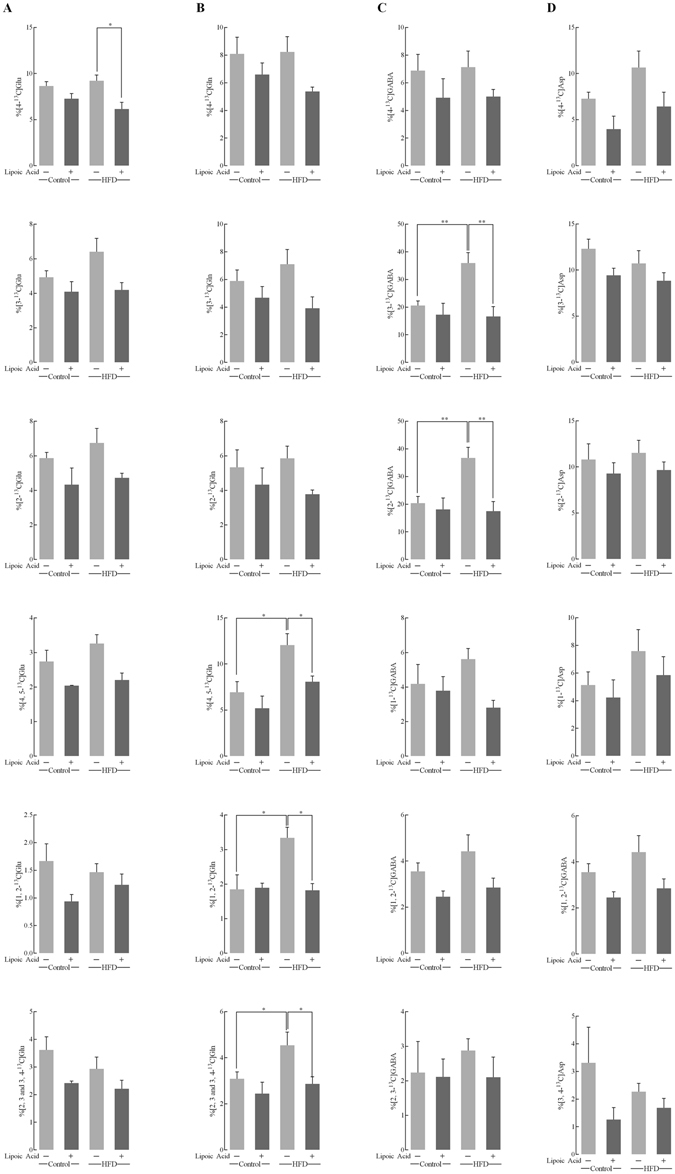
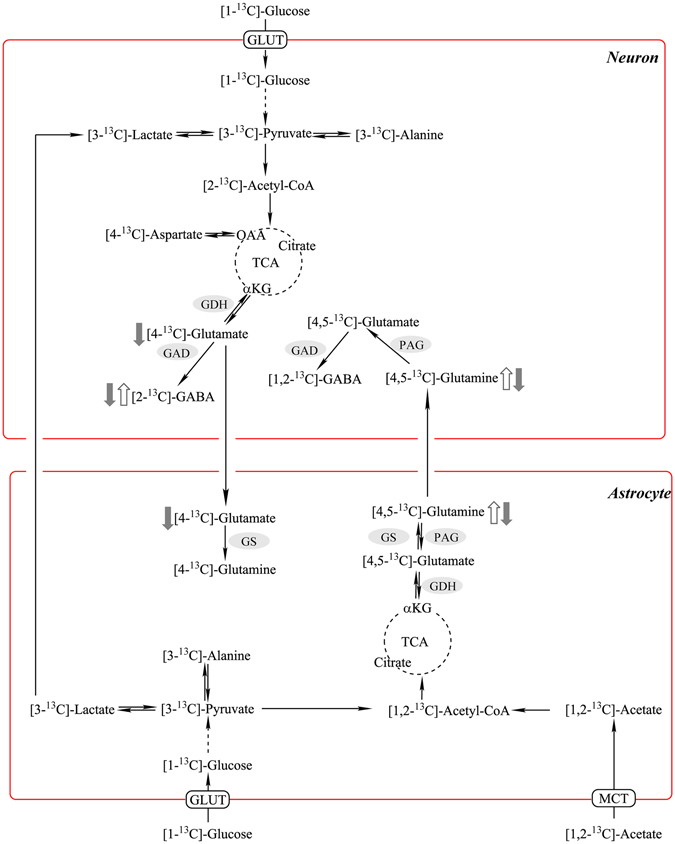
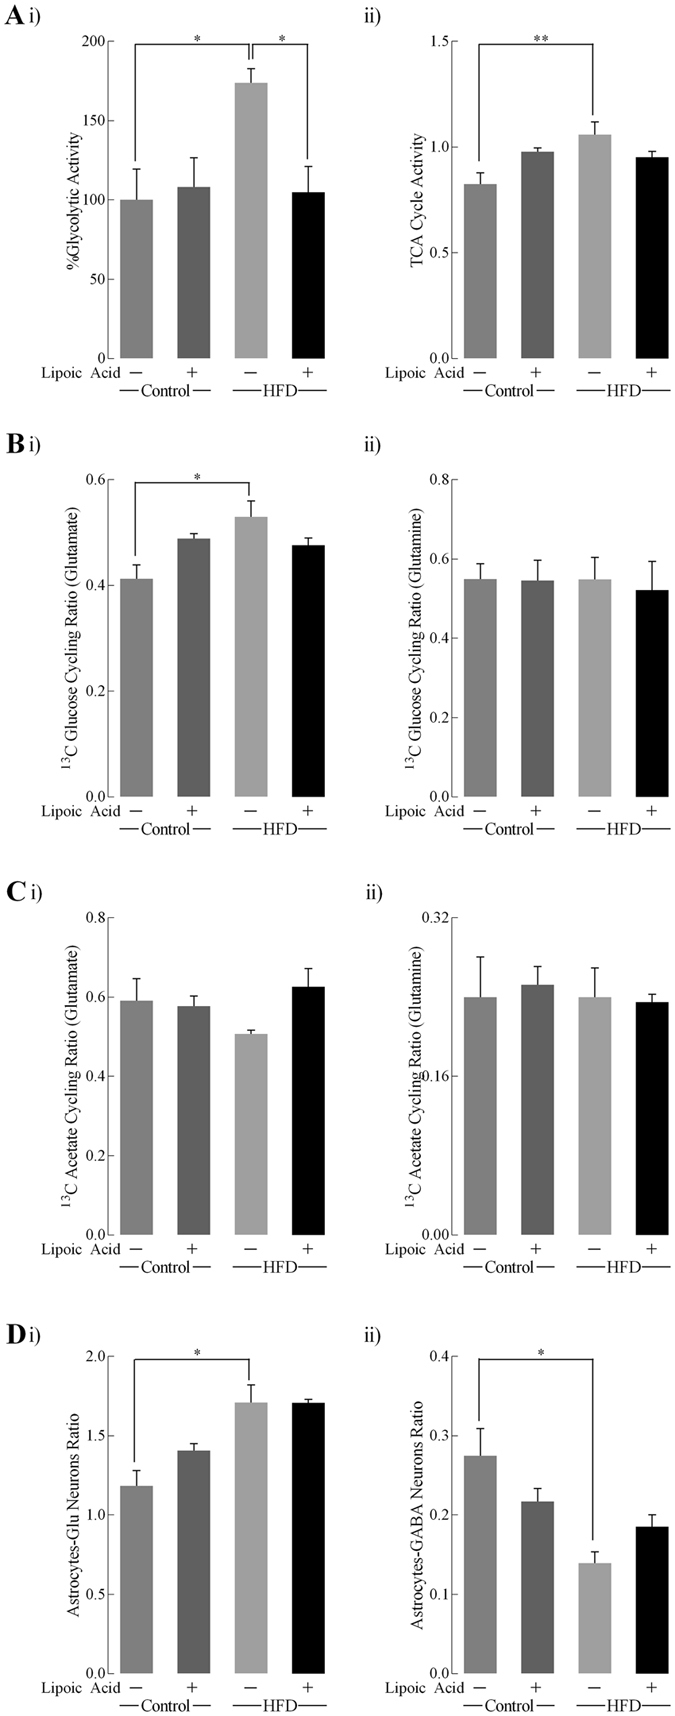
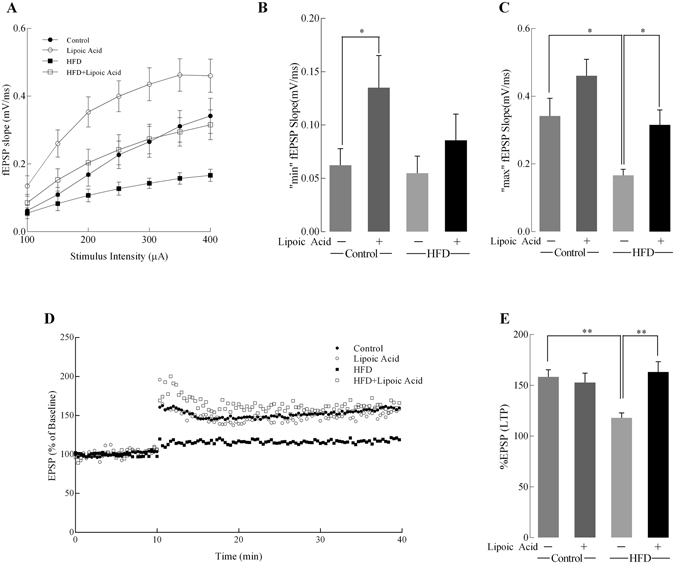
High-fat diet (HFD)-induced obesity is accompanied by insulin resistance and compromised brain synaptic plasticity through the impairment of insulin-sensitive pathways regulating neuronal survival, learning, and memory. Lipoic acid is known to modulate the redox status of the cell and has insulin mimetic effects. This study was aimed at determining the effects of dietary administration of lipoic acid on a HFD-induced obesity model in terms of (a) insulin signaling, (b) brain glucose uptake and neuronal- and astrocytic metabolism, and (c) synaptic plasticity. 3-Month old C57BL/6J mice were divided into 4 groups exposed to their respective treatments for 9 weeks: (1) normal diet, (2) normal diet plus lipoic acid, (3) HFD, and (4) HFD plus lipoic acid. HFD resulted in higher body weight, development of insulin resistance, lower brain glucose uptake and glucose transporters, alterations in glycolytic and acetate metabolism in neurons and astrocytes, and ultimately synaptic plasticity loss evident by a decreased long-term potentiation (LTP). Lipoic acid treatment in mice on HFD prevented several HFD-induced metabolic changes and preserved synaptic plasticity. The metabolic and physiological changes in HFD-fed mice, including insulin resistance, brain glucose uptake and metabolism, and synaptic function, could be preserved by the insulin-like effect of lipoic acid.
Conflict of interest statement
The authors declare that they have no competing interests.
Figures
Similar articles
-
High-fat diet induces hepatic insulin resistance and impairment of synaptic plasticity.PLoS One. 2015 May 29;10(5):e0128274. doi: 10.1371/journal.pone.0128274. eCollection 2015. PLoS One. 2015. PMID: 26023930 Free PMC article.
-
Alpha-lipoic acid attenuates insulin resistance and improves glucose metabolism in high fat diet-fed mice.Acta Pharmacol Sin. 2014 Oct;35(10):1285-92. doi: 10.1038/aps.2014.64. Epub 2014 Aug 25. Acta Pharmacol Sin. 2014. PMID: 25152027 Free PMC article.
-
The effect of dietary α-lipoic acid, betaine, l-carnitine, and swimming on the obesity of mice induced by a high-fat diet.Food Funct. 2014 Aug;5(8):1966-74. doi: 10.1039/c4fo00246f. Food Funct. 2014. PMID: 24973338
-
Synaptic energy metabolism and neuronal excitability, in sickness and health.J Inherit Metab Dis. 2019 Mar;42(2):220-236. doi: 10.1002/jimd.12071. J Inherit Metab Dis. 2019. PMID: 30734319 Review.
-
Obesity Control and Supplementary Nutraceuticals as Cofactors of Brain Plasticity in Multiple Sclerosis Populations.Int J Mol Sci. 2024 Oct 10;25(20):10909. doi: 10.3390/ijms252010909. Int J Mol Sci. 2024. PMID: 39456690 Free PMC article. Review.
Cited by
-
Functional consequences of brain exposure to saturated fatty acids: From energy metabolism and insulin resistance to neuronal damage.Endocrinol Diabetes Metab. 2023 Jan;6(1):e386. doi: 10.1002/edm2.386. Epub 2022 Nov 2. Endocrinol Diabetes Metab. 2023. PMID: 36321333 Free PMC article. Review.
-
Alpha lipoic acid supplementation ameliorates the wrath of simulated tropical heat and humidity stress in male Murrah buffaloes.Int J Biometeorol. 2019 Oct;63(10):1331-1346. doi: 10.1007/s00484-019-01750-w. Epub 2019 Jul 6. Int J Biometeorol. 2019. PMID: 31280374
-
Brain Energy Metabolism in Ischemic Stroke: Effects of Smoking and Diabetes.Int J Mol Sci. 2022 Jul 31;23(15):8512. doi: 10.3390/ijms23158512. Int J Mol Sci. 2022. PMID: 35955647 Free PMC article. Review.
-
Acupuncture Interventions for Alzheimer's Disease and Vascular Cognitive Disorders: A Review of Mechanisms.Oxid Med Cell Longev. 2022 Sep 28;2022:6080282. doi: 10.1155/2022/6080282. eCollection 2022. Oxid Med Cell Longev. 2022. PMID: 36211826 Free PMC article. Review.
-
Gut microbiota mediates intermittent-fasting alleviation of diabetes-induced cognitive impairment.Nat Commun. 2020 Feb 18;11(1):855. doi: 10.1038/s41467-020-14676-4. Nat Commun. 2020. PMID: 32071312 Free PMC article.
References
-
- Patel, M. S. & Packer, L. (CRC Press, Taylor & Francis Group, Boca Raton, 2008).
Publication types
MeSH terms
Substances
Grants and funding
LinkOut - more resources
Full Text Sources
Other Literature Sources
Medical
