. 2017 Jul 14;7(1):5424.
doi: 10.1038/s41598-017-05838-4.

Assuring quality in microplastic monitoring: About the value of clean-air devices as essentials for verified data

Affiliations

Assuring quality in microplastic monitoring: About the value of clean-air devices as essentials for verified data

Charlotte Wesch et al. Sci Rep. .

Abstract

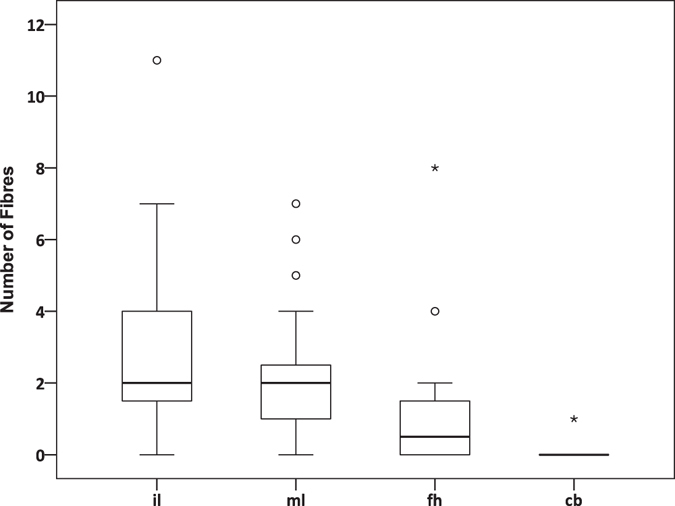
Avoiding aerial microfibre contamination of environmental samples is essential for reliable analyses when it comes to the detection of ubiquitous microplastics. Almost all laboratories have contamination problems which are largely unavoidable without investments in clean-air devices. Therefore, our study supplies an approach to assess background microfibre contamination of samples in the laboratory under particle-free air conditions. We tested aerial contamination of samples indoor, in a mobile laboratory, within a laboratory fume hood and on a clean bench with particles filtration during the examining process of a fish. The used clean bench reduced aerial microfibre contamination in our laboratory by 96.5%. This highlights the value of suitable clean-air devices for valid microplastic pollution data. Our results indicate, that pollution levels by microfibres have been overestimated and actual pollution levels may be many times lower. Accordingly, such clean-air devices are recommended for microplastic laboratory applications in future research work to significantly lower error rates.


Conflict of interest statement

The authors declare that they have no competing interests.

Figures

Figure 1
Figure 1
Number of aerial microfibres monitored in the samples. The boxplots show the number of airborne fibres detected in the samples belonging to the four different setups (il = indoor laboratory; ml = mobile laboratory; fh = laboratory fume hood; cb = clean bench with particle filtration). The boxes cover the 25th and 75th percentile, including the median (horizontal line). The whiskers are set to default representing ±1.5*IQR (interquartile range).
Figure 2
Figure 2
Percentage of samples with microfibre contamination. The figure shows the percentage of samples found with microfibre contamination indoor, in the mobile laboratory, the fume hood and on the clean bench with particle filtration. The number of samples exposed to the four different setups are represented as well. The entire list of samples exposed to the different setups can be found as Supplementary Tables S1 and S2.
Figure 3
Figure 3
Image of a typical laboratory fume hood. A fume hood is a ventilated enclosure that provides protection of the operator and the environment from particularly hazardous substances like fumes, vapours, dusts and gases. During processing, ambient air flows into the fume hood through a vertically movable front sash (1). The unfiltered air flows across the work surface, over the sample (2) and circulates in the workspace (3). Air and all airborne contaminants are directed through an air exhaust duct (4) into the exhaust fan (5) and suctioned out of the fume hood.
Figure 4
Figure 4
Image of a laboratory clean bench with particles- and activated carbon filtration. Clean benches provide a particle-filtered environment to protect samples from aerial contamination. Ambient air with floatable particles (black arrows) and filtered pure air (white arrows) are transported to suction slots (1) and passed through an activated carbon filter (2). Cleaned air is drawn by a radial fan (3) and pressed through a particle filter (Hosch-Filter) into the workspace (4). The filtered pure air flows gently (laminar flow) across the work surface over the sample (5) and towards the operator and then back into the suction slots.
Figure 5
Figure 5
Linear regression analysis. Correlation between the number of fibres recovered on the filter papers and the time of exposure indoor (left) and in the mobile laboratory (right).
Figure 6
Figure 6
Optical image and spectra of an aerial fibre identified as polypropylene. The figure shows an optical image (a) with a corresponding FTIR chemical image integrated at 2800–3000 cm−1 (b). Image c is showing a fibre spectra (green) with its corresponding spectra (black; PP reference).
Figure 7
Figure 7
Optical image and spectra of an aerial fibre identified as polyacrylonitrile. The figure shows an optical image of a microfibre (a) with its corresponding FTIR chemical image (b), showing the PAN fibre at integration 2200–2300 cm−1. Image c shows the PAN reference spectrum (black) and the fibre’s spectrum (light blue).
Figure 8
Figure 8
Optical image and spectra of an aerial fibre identified as cellophane. The figure shows an optical image of a microfibre (a) with corresponding FTIR chemical image (b), showing the studied fibre at integration 3000–2900 cm−1. CMC (red) and cellophane (blue) reference spectra with black corresponding to a microfibre (c).

References

    1. Arthur, C. Baker, J. & Bamford, H. Proceedings of the International Research Workshop on the Occurrence, Effects, and Fate of Microplastic Marine Debris. Sept 9-11, 2008. NOAA Technical Memorandum NOS-OR&R-30. (2009).
    1. MSFD Technical Subgroup of Marine Litter. Guidance on Monitoring of Marine Litter in European Seas. JRC - Joint Research Centre. EUR 26113 EN (2013).
    1. Ivar do Sul JA, Costa MF. The present and future of microplastic pollution in the marine environment. Environmental Pollution (Barking, Essex: 1987) 2014;185:352–364. doi: 10.1016/j.envpol.2013.10.036. - DOI - PubMed
    1. Wright SL, Thompson RC, Galloway TS. Environmental Pollution (Barking, Essex: 1987) 2013. The physical impacts of microplastics on marine organisms: a review; pp. 483–492. - PubMed
    1. Frias JPGL, Gago J, Otero V, Sobral P. Microplastics in coastal sediments from Southern Portuguese shelf waters. Marine Environmental Research. 2016;114:24–30. doi: 10.1016/j.marenvres.2015.12.006. - DOI - PubMed

Publication types

LinkOut - more resources