. 2017 Jul 14;7(1):5520.
doi: 10.1038/s41598-017-05716-z.

Epithelial-derived IL-33 promotes intestinal tumorigenesis in Apc Min/+ mice

Affiliations

Epithelial-derived IL-33 promotes intestinal tumorigenesis in Apc Min/+ mice

Zhengxiang He et al. Sci Rep. .

Abstract

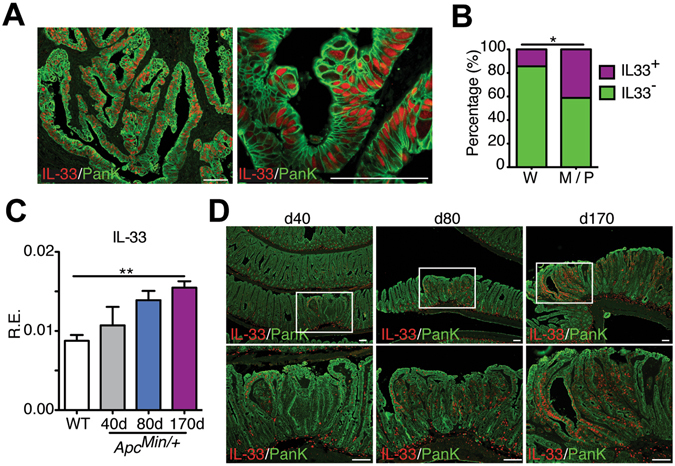
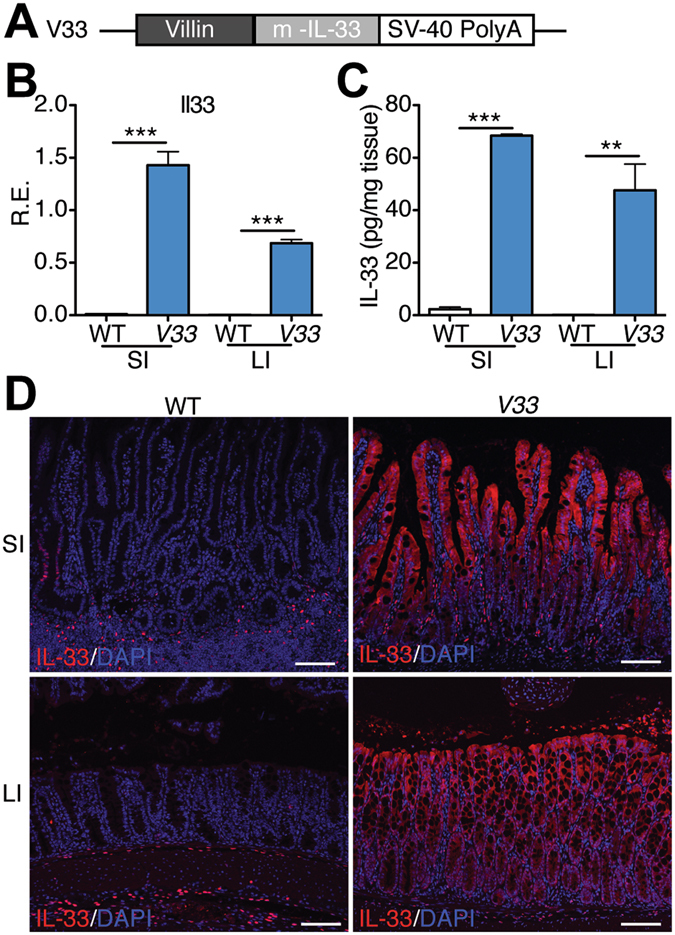
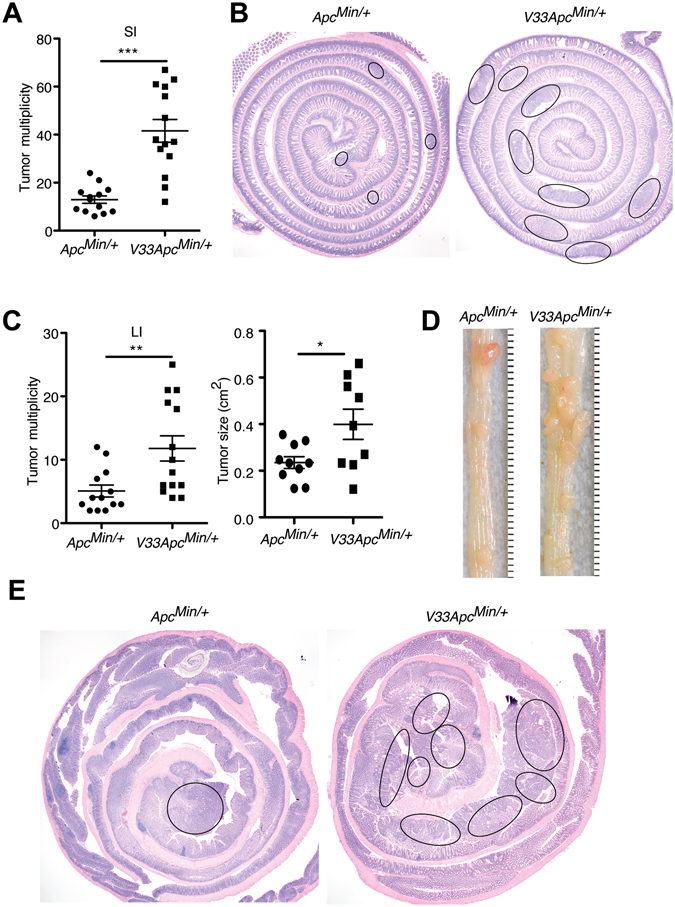
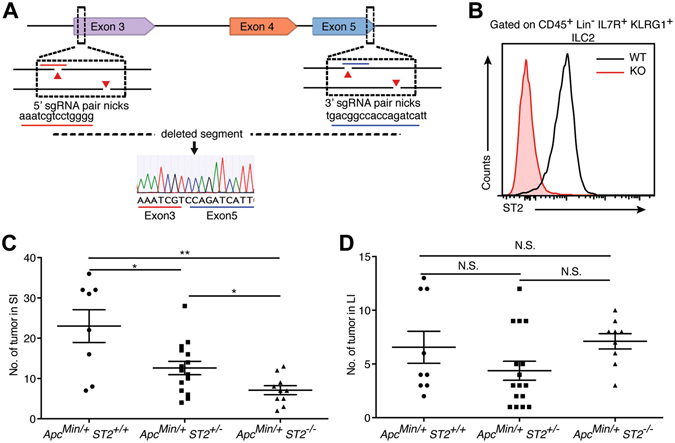
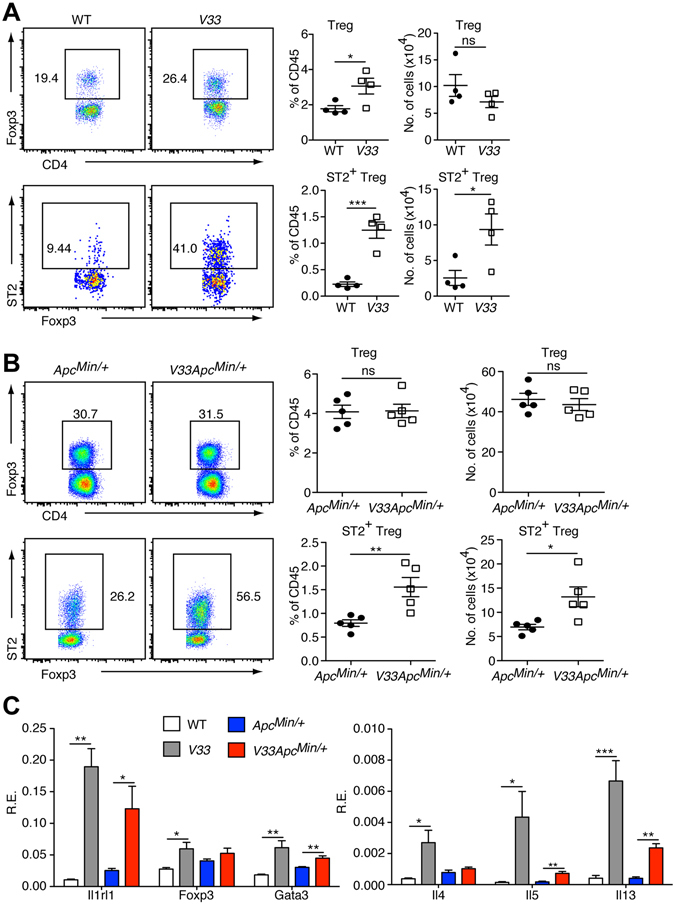
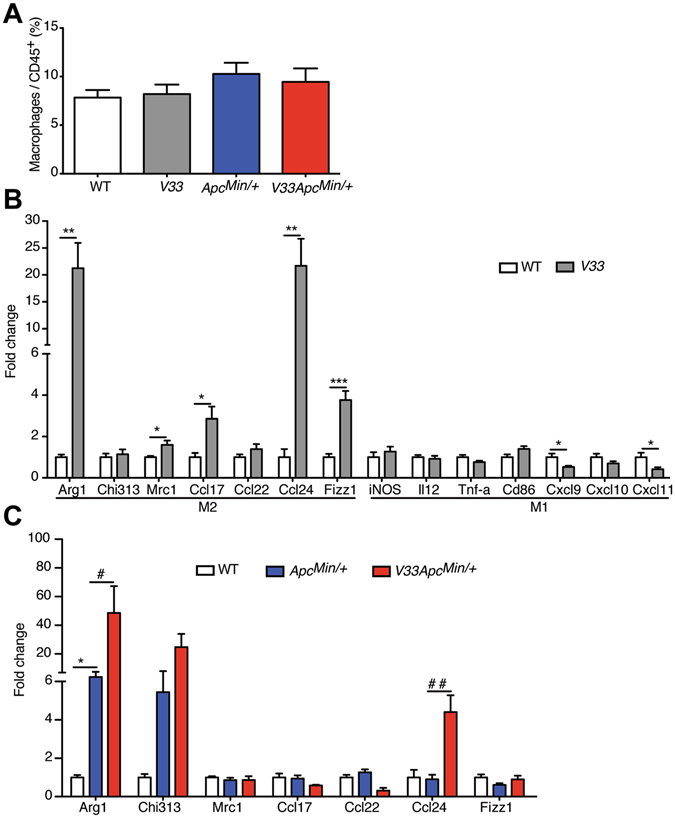
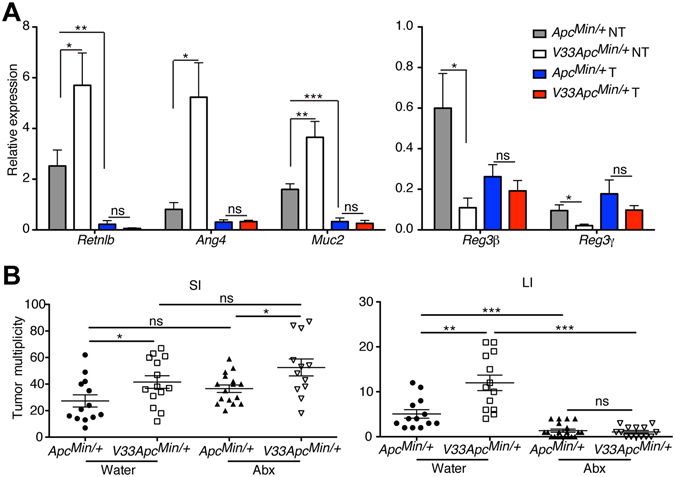
Increased expression of Interleukin (IL)-33 has been detected in intestinal samples of patients with ulcerative colitis, a condition associated with increased risk for colon cancer, but its role in the development of colorectal cancer has yet to be fully examined. Here, we investigated the role of epithelial expressed IL-33 during development of intestinal tumors. IL-33 expression was detected in epithelial cells in colorectal cancer specimens and in the Apc Min/+ mice. To better understand the role of epithelial-derived IL-33 in the intestinal tumorigenesis, we generated transgenic mice expressing IL-33 in intestinal epithelial cells (V33 mice). V33 Apc Min/+ mice, resulting from the cross of V33 with Apc Min/+ mice, had increased intestinal tumor burden compared with littermate Apc Min/+ mice. Consistently, Apc Min/+ mice deficient for IL-33 receptor (ST2), had reduced polyp burden. Mechanistically, overexpression of IL-33 promoted expansion of ST2+ regulatory T cells, increased Th2 cytokine milieu, and induced alternatively activated macrophages in the gut. IL-33 promoted marked changes in the expression of antimicrobial peptides, and antibiotic treatment of V33 Apc Min/+ mice abrogated the tumor promoting-effects of IL-33 in the colon. In conclusion, elevated IL-33 signaling increases tumor development in the Apc Min/+ mice.


Conflict of interest statement

The authors declare that they have no competing interests.

Figures

Figure 1
Figure 1
IL-33 expression in human colorectal cancer patients and in Apc Min/+ mice model. (A) Paraffin sections from a tissue microarray of human colorectal cancer (CRC) patients were stained with IL-33 (red) and Pan keratin (green). Representative photographs show expression of IL-33 by intestinal epithelial cells (IECs) in poorly differentiated adenocarcinomas. Scale bars, 100 μm. (B) The percentage of IL-33 immunolabeling in the IECs from 21 well-differentiated CRC patients (W) and 68 moderate- and poor-differentiated CRC patients (M/P). *P < 0.05, Fisher exact test. (C) Relative expression levels of IL-33 mRNA were analyzed by qPCR in the gut of Apc Min/+ mice at various ages. Data were normalized to the expression levels of the Ubiquitin transcript. Means ± s.e.m., n = 4 per group. **P < 0.01, nonparametric Mann-Whitney test. (D) Immunofluorescence staining for IL-33 (red) and Pan keratin (green) in Apc Min/+ mice at different ages. Zoomed-in boxed area shows IL-33 immunolabeling in the IECs in Apc Min/+ mice. Scale bars, 50 μm.
Figure 2
Figure 2
Generation of transgenic mice expressing IL-33 in the gut epithelium. (A) Scheme for generation of V33 mice. A transgene encoding IL-33 mature form (m-IL-33) under the control of the murine villin promoter (9 kb) was used to generate V33 mice. (B) Relative expression levels of transgenic IL-33 mRNA were analyzed by qPCR in the small intestine (SI) and large intestine (LI) of wild-type (WT) and V33 mice. Data were normalized to the expression levels of the Ubiquitin transcript. Means ± s.e.m., n = 6 per group. ***P < 0.001, one-way ANOVA. (C) Enzyme linked immunosorbent assay of IL-33 in the gut explants from WT and V33 mice. Data were normalized to the weight of the intestine explant. Means ± s.e.m., n = 4 per group. **P < 0.01, ***P < 0.001, one-way ANOVA. (D) Immunofluorescence staining for IL-33 (red) in the gut of WT and V33 mice. Cell nuclei were counterstained with DAPI (blue). Notice that transgenic expression of IL-33 in the cytoplasm of intestinal epithelial cells in V33 mice. Scale bars, 50 μm.
Figure 3
Figure 3
IL-33 promotes intestinal polyp growth in Apc Min/+ mice. (A) V33 Apc Min/+ mice carried a significantly higher number of polyps in the SI than Apc Min/+ mice at d120. (B) Representative hematoxylin and eosin (H&E) staining of ileum of Apc Min/+ mice and V33 Apc Min/+ mice at d120. Individual tumors are highlighted by black lines. (C) Tumor number (left) and tumor size (right) of LI in Apc Min/+ mice and V33 Apc Min/+ mice at d120. (D) Representative gross specimens from the indicated genotype analyzed at d120. (E) Representative H&E staining of LI of Apc Min/+ mice and V33 Apc Min/+ mice at d120. Individual tumors are highlighted by black lines. Graphs show means ± s.e.m. *P < 0.05, **P < 0.01, ***P < 0.001, nonparametric Mann-Whitney test.
Figure 4
Figure 4
Genetic ablation of ST2 reduces polyp burden in Apc Min/+ mice. (A) Scheme for generation of ST2 −/− mice by CRISPR/Cas9n technology. The two g-RNA targeting sequences are underlined in red and blue. Sequencing confirmed the deletion of exons 4 and 5. (B) Flow cytometric analysis of the expression of ST2 on ILC2 (CD45+ Lin IL7R+ KLRG1+) isolated from the mesenteric fat of WT and ST2 −/− mice. Notice the absence of ST2 expression in the ILC2 isolated from ST2 −/− mice. (C,D) Quantification of the number of tumors in the small (C) and large (D) intestine of Apc Min/+ ST2 +/+, Apc Min/+ ST2 +/− and Apc Min/+ ST2 −/− mice. Graphs show means ± s.e.m. *P < 0.05, **P < 0.01, N.S. means not significant, nonparametric Mann-Whitney test.
Figure 5
Figure 5
Epithelial-derived IL-33 signaling expands colonic ST2+ regulatory T (Treg) cells and induces a Th2 cytokine profile. (A) Relative and absolute number of Treg cells (CD4+Foxp3+) in the colon of Apc Min/+ mice and V33 Apc Min/+ mice at d120. Left, representative flow cytometry plots gated on CD45+ cells; right, statistical data show means ± s.e.m. (B) Relative and absolute number of ST2+ Treg cells in the colon of Apc Min/+ mice and V33 Apc Min/+ mice at d120. Left, representative flow cytometry plots gated on CD45+ CD4+ cells; right, statistical data show means ± s.e.m. (C) Relative expression levels of ST2+Treg and Th2 signature genes were analyzed by qPCR in sorted T cells of colonic lamina propria of WT, V33, Apc Min/+ mice and V33 Apc Min/+ mice at d120. Graphs show means ± s.e.m., n = 4–5/group. *P < 0.05, **P < 0.01, ***P < 0.001, one-way ANOVA.
Figure 6
Figure 6
IL-33 regulates alternative activation of colonic macrophages. (A) Relative number of macrophages (CD45+CD11b+F480+) in the colon of WT, V33, Apc Min/+ mice and V33 Apc Min/+ mice at d120. Graphs show means ± s.e.m., n = 3–5/group. (B) Relative expression levels of M1 and M2 macrophage signature genes were analyzed by qPCR in sorted macrophages of colonic lamina propria of WT mice and V33 mice at d120. (C) Relative expression levels of M2 macrophage signature genes were analyzed by qPCR in sorted macrophages of colonic lamina propria of WT mice, Apc Min/+ mice and V33 Apc Min/+ mice at d120. Data were normalized to fold change from age-matched WT littermate control mice. Graphs show means ± s.e.m., n = 3–5/group. *P < 0.05, **P < 0.01, ***P < 0.001, versus WT group. # P < 0.05, ## P < 0.01, versus Apc Min/+ group.
Figure 7
Figure 7
Epithelial-derived IL-33 alters antimicrobial genes expression in the colon. (A) Relative expression levels of Reg3b, Reg3g, Ang4, Retnlb and Muc2 were analyzed by qPCR in the colon of size-matched tumor area (T) and adjacent non-tumor normal area (NT) of Apc Min/+ mice and V33 Apc Min/+ mice at d120. Data were normalized to the expression levels of the Ubiquitin transcript. Graphs show means ± s.e.m. n = 4–5/group. *P < 0.05, **P < 0.01, ***P < 0.001, one-way ANOVA. (B) Number of polyps in the intestine of Apc Min/+ mice and V33 Apc Min/+ mice receiving water or antibiotic continuously from weaning to 120 days post-birth. Graphs show means ± s.e.m. *P < 0.05, **P < 0.01, ***P < 0.001, nonparametric Mann-Whitney test.

References

    1. Baekkevold ES, et al. Molecular characterization of NF-HEV, a nuclear factor preferentially expressed in human high endothelial venules. Am J Pathol. 2003;163:69–79. doi: 10.1016/S0002-9440(10)63631-0. - DOI - PMC - PubMed
    1. Schmitz J, et al. IL-33, an interleukin-1-like cytokine that signals via the IL-1 receptor-related protein ST2 and induces T helper type 2-associated cytokines. Immunity. 2005;23:479–490. doi: 10.1016/j.immuni.2005.09.015. - DOI - PubMed
    1. Chackerian AA, et al. IL-1 receptor accessory protein and ST2 comprise the IL-33 receptor complex. Journal of immunology. 2007;179:2551–2555. doi: 10.4049/jimmunol.179.4.2551. - DOI - PubMed
    1. Greenfeder SA, et al. Molecular cloning and characterization of a second subunit of the interleukin 1 receptor complex. The Journal of biological chemistry. 1995;270:13757–13765. doi: 10.1074/jbc.270.23.13757. - DOI - PubMed
    1. Ohno T, Morita H, Arae K, Matsumoto K, Nakae S. Interleukin-33 in allergy. Allergy. 2012;67:1203–1214. doi: 10.1111/all.12004. - DOI - PubMed

Publication types

MeSH terms