. 2017 Nov 21;113(10):2236-2248.
doi: 10.1016/j.bpj.2017.06.035. Epub 2017 Jul 14.

Resident Calmodulin Primes NMDA Receptors for Ca2+-Dependent Inactivation

Affiliations

Resident Calmodulin Primes NMDA Receptors for Ca2+-Dependent Inactivation

Gary J Iacobucci et al. Biophys J. .

Abstract

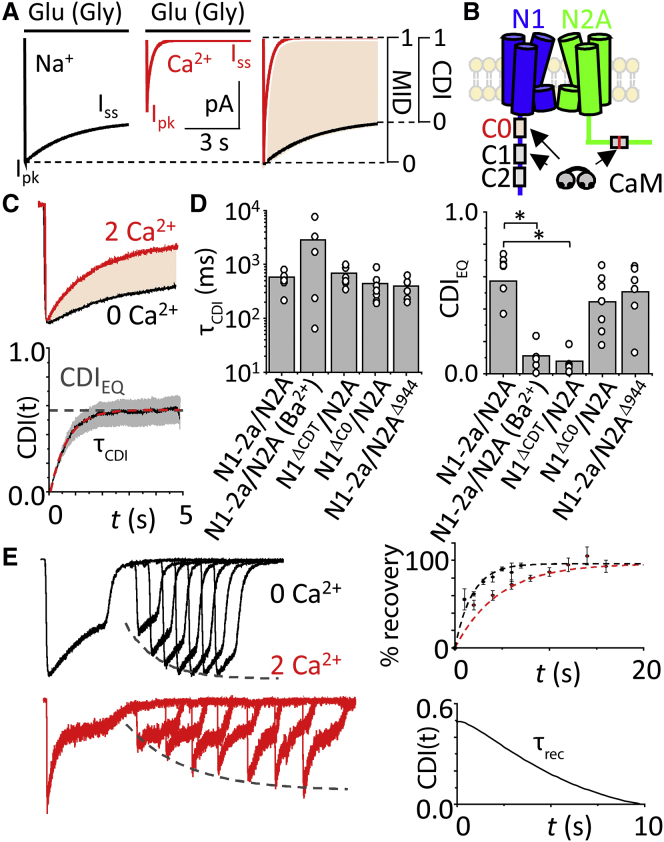
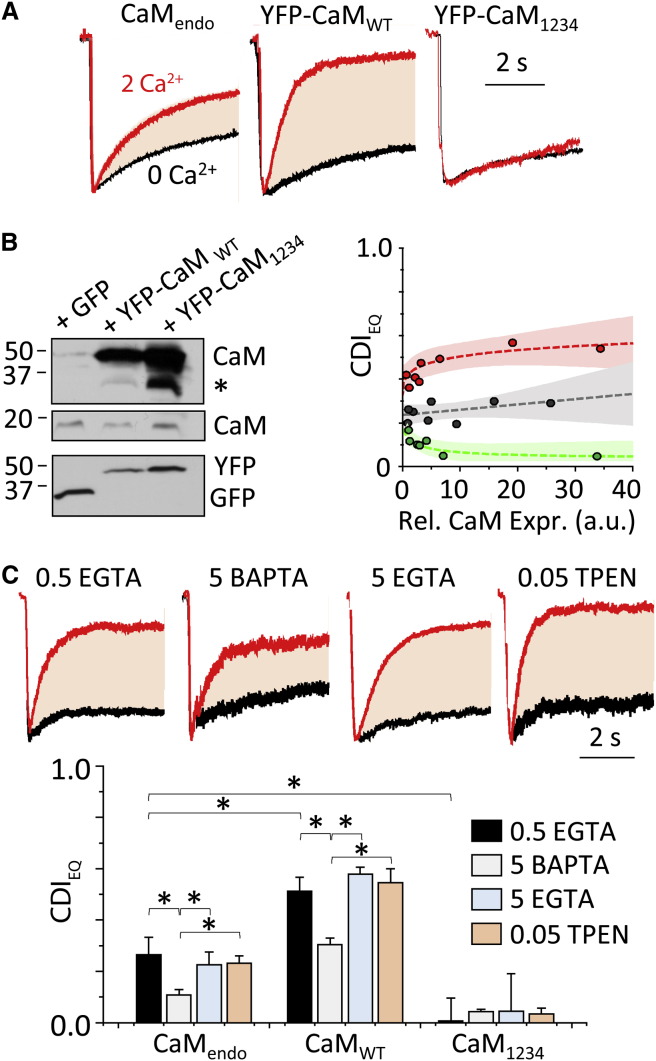
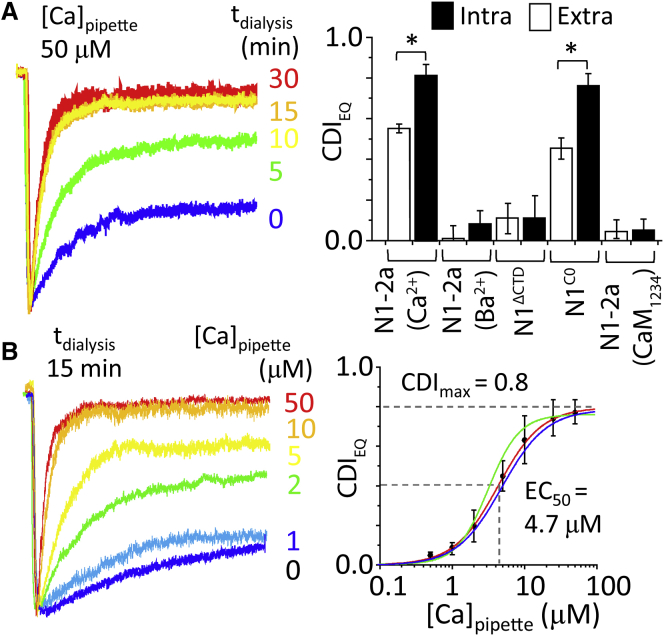
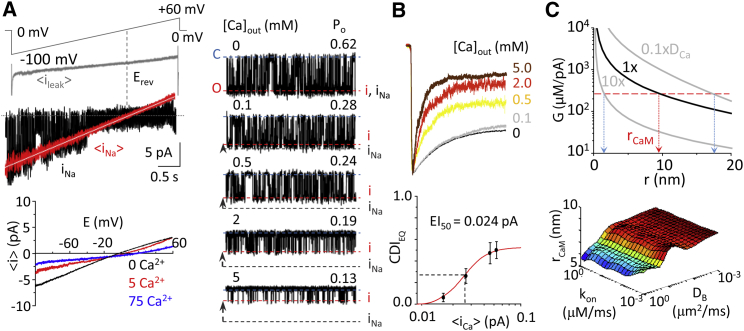
N-methyl-d-aspartate (NMDA) receptors are glutamate- and glycine-gated channels that flux Na+ and Ca2+ into postsynaptic neurons during synaptic transmission. The resulting intracellular Ca2+ transient is essential to physiological and pathological processes related to synaptic development, plasticity, and apoptosis. It also engages calmodulin (CaM) to reduce subsequent NMDA receptor activity in a process known as Ca2+-dependent inactivation (CDI). Here, we used whole-cell electrophysiology to measure CDI and computational modeling to dissect the sequence of events that underlies it. With these approaches, we estimate that CaM senses NMDA receptor Ca2+ influx at ∼9 nm from the channel pore. Further, when we controlled the frequency of Ca2+ influx through individual channels, we found that a kinetic model where apoCaM associates with channels before their activation best predicts the measured CDI. These results provide, to our knowledge, novel functional evidence for CaM preassociation to NMDA receptors in living cells. This particular mechanism for autoinhibitory feedback reveals strategies and challenges for Ca2+ regulation in neurons during physiological synaptic activity and disease.


Figures

Figure 1
Figure 1
Measuring pure CDI of NMDA receptors. (A) Shown here are simulated NMDA receptor currents using a declining exponential function. In the absence of external Ca2+, (black) currents display (MID, Ipk/Iss) with values between zero and unity; in 2 mM external Ca2+, (red) currents have lower peaks and increased desensitization; superimposed traces normalized to Ipk illustrate the additional desensitization due specifically to Ca2+-dependent inactivation (shaded area). (B) Given here is a schematic of GluN1 (N1, blue) with alternatively spliced cassettes C0, C1, and C2, and GluN2A (N2A, green), with W1017 highlighted (red line), illustrating reported CaM-binding sites. (C) (Top) Paired whole-cell currents from HEK293 cells coexpressing N1-2a and N2A subunits with YFP-CaMWT were recorded in the absence of divalent cations (black) and with Ca2+ (red), are shown normalized to peak and superimposed. (Bottom) CDI (black) is quantified with Eq. 4 along the recording coordinate and averaged across cells, with standard error (gray shaded). CDI-time curves were fit with an exponential of form CDI(t) = CDIEQ + A × e−t/τCDI. (D) Shown here is the CDI time constant (left) and steady-state levels for the conditions indicated (p < 0.05, Mann-Whitney U-test). (E) (Left) Exemplar whole-cell recordings of N1-2a and N2A subunits with YFP-CaMWT were recorded using a recovery from MID protocol in the absence (black) and presence (red) of external Ca2+. (Dashed curve) Shown here is an exponential function fitted to the data. (Top right) Fraction of recovery from MID defined as the percent of peak current at the test pulse relative to the conditioning pulse. Data represent mean ± SE of N = 5 cells. (Dashed curve) Shown here is a fitted exponential function. (Bottom right) Shown here is recovery from the CDI curve, derived from fitted exponential curves to recovery of MID data above, using Eq. 4. To see this figure in color, go online.
Figure 2
Figure 2
CaM levels modulate CDI magnitude. (A) Traces illustrate paired whole-cell recordings obtained from HEK293 cells expressing NMDA receptors and CaM as indicated, normalized to peak amplitude and superimposed. (B) (Left) Given here are Western blots of proteins isolated from HEK cells transfected with GFP and YFP-CaM, WT or mutant (indicated at top), and probed with antibodies specific for CaM, GFP, and YFP (indicated at right); () nonspecific bands from CaM primary antibody are indicated. (Right) CDI dependency on cell-to-cell variation in relative CaM expression (measured as YFP fluorescence) is shown for CaMWT (red) CaMendo (GFP, gray), and CaM1234 (green). Shaded regions reflect the upper and lower 95% confidence intervals of the fits (bold lines). (C) (Top) Representative whole-cell currents were recorded under indicated intracellular buffering conditions. (Bottom) Shown here are summary results from measurements as in (A) with the indicated metal chelators included in the recording pipette (mean ± SE; p < 0.05, Mann-Whitney U-test). To see this figure in color, go online.
Figure 3
Figure 3
Determining CDI sensitivity to [Ca2+]. (A) (Left) Given here are whole-cell NMDA receptor currents recorded with 50 μM free Ca2+ in pipette, at indicated times after break-in. (Right) Shown here is a summary of CDI values at 15 min postbreak-in, with indicated constructs and permeating divalent cation (Ca2+ or Ba2+; Intra, intracellular; Extra, extracellular). (B) (Left) Currents were recorded from NMDA receptors with indicated free [Ca2+] in the pipette recorded at 15 min postbreak-in. (Right) Given here are intracellular Ca2+ dose-response data (points) and fitted Hill function for WT receptors (red); pretreated with calcineurin inhibitor (green, EC50 = 3.9 μM; CDImax = 0.76); or N1ARPAAR (blue, EC50 = 5.2 μM; CDImax = 0.78; blue), P < 0.05, Mann-Whitney U-test. To see this figure in color, go online.
Figure 4
Figure 4
Dependence of CDI on unitary Ca2+ influx. (A) (Left, top) Shown here is a schematic of voltage-ramp protocol and average leak current (〈ileak〉) detected during cell-attached voltage ramps with no channel activity (gray). Given here are single-channel Na+-only currents (iNa) from single sweep (black) and averaged over 70–100 sweeps (red). The averaged current (〈i〉) was recorded at multiple external [Ca2+] (0–75 mM). (Bottom) The 〈i〉 was fit with the Jahr and Stevens model (white line) to determine conductance (γin), reversal potential (Erev), and fractional Ca2+ current (fCa) (28). (Right) Given here are representative stationary unitary currents in cell-attached patches at the indicated external [Ca2+]. Unitary current amplitude values (i) C and O indicate closed and open current levels. (B) (Top) Whole-cell currents were recorded with the indicated external [Ca2+] (5 mM BAPTA internal). (Bottom) Shown here is CDI measured with increasing external [Ca2+] plotted against the equivalent unitary Ca2+ current corrected for channel opening, 〈iCa〉 (see Table S1). EI50 = 0.024 pA was extracted from the Hill equation fitted to data. (C) (Top) Simulated steady-state Ca2+ spatial profile during channel opening is corrected for channel Po to reflect the time-averaged Ca2+ signal driving CDIEQ in macroscopic recordings plotted for various Ca2+ diffusion coefficients. Experimentally derived [Ca2+]/flux ratio (EC50/EI50, red horizontal dashed line) predicts rCaM = 9 nm. When Ca2+ diffusion coefficient (DCa) is varied across several orders of magnitude, rCaM likely resides between 2 and 16 nm (vertical pink dashed lines). (C) (Bottom) Systematic error in the model was evaluated as BAPTA kinetic (kon) and diffusion (DB) parameters were varied across several orders of magnitude; the estimated distance of rCaM remains approximately stable for a given value of DCa. To see this figure in color, go online.
Figure 5
Figure 5
CDI models reveal unique, testable behaviors. (A) (Top) Model 1 represents NMDA receptor association with holoCaM with subsequent Ca2+. apoCaM (open white circles) binds Ca2+ (solid circles) before binding to the channel. (Middle) Time-dependent behavior of subsystem (dashed box) is given, representing Ca2+ binding to CaM using only fast, N-lobe kinetics in response to a train of Ca2+ influx from a gating channel. State 2 (CaM bound with Ca2+) of the subsystem is pulsatile between P2,high and P2,low occupancy probabilities, in tight synchrony with gating. (Bottom) Shown is simplification of a three-state model given rapid equilibration of its subsystem. (B) (Top) Model 2 represents NMDA receptor association with apoCaM with subsequent Ca binding. (Middle) Given is a simplified model 2 assuming N-lobe kinetics. (Bottom) Shown is behavior of condensed state 2, 3 in response to a train of Ca2+ in-flux. The pulsatile system oscillates between P2,3,high and P2,3,low. P2,3,low is set by the fraction of channels preassociated with apoCaM at rest, P2,high. (C) (i) Given here is evaluation of Eq. 7’s corresponding model 1 across all values of Po. As CaM affinity for the channel is increased, the system exhibits saturation kinetics. As affinity decreases, the system becomes linear. (ii) Deviations of the simplified model in Eq. 7 from numerical integration to the full three-state model did not affect the overall shape or predicted behavior. (iii) Given here is evaluation of Eq. 8’s corresponding model 2 across all values of Po. As CaM affinity for the channel is increased, the system exhibits a linear trend. As affinity decreases, the system uniquely develops an upward curvature. (iv) Deviations of the simplified model in Eq. 8 from numerical integration in the full three-state model were minimal and did not affect the overall shape or predicted behavior. (D) (Left) Exampled here is single-channel activity elicited by indicated glutamate concentration. (Right) Given here is a calibration curve for glutamate concentration and Po determined from cell-attached single-channel recordings. To see this figure in color, go online.
Figure 6
Figure 6
CaM preassociates with NMDA receptors. (A) Both model 1 and model 2 describe well the dependency of CDI on Po (varied by changing glutamate concentrations). (B) (Top) C0 sequence indicates CaM binding region. Residues are color-coded by property relevant to CaM binding: positive charge (blue), negative charge (red), hydrophobic (gray). (Bottom) Whole-cell currents recorded from N1-2aW858A/N2A receptors have altered CDI at all glutamate concentrations tested. (C) (Top) Given here are unitary currents of high-Po mutant N1-2aA652Y, W858A/N2A. (Bottom) Given here are whole-cell currents from the mutants indicated. (D) Shown here is a CDIEQ-Po profile with pooled data from N1-2aA652Y/N2A (black circles) and high-Po double mutant N1-2aA652Y, W858A/N2A (red circle) fit with model 1 (holoCaM association, gray) and model 2 (apoCaM association, blue) (N = 4). To see this figure in color, go online.
Figure 7
Figure 7
Proposed sequence of molecular events underlying CDI. The model posits that at all times, NMDA receptors exist in a dynamic equilibrium of CaM-free (teal) and CaM-bound (magenta) receptors, which depends on endogenous levels of CaM, and the mutual affinities of the two partners. Upon binding agonist (Glu), receptors transition into highly active (Po, max) Ca2+-permeable conformations, leading to current influx (τrise) and the formation of intracellular Ca2+ nanodomains (yellow). Intracellular Ca2+ binds CaM, according to the local level of Ca2+ in the vicinity of CaM, and only CaM-bound channels transition into inactivated conformations (τCDI), which have very low activity (Po,CDI), leading to a population of active and inactivated channels. Upon glutamate removal, both active and inactivated receptors lose glutamate and deactivate with unique time constants, and the current decays with complex kinetics (τdecay). As intracellular [Ca2+] dissipates, Ca2+ will dissociate from CaM, returning inactivated channels to their resting state (τrec). To see this figure in color, go online.

Comment in

References

    1. Tu Y.C., Yang Y.C., Kuo C.C. Modulation of NMDA channel gating by Ca2+ and Cd2+ binding to the external pore mouth. Sci. Rep. 2016;6:37029. - PMC - PubMed
    1. Watanabe J., Beck C., Wollmuth L.P. DRPEER: a motif in the extracellular vestibule conferring high Ca2+ flux rates in NMDA receptor channels. J. Neurosci. 2002;22:10209–10216. - PMC - PubMed
    1. Maki B.A., Popescu G.K. Extracellular Ca2+ ions reduce NMDA receptor conductance and gating. J. Gen. Physiol. 2014;144:379–392. - PMC - PubMed
    1. Skeberdis V.A., Chevaleyre V., Zukin R.S. Protein kinase A regulates calcium permeability of NMDA receptors. Nat. Neurosci. 2006;9:501–510. - PubMed
    1. Lan J.Y., Skeberdis V.A., Zukin R.S. Protein kinase C modulates NMDA receptor trafficking and gating. Nat. Neurosci. 2001;4:382–390. - PubMed

LinkOut - more resources