. 2017 Jun 30:10:207.
doi: 10.3389/fnmol.2017.00207. eCollection 2017.

The Coordinated Action of Calcineurin and Cathepsin D Protects Against α-Synuclein Toxicity

Affiliations

The Coordinated Action of Calcineurin and Cathepsin D Protects Against α-Synuclein Toxicity

Andreas Aufschnaiter et al. Front Mol Neurosci. .

Abstract

The degeneration of dopaminergic neurons during Parkinson's disease (PD) is intimately linked to malfunction of α-synuclein (αSyn), the main component of the proteinaceous intracellular inclusions characteristic for this pathology. The cytotoxicity of αSyn has been attributed to disturbances in several biological processes conserved from yeast to humans, including Ca2+ homeostasis, general lysosomal function and autophagy. However, the precise sequence of events that eventually results in cell death remains unclear. Here, we establish a connection between the major lysosomal protease cathepsin D (CatD) and the Ca2+/calmodulin-dependent phosphatase calcineurin. In a yeast model for PD, high levels of human αSyn triggered cytosolic acidification and reduced vacuolar hydrolytic capacity, finally leading to cell death. This could be counteracted by overexpression of yeast CatD (Pep4), which re-installed pH homeostasis and vacuolar proteolytic function, decreased αSyn oligomers and aggregates, and provided cytoprotection. Interestingly, these beneficial effects of Pep4 were independent of autophagy. Instead, they required functional calcineurin signaling, since deletion of calcineurin strongly reduced both the proteolytic activity of endogenous Pep4 and the cytoprotective capacity of overexpressed Pep4. Calcineurin contributed to proper endosomal targeting of Pep4 to the vacuole and the recycling of the Pep4 sorting receptor Pep1 from prevacuolar compartments back to the trans-Golgi network. Altogether, we demonstrate that stimulation of this novel calcineurin-Pep4 axis reduces αSyn cytotoxicity.

Keywords: Parkinson’s disease; Pep4; calcineurin; cathepsin D; cytosolic acidification; pH homeostasis; vacuole; α-synuclein.


Figures
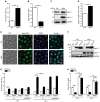
Figure 1
Figure 1
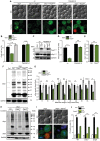
Pep4 overexpression counteracts αSyn-mediated defects of vacuolar proteolytic capacity and cell death. (A) Flow cytometric quantification of loss of membrane integrity, indicated by propidium iodide (PI) staining of cells expressing human α-synuclein (αSyn) for 24 h or harboring the corresponding vector control (Ctrl.). Means ± SEM; n = 28. (B) Measurement of Pep4 proteolytic activity in protein extracts 16 h after induction of αSyn expression in cells described above. Values obtained for Δpep4 cells have been subtracted as background, followed by normalization to the average of signals from Ctrl. cells. Means ± SEM; n = 16. (C,D) Immunoblot analysis of protein extracts from cells harboring chromosomally HA-tagged Pep4 and expressing αSyn for 16 h or harboring the corresponding vector control. A representative immunoblot (C) and quantification of Pep4-HA levels (D) are shown. Blots were probed with antibodies against HA epitope and glyceraldehyde 3-phosphate dehydrogenase (GAPDH) as a loading control. Means ± SEM; n = 7. (E) Representative micrographs of cells with chromosomally GFP-tagged Pep4 expressing αSyn for 24 h or harboring the corresponding vector control. CMAC counterstaining was performed to visualize vacuoles. White arrows indicate localization of Pep4 in prevacuolar compartments. (F) Immunoblot analysis of protein extracts from cells co-expressing αSyn and wild type Pep4 (Pep4WT) or the inactive double point mutant of Pep4 (Pep4DPM) for 24 h or harboring the corresponding vector controls. Blots were probed with antibodies directed against FLAG epitope to detect FLAG-tagged αSyn, Pep4WT and Pep4DPM and against GAPDH as loading control. (G) Flow cytometric quantification of loss of membrane integrity via PI staining of cells described in (F) at indicated time points. Cells were either treated with 50 μM pepstatin A or with DMSO (−). Means ± SEM; n ≥ 4. (H) Measurement of Pep4 proteolytic activity in protein extracts of cells expressing αSyn with and without co-expression of Pep4WT for 16 h and 24 h, respectively, or harboring the corresponding vector controls. Values obtained for Δpep4 cells have been subtracted as background. Means ± SEM; n = 8. n.s. not significant, ***p < 0.001; Scale bar represents 5 μm.
Figure 2
Figure 2
αSyn expression causes cytosolic acidification and alterations of vacuolar morphology. (A,B) Quinacrine staining of wild type (WT) cells expressing human αSyn for 16 h and 24 h, respectively, or harboring the empty vector control (Ctrl.), as well as of Δvph2 cells, to visualize acidic cell organelles. Representative micrographs after 16 h of expression (A) and quantification of cells with an acidic cytosol at 16 h and 24 h (B) are displayed. Representative micrographs after 24 h of expression are shown in Supplementary Figure S2A. Counterstaining with PI was performed to exclude dead cells from the analysis. For each strain 400–600 cells were evaluated. Means ± SEM; n = 3. (C–F) Analysis of vacuolar morphology of cells expressing αSyn for 16 h or harboring the empty vector control either via MDY-64 staining (C,D) or upon visualization of the vacuolar membrane via a chromosomally mCherry-tagged version of Vph1 (E,F). Representative micrographs (C,E) and quantification of cells containing the depicted number of vacuoles (D,F) are shown for each approach. MDY-64 stained cells were counterstained with PI to exclude dead cells from the quantification. For each strain 350–650 cells were evaluated. Means ± SEM; n = 3. (G) Flow cytometric quantification of loss of membrane integrity, indicated by PI staining of cells expressing αSyn with or without co-expression of indicated proteins for 24 h or harboring the corresponding empty vector controls. Means ± SEM; n = 9. (H) Quantification of cells with an acidic cytosol analyzed via quinacrine staining of cells as described in (G). Representative micrographs are shown in Supplementary Figure S2C. Cells were counterstained with PI to exclude dead cells. Means ± SEM; n = 3. n.s. not significant, *p < 0.05, **p < 0.01 and ***p < 0.001; Scale bar represents 5 μm.
Figure 3
Figure 3
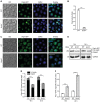
Pep4 antagonizes αSyn-induced cytosolic acidification and changes in vacuolar morphology. (A,B) Quinacrine staining of cells co-expressing human αSyn and Pep4WT for 16 h and 24 h, respectively, or harboring the corresponding empty vector controls (Ctrl.). Representative micrographs after 16 h of expression (A) as well as quantification of cells with an acidic cytosol at 16 h and 24 h (B) are shown. Dead cells were excluded via PI staining. For each strain 500–700 cells were evaluated. Representative micrographs for 24 h after promoter induction are shown in Supplementary Figure S3A. Means ± SEM; n = 3. (C,D) MDY-64-staining to visualize vacuoles of cells as described in (A). Dead cells were excluded via PI staining. Representative micrographs (C) and quantification of cells with less than three or with three or more vacuoles (D) are displayed after 16 h of expression. Data obtained at 24 h after promoter induction is displayed in Supplementary Figures S3C,D. For each strain 350–500 cells were evaluated. Means ± SEM; n = 3. n.s. not significant, ***p < 0.001; Scale bar represents 5 μm.
Figure 4
Figure 4
Pep4 enhances the breakdown of αSyn and its oligomers independent of autophagy. (A,B) Fluorescence microscopic analysis of cells expressing C-terminally GFP-tagged αSyn, co-expressing Pep4WT or the inactive Pep4DPM for 24 h or harboring the corresponding empty vector controls (Ctrl.). Cells were either treated with 50 μM pepstatin A or with DMSO (−). Counterstaining with PI was performed to exclude dead cells from the analysis. Representative micrographs (A) and quantification of cells with αSyn-foci (B) are shown. For each strain and treatment 200–400 cells were evaluated. For quantification of the number of foci per cell see Supplementary Figure S4A. Means ± SEM; n = 3. (C,D) Immunoblot analysis of protein extracts from cells co-expressing FLAG-tagged αSyn and Pep4WT for 24 h or harboring the corresponding empty vector controls (Ctrl.). Cells were either treated with 50 μM pepstatin A or with DMSO. A representative immunoblot (C) and quantification of αSyn protein levels (D) are displayed. Blots were probed with antibodies directed against FLAG epitope to detect FLAG-tagged αSyn and Pep4WT and against GAPDH as loading control. Means ± SEM; n = 13. (E) Reverse transcription quantitative PCR for determination of αSyn mRNA levels in extracts from cells as described in (A). Normalization was performed using mRNA levels of UBC6. Means ± SEM; n = 8. (F,G) Semi-native immunoblot approach to detect αSyn oligomers in protein extracts from cells co-expressing αSyn, Pep4WT or Pep4DPM for 24 h or harboring the corresponding empty vector controls. A representative immunoblot (F) as well as densitometric quantification of detected αSyn species with indicated molecular weights (G) are shown. Blots were probed with antibodies directed against αSyn and against GAPDH as loading control. Means ± SEM; n = 8. (H) In vivo crosslinking to detect αSyn oligomers in protein extracts from cells as described above. One percent formaldehyde was used as crosslinking-reagent (+) and buffer without reagent was used as negative control (−). Blots were probed as described for semi-native immunoblots above. For a complete blot and quantification of αSyn signals please see Supplementary Figures S4B,C. (I) Representative micrographs of cells with C-terminally GFP-tagged αSyn, co-expressing Pep4WT for 24 h. Vacuoles were stained with CMAC and PI counterstaining was performed to exclude dead cells. (J) Flow cytometric quantification of PI stained WT, Δatg1 and Δatg5 cells co-expressing αSyn and Pep4WT for 24 h or harboring the corresponding vector controls. Means ± SEM; n = 8. n.s. not significant, *p < 0.05, **p < 0.001 and ***p < 0.001; Scale bar represents 5 μm.
Figure 5
Figure 5
Pep1 is required for the cytoprotective effects of Pep4. (A) Flow cytometric quantification of loss of membrane integrity as indicated with PI staining of WT and Δpep1 cells co-expressing human αSyn and the Pep4WT for 24 h or harboring the corresponding vector controls (Ctrl.). Means ± SEM; n = 4. (B) Measurement of Pep4 proteolytic activity in protein extracts of cells described in (A) 16 h after induction of expression. Values obtained for Δpep4 cells have been subtracted as background, followed by normalization to the average of signals from WT Ctrl. cells. Means ± SEM; n = 8. (C) Immunoblot analysis of protein extracts from cells described in (A). Blots were probed with antibodies directed against FLAG epitope to detect FLAG-tagged αSyn and Pep4WT, and against glyceraldehyde 3-phosphat dehydrogenase (GAPDH) as loading control. (D,E) Immunoblot analysis of protein extracts from WT cells expressing αSyn for 16 h and 24 h or harboring the empty vector control. A representative immunoblot (D) and densitometric quantification (E) are shown. Blots were probed with antibodies against Pep1, the FLAG epitope to detect FLAG-tagged αSyn and GAPDH as a loading control. Means ± SEM; n ≥ 8. (F) Flow cytometric quantification of PI stained WT cells co-expressing αSyn and Pep1 for 24 h or harboring the corresponding vector controls. Means ± SEM; n = 4. (G) Immunoblot analysis of protein extracts from cells described in (F). Blots were probed with antibodies directed against Pep1, the FLAG epitope to detect FLAG-tagged αSyn and GAPDH as loading control. (H,I) Fluorescence microscopic analysis of cells harboring chromosomally GFP-tagged Pep1, expressing αSyn for 24 h or harboring the corresponding vector control. Representative micrographs (H) and quantification of cells with Pep1 mislocalization at the vacuolar membrane (I) are shown. Vacuoles were counterstained with CMAC. n.s. not significant, **p < 0.001 and ***p < 0.001; Scale bar represents 5 μm.
Figure 6
Figure 6
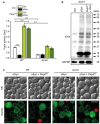
Calcineurin is essential for Pep4-mediated cytoprotection against αSyn toxicity. (A) Flow cytometric quantification of PI stained WT, Δcna1Δcna2 and Δcnb1 cells co-expressing human αSyn and the Pep4WT for 24 h or harboring the corresponding vector controls (Ctrl.). Means ± SEM; n ≥ 3. (B) Immunoblot analysis of protein extracts from cells as described above. Blots were probed with antibodies directed against FLAG epitope to detect FLAG-tagged αSyn and Pep4WT, and against GAPDH as loading control. (C,D) Quinacrine staining of WT and Δcnb1 cells co-expressing αSyn and Pep4WT for 24 h or harboring the corresponding vector controls. Representative micrographs (C) and quantification of cells with an acidic cytosol (D) are displayed. Counterstaining with PI was performed to exclude dead cells from the analysis. For each strain 300–600 cells were evaluated. Means ± SEM; n = 3. (E) Flow cytometric quantification of PI stained WT cells and indicated mutants co-expressing αSyn and Pep4WT for 24 h or harboring the corresponding vector controls. Means ± SEM; n = 3. n.s. not significant, ***p < 0.001; Scale bar represents 5 μm.
Figure 7
Figure 7
The lack of calcineurin impairs endosomal sorting of Pep1 and Pep4 and decreases Pep4 activity. (A) Representative micrographs of WT and Δcnb1 cells harboring chromosomally GFP-tagged Pep4. Vacuoles were counterstained with CMAC. White arrows indicate localization of Pep4 in prevacuolar compartments. (B) Measurement of Pep4 proteolytic activity in protein extracts from WT and Δcnb1 cells grown for 16 h. Values obtained for Δpep4 cells have been subtracted as background, followed by normalization to the average of signals from WT. Means ± SEM; n = 4. (C) Representative micrographs of WT and Δcnb1 cells harboring chromosomally GFP-tagged Pep1 grown for 24 h. Vacuoles were counterstained with CMAC. (D–F) Immunoblot analysis of protein extracts from cells as described in (C) at 16 h and 24 h, respectively. Blots were probed with antibodies directed against GFP to detect GFP-tagged Pep1 and against GAPDH as loading control. Of note, immunoblots were performed on stacked gels consisting of 7% polyacrylamide in the upper phase and 12.5% in the lower phase, respectively, to allow separation of the full length and clipped band of Pep1-GFP. Representative immunoblots (D) and quantification of Pep1-GFP protein levels (E,F) are displayed. Means ± SEM; n ≥ 7. ***p < 0.001; Scale bar represents 5 μm.
Figure 8
Figure 8
Calcineurin is essential for Pep4-mediated degradation of αSyn oligomers. (A) Measurement of Pep4 proteolytic activity in protein extracts from WT and Δcnb1 cells co-expressing αSyn and the Pep4WT for 16 h or harboring the empty vector controls (Ctrl.). Values obtained for Δpep4 cells have been subtracted as background, followed by normalization to the average of signals from WT. Means ± SEM; n = 8. (B) Representative semi-native immunoblots to detect αSyn oligomers in protein extracts from Δcnb1 cells co-expressing αSyn and Pep4WT for 24 h or harboring the corresponding vector controls. Corresponding densitometric quantification of detected αSyn species is shown in Supplementary Figure S5A. (C) Representative micrographs of WT and Δcnb1 cells co-expressing C-terminally GFP-tagged αSyn and Pep4WT for 24 h or harboring the corresponding empty vector controls. Cells were counterstained with PI to exclude dead cells. ***p < 0.001; Scale bar represents 5 μm.
Figure 9
Figure 9
Schematic overview of αSyn toxicity and the protective interplay between calcineurin, Pep1 and Pep4. The expression of human αSyn in yeast cells (upper part in gray) led to mislocalization of Pep1 at the vacuolar membrane and of Pep4 in prevacuolar compartments. These events resulted in reduced enzymatic activity (indicated with stars) of Pep4. Furthermore, vacuolar morphology was changed upon αSyn expression, leading to a single enlarged vacuole. This was accompanied by oligomerization and aggregation of αSyn and acidification of the cytosol. Co-expression of Pep4 (lower part in white), the yeast ortholog of human cathepsin D (CatD), resulted in a stabilization of cytosolic pH, a decrease of αSyn oligomers and the formation of multiple small vacuoles, causing a higher vacuolar surface-to-volume ratio compared to cells only expressing αSyn. Ultimately, these beneficial effects of Pep4 prevented αSyn-induced cell death. Pep4-mediated cytoprotection required calcineurin, which is essential for proper localization of Pep1 and Pep4, as well as for subsequent activation of Pep4.

References

    1. Aranda P. S., LaJoie D. M., Jorcyk C. L. (2012). Bleach gel: a simple agarose gel for analyzing RNA quality. Electrophoresis 33, 366–369. 10.1002/elps.201100335 - DOI - PMC - PubMed
    1. Baba M., Nakajo S., Tu P. H., Tomita T., Nakaya K., Lee V. M., et al. . (1998). Aggregation of alpha-synuclein in Lewy bodies of sporadic Parkinson’s disease and dementia with Lewy bodies. Am. J. Pathol. 152, 879–884. - PMC - PubMed
    1. Babst M., Katzmann D. J., Estepa-Sabal E. J., Meerloo T., Emr S. D. (2002). Escrt-III: an endosome-associated heterooligomeric protein complex required for mvb sorting. Dev. Cell 3, 271–282. 10.1016/S1534-5807(02)00220-4 - DOI - PubMed
    1. Bahi A., Mineur Y. S., Picciotto M. R. (2009). Blockade of protein phosphatase 2B activity in the amygdala increases anxiety- and depression-like behaviors in mice. Biol. Psychiatry 66, 1139–1146. 10.1016/j.biopsych.2009.07.004 - DOI - PMC - PubMed
    1. Balderhaar H. J., Arlt H., Ostrowicz C., Bröcker C., Sundermann F., Brandt R., et al. . (2010). The Rab GTPase Ypt7 is linked to retromer-mediated receptor recycling and fusion at the yeast late endosome. J. Cell Sci. 123, 4085–4094. 10.1242/jcs.071977 - DOI - PubMed

LinkOut - more resources