. 2017 Jun 30:11:48.
doi: 10.3389/fnsys.2017.00048. eCollection 2017.

Impaired In Vivo Gamma Oscillations in the Medial Entorhinal Cortex of Knock-in Alzheimer Model

Affiliations

Impaired In Vivo Gamma Oscillations in the Medial Entorhinal Cortex of Knock-in Alzheimer Model

Tomoaki Nakazono et al. Front Syst Neurosci. .

Abstract

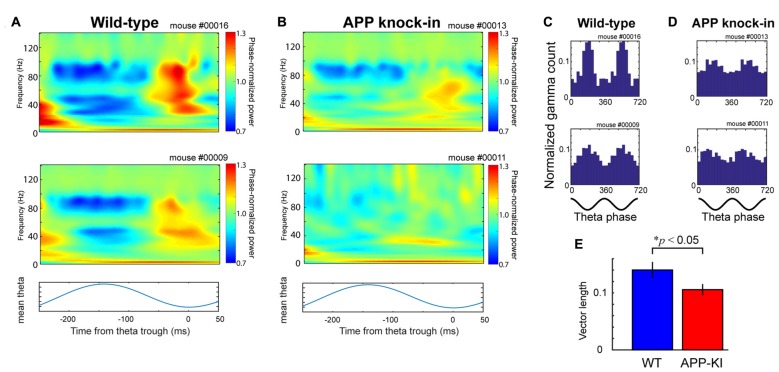
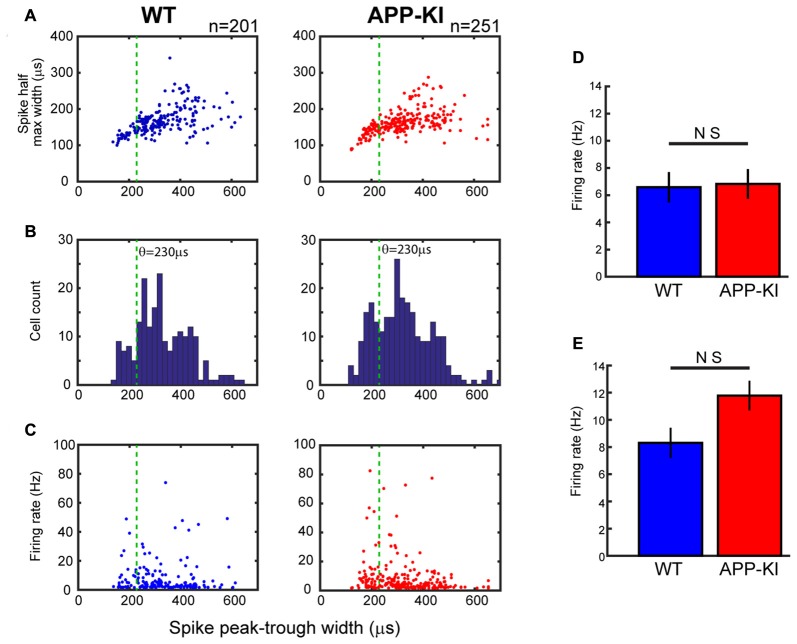
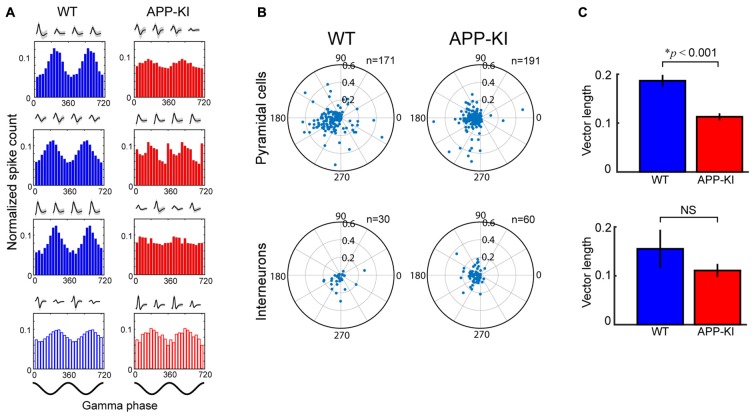
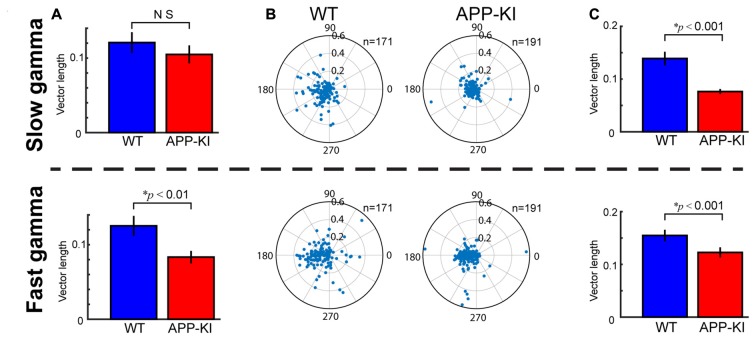
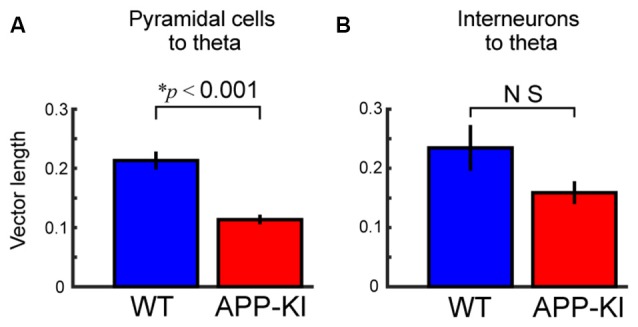
The entorhinal cortex (EC) has bidirectional connections with the hippocampus and plays a critical role in memory formation and retrieval. EC is one of the most vulnerable regions in the brain in early stages of Alzheimer's disease (AD), a neurodegenerative disease with progressive memory impairments. Accumulating evidence from healthy behaving animals indicates gamma oscillations (30-100 Hz) as critical for mediating interactions in the circuit between EC and hippocampus. However, it is still unclear whether gamma oscillations have causal relationship with memory impairment in AD. Here we provide the first evidence that in vivo gamma oscillations in the EC are impaired in an AD mouse model. Cross-frequency coupling of gamma (30-100 Hz) oscillations to theta oscillations was reduced in the medial EC of anesthetized amyloid precursor protein knock-in (APP-KI) mice. Phase locking of spiking activity of layer II/III pyramidal cells to the gamma oscillations was significantly impaired. These data indicate that the neural circuit activities organized by gamma oscillations were disrupted in the medial EC of AD mouse model, and point to gamma oscillations as one of possible mechanisms for cognitive dysfunction in AD patients.

Keywords: Alzheimer’s disease (AD); amyloid precursor protein (APP); gamma oscillations; in vivo electrophysiology; medial entorhinal cortex.


Figures

Figure 1
Figure 1
Amyloid precursor protein knock-in (APP-KI) mice showed normal theta state comparable to wild-type (WT) mice. (A–C) Representative sagittal brain sections showing the recording positon (red point) in medial entorhinal cortex (MEC; A) and Aβ immunostaining in WT mouse (B, WT) and APP-KI mouse (C, APP-KI). A, anterior; P, posterior, D; dorsal; V, ventral. Scale bar, 500 μm. (D) Time-resolved power spectrum in 0–10 Hz band from a representative WT mouse (left) and an APP-KI mouse (right). Power normalized by 5–10 Hz mean power is color-coded. Each 10-s time bin was divided into theta state (Theta) and slow wave state (Slow) and color-coded with magenta and green, respectively, shown on top of the spectra (see “Materials and Methods” Section). (E) Mean raw power spectra ± SEM (shading) in 0.4–10 Hz band during theta period in WT mice (n = 33 recording sessions) and APP-KI mice (n = 31 recording sessions). Comparison at each 0.2 Hz step showed no significant difference (q < 0.05, false discovery rate (FDR) corrected). (F) Emergence rate of theta period in WT mice (n = 33 recording sessions) and APP-KI mice (n = 31 recording sessions). There was no significant difference (p > 0.05, Mann-Whitney U test).
Figure 2
Figure 2
Gamma oscillations in APP-KI mice. (A,B) Time-resolved power spectrum in 10–100 Hz band during theta period from a representative WT mouse (left) and an APP-KI mouse (right). Power normalized by 5–10 Hz mean power is color-coded. (C) Normalized gamma power in 30–100 Hz band did not differ between WT mice (n = 33 recording sessions) and APP-KI mice (n = 31 recording sessions; p > 0.05, Mann-Whitney U test). (D) Emergence rate of gamma episode did not differ between WT mice (n = 33 recording sessions) and APP-KI mice (n = 31 recording sessions; p > 0.05, Mann-Whitney U test). (E,F) Normalized power of (E) slow gamma oscillation (30–50 Hz) and (F) fast gamma oscillations (55–100 Hz) did not differ between WT mice (n = 33 recording sessions) and APP-KI mice (n = 31 recording sessions; p > 0.05, Mann-Whitney U test).
Figure 3
Figure 3
APP-KI mice showed impaired theta-gamma cross-frequency coupling. (A) Top and middle, time-resolved power spectra triggered at theta trough (t = 0) and averaged across all theta cycles from two representative WT mice. Bottom, averaged theta cycle. (B) Same as in (A), but from two representative APP-KI mice. (C,D) Theta phase distributions of gamma oscillation maxima from (C) two representative WT mice and (D) two representative APP-KI mice. Count of gamma maxima is shown as normalized number for two gamma cycles (bottom; 0°, theta peak). (E) Mean vector length of theta phase distributions of gamma oscillation maxima for WT mice (n = 33 recording sessions) and APP-KI mice (n = 31 recording sessions). APP-KI mice showed reduced degree of cross-frequency coupling (p < 0.05, Mann-Whitney U test).
Figure 4
Figure 4
Neurons in APP-KI mice showed normal spike waveform and firing rate. (A) Plot of individual neurons for spike half-maximum width as a function of spike peak-trough width in WT mice (left) and APP-KI mice (right; n = 201 and 251 neurons, respectively). Green lines indicate 230 μs threshold used for separating interneurons and pyramidal neurons (see text). (B) Distributions of spike peak-trough width from WT mice (left) and APP-KI mice (right). Note that both distributions have a gap at 210–250 μs, which presumably represents the gap of different spike width between interneurons and pyramidal neurons. (C) Plot of individual neurons for mean firing rate during theta periods as a function of spike peak-trough width in WT mice (left) and APP-KI mice (right). (D,E) Mean firing rate for putative pyramidal neurons (D, n = 171 and 191 for WT and APP-KI) and interneurons (E, n = 30 and 60 for WT and APP-KI). No difference in firing rate was observed (Mann-Whitney U test).
Figure 5
Figure 5
Pyramidal neurons in APP-KI mice showed impaired gamma phase locking. (A) Spike-time distributions of neurons across phase of gamma oscillation. Distributions of three representative pyramidal cells (Top) and an interneuron (Bottom) is shown for two gamma cycles with their waveforms recorded in each tetrode channel. Pyramidal cells in WT mice (left) showed larger peaks of phase distribution than those in APP-KI mice (right). Schematics of two cycles of gamma waveform are shown in the bottom (0°, gamma peak). (B) Polar plot of resultant vector angle and length computed from gamma phase distribution of individual pyramidal cells (top) and interneurons (bottom) in WT mice (left) and APP-KI mice (right). (C) Mean length of resultant vector in (B). Pyramidal cells in APP-KI mice showed impaired degree of phase locking to gamma oscillations (p < 0.001, Mann-Whitney U test). Interneurons did not show significant difference (p > 0.05, Mann-Whitney U test).
Figure 6
Figure 6
Fast gamma oscillations were more affected than slow gamma oscillations. (A) Degree of theta-gamma cross-frequency coupling, same as shown in Figure 3E, but for slow gamma oscillations (top) and fast gamma oscillations (bottom). Mean vector length of gamma maxima distribution was shown. APP-KI mice showed impaired cross frequency coupling between theta and fast gamma oscillations (p < 0.01), but not for slow gamma oscillations (p > 0.05, Mann-Whitney U test). (B) Polar plot of phase distribution for individual pyramidal cells, same as shown in Figure 5B, but for slow gamma phase (top) and fast gamma phase (bottom). (C) Mean vector length of phase locking for pyramidal neurons, same as shown in Figure 5C, but for slow gamma (top) and fast gamma (bottom). Pyramidal neurons in APP-KI mice showed impaired phase locking to both slow and fast gamma oscillations (p < 0.001, Mann-Whitney U test).
Figure 7
Figure 7
Pyramidal neurons in APP-KI mice showed impaired theta phase locking. (A,B) Mean vector length of phase locking for pyramidal neurons (A) and interneurons (B), same as shown in Figure 5C, but for theta oscillations. Pyramidal neurons in APP-KI mice showed impaired phase locking to theta oscillations (p < 0.001), but interneurons did not (p > 0.05, Mann-Whitney U test).

References

    1. Ahmed O. J., Mehta M. R. (2012). Running speed alters the frequency of hippocampal gamma oscillations. J. Neurosci. 32, 7373–7383. 10.1523/JNEUROSCI.5110-11.2012 - DOI - PMC - PubMed
    1. Axmacher N., Henseler M. M., Jensen O., Weinreich I., Elger C. E., Fell J. (2010). Cross-frequency coupling supports multi-item working memory in the human hippocampus. Proc. Natl. Acad. Sci. U S A 107, 3228–3233. 10.1073/pnas.0911531107 - DOI - PMC - PubMed
    1. Barthó P., Hirase H., Monconduit L., Zugaro M., Harris K. D., Buzsáki G. (2004). Characterization of neocortical principal cells and interneurons by network interactions and extracellular features. J. Neurophysiol. 92, 600–608. 10.1152/jn.01170.2003 - DOI - PubMed
    1. Bland B. H. (1986). The physiology and pharmacology of hippocampal formation theta rhythms. Prog. Neurobiol. 26, 1–54. 10.1016/0301-0082(86)90019-5 - DOI - PubMed
    1. Bragin A., Jandó G., Nadasdy Z., Hetke J., Wise K., Buzsáki G. (1995). Gamma (40–100 Hz) oscillation in the hippocampus of the behaving rat. J. Neurosci. 15, 47–60. - PMC - PubMed