Review
. 2017 Jun 30:8:725.
doi: 10.3389/fimmu.2017.00725. eCollection 2017.

The SpTransformer Gene Family (Formerly Sp185/333) in the Purple Sea Urchin and the Functional Diversity of the Anti-Pathogen rSpTransformer-E1 Protein

Affiliations
Review

The SpTransformer Gene Family (Formerly Sp185/333) in the Purple Sea Urchin and the Functional Diversity of the Anti-Pathogen rSpTransformer-E1 Protein

L Courtney Smith et al. Front Immunol. .

Abstract

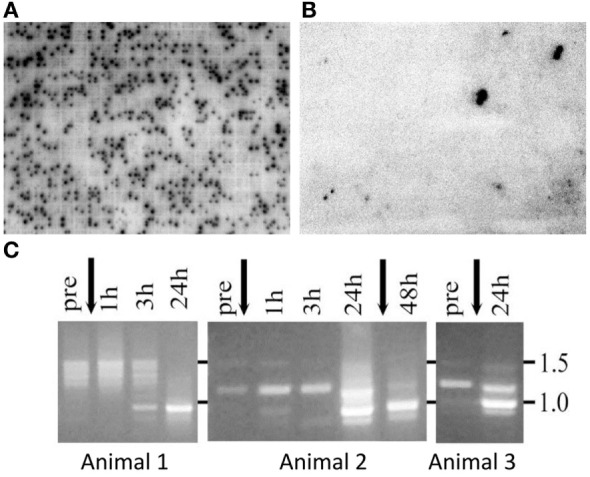
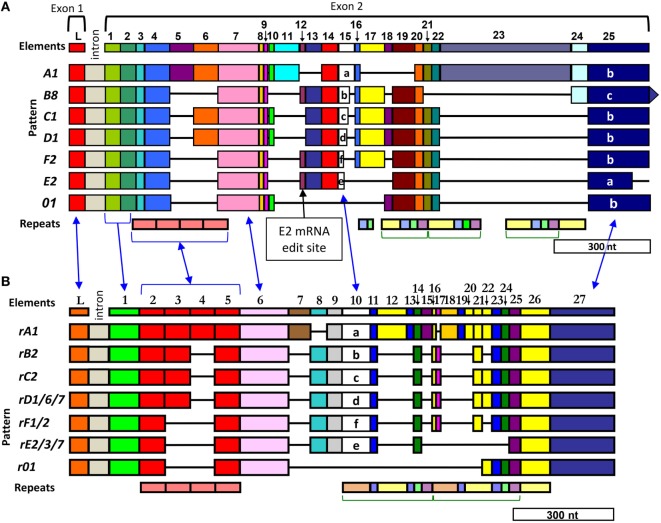
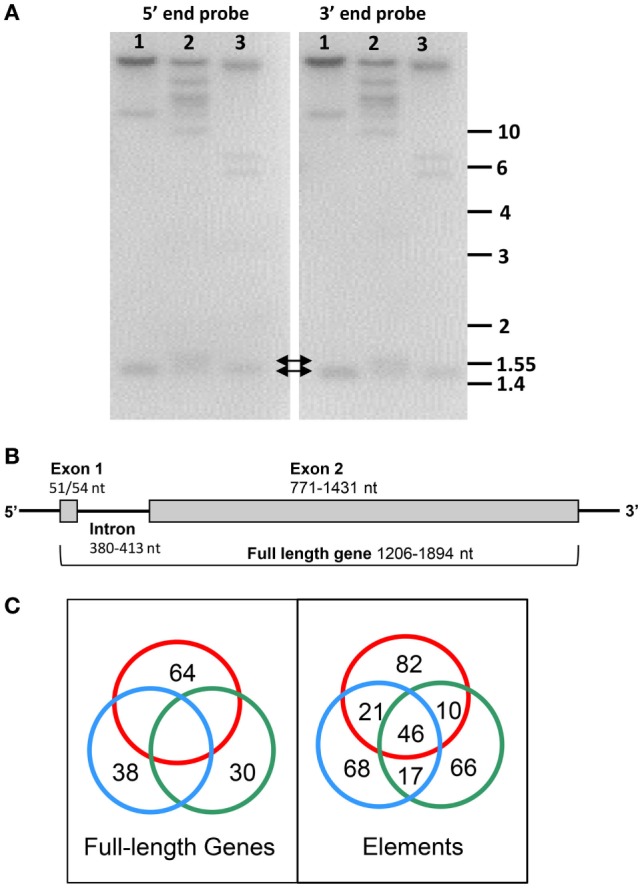
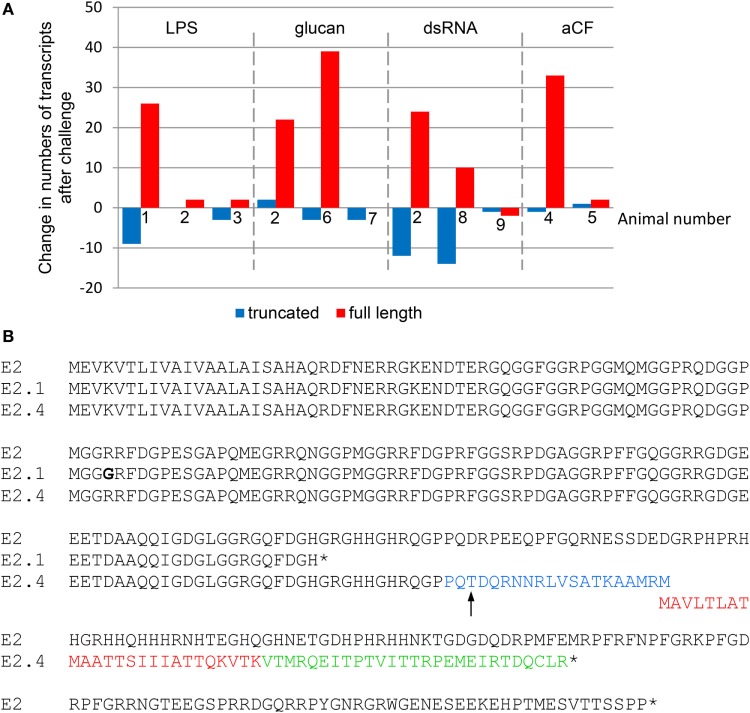
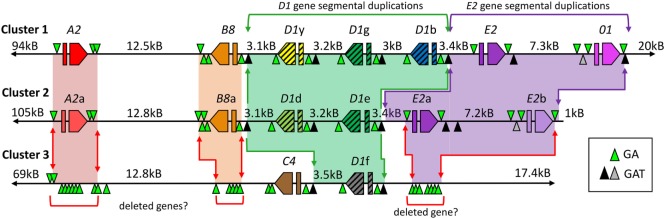
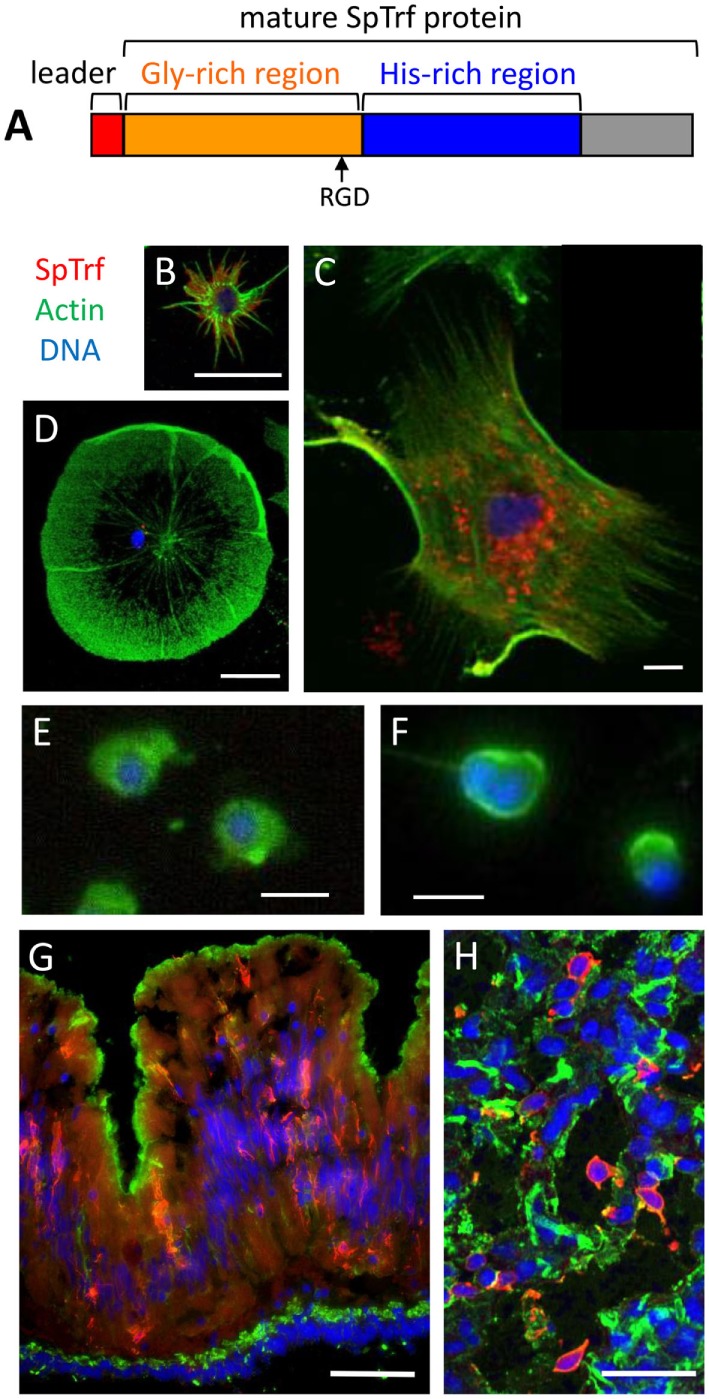
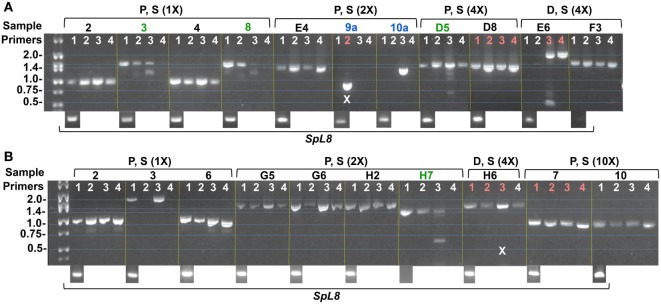
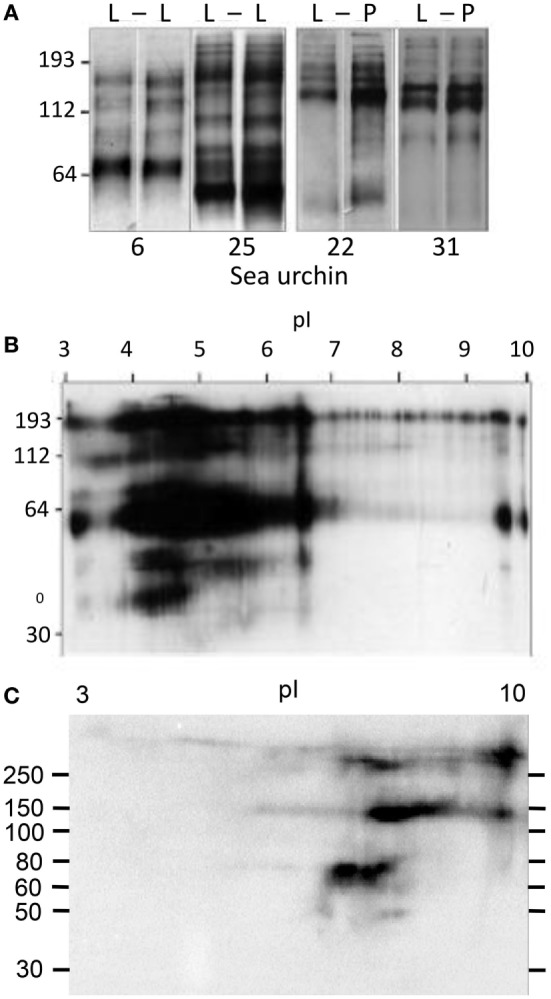
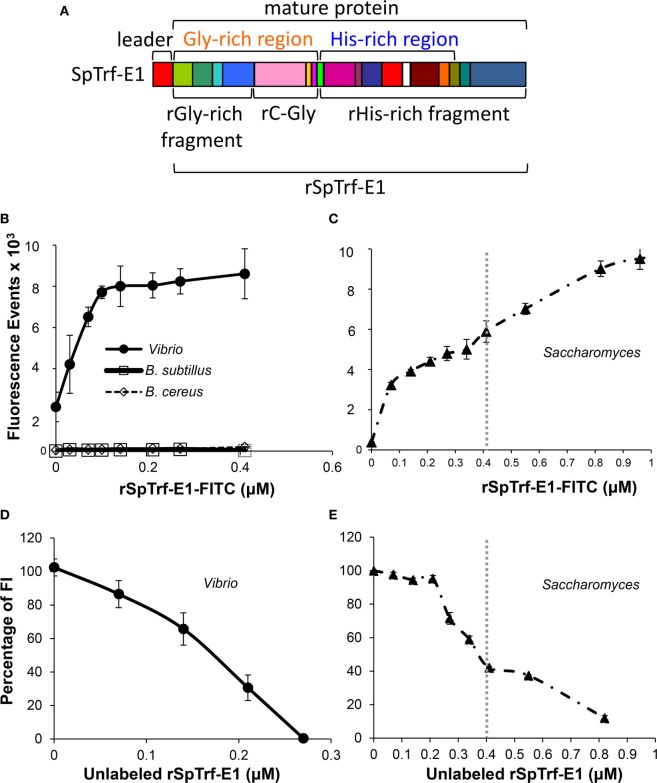
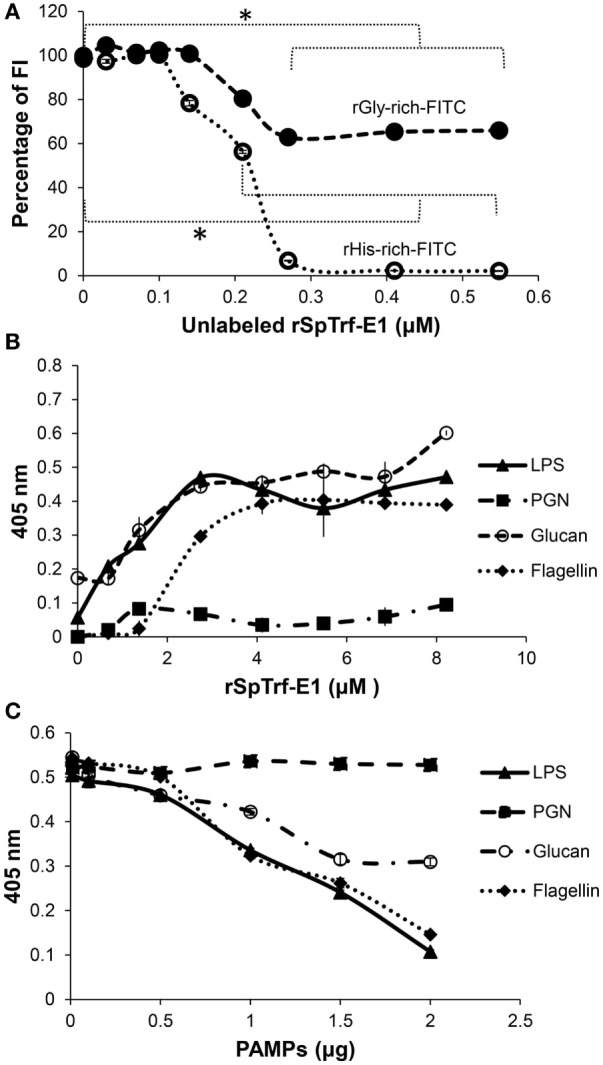
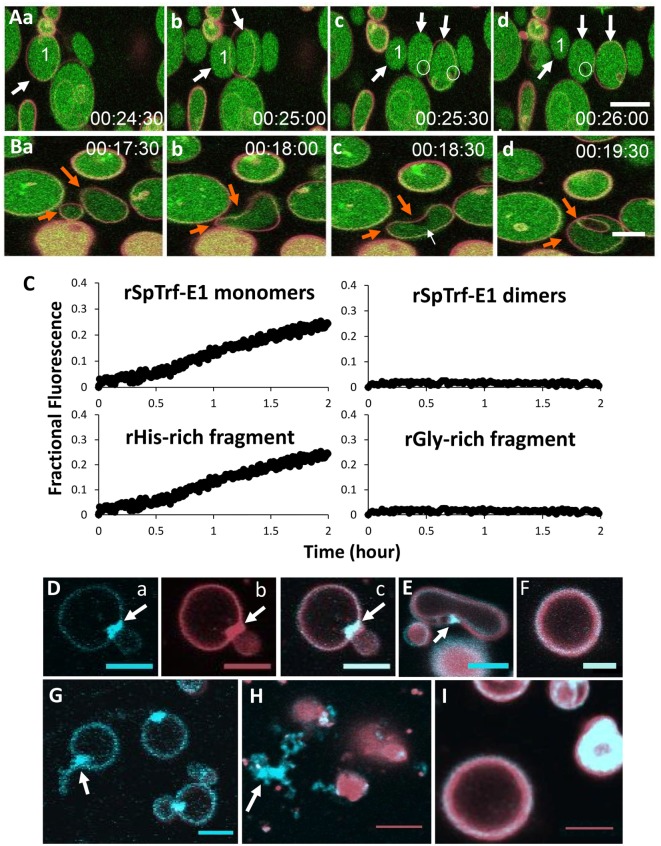
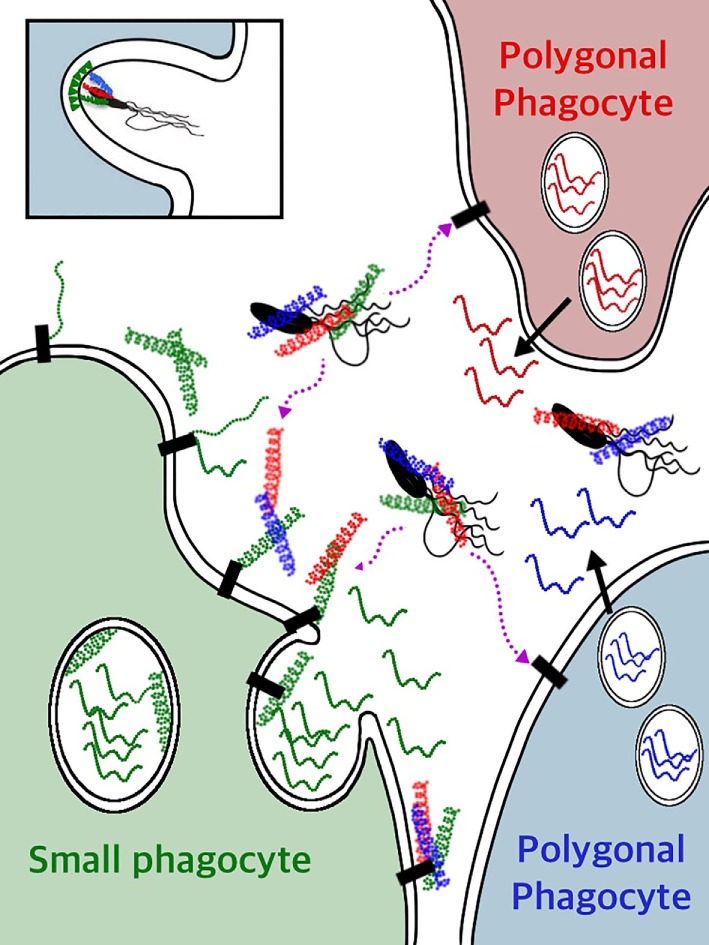
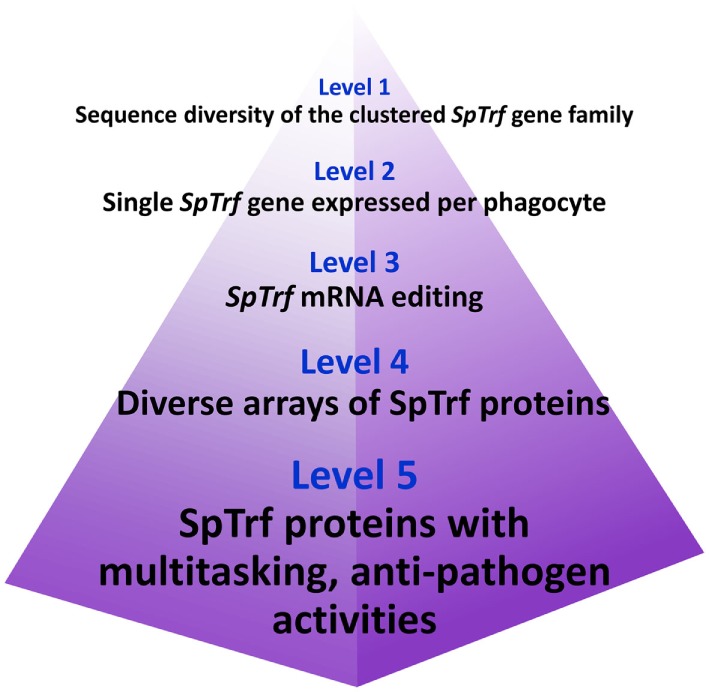
The complex innate immune system of sea urchins is underpinned by several multigene families including the SpTransformer family (SpTrf; formerly Sp185/333) with estimates of ~50 members, although the family size is likely variable among individuals of Strongylocentrotus purpuratus. The genes are small with similar structure, are tightly clustered, and have several types of repeats in the second of two exons and that surround each gene. The density of repeats suggests that the genes are positioned within regions of genomic instability, which may be required to drive sequence diversification. The second exon encodes the mature protein and is composed of blocks of sequence called elements that are present in mosaics of defined element patterns and are the major source of sequence diversity. The SpTrf genes respond swiftly to immune challenge, but only a single gene is expressed per phagocyte. Many of the mRNAs appear to be edited and encode proteins with altered and/or missense sequence that are often truncated, of which some may be functional. The standard SpTrf protein structure is an N-terminal glycine-rich region, a central RGD motif, a histidine-rich region, and a C-terminal region. Function is predicted from a recombinant protein, rSpTransformer-E1 (rSpTrf-E1), which binds to Vibrio and Saccharomyces, but not to Bacillus, and binds tightly to lipopolysaccharide, β-1,3-glucan, and flagellin, but not to peptidoglycan. rSpTrf-E1 is intrinsically disordered but transforms to α helical structure in the presence of binding targets including lipopolysaccharide, which may underpin the characteristics of binding to multiple targets. SpTrf proteins associate with coelomocyte membranes, and rSpTrf-E1 binds specifically to phosphatidic acid (PA). When rSpTrf-E1 is bound to PA in liposome membranes, it induces morphological changes in liposomes that correlate with PA clustering and leakage of luminal contents, and it extracts or removes PA from the bilayer. The multitasking activities of rSpTrf-E1 infer multiple and perhaps overlapping activities for the hundreds of native SpTrf proteins that are produced by individual sea urchins. This likely generates a flexible and highly protective immune system for the sea urchin in its marine habitat that it shares with broad arrays of microbes that may be pathogens and opportunists.

Keywords: Sp185/333; Strongylocentrotus; anti-pathogen; echinoderm; intrinsically disordered proteins; invertebrate; multitasking; purple sea urchin.


Figures

Figure 1
Figure 1
The SpTransformer (SpTrf) genes are expressed in response to immune challenge. Two arrayed cDNA libraries constructed from coelomocytes: (A) collected from six sea urchins after immune challenge by injection of marine bacteria or (B) collected from six sea urchins that were not challenged. Individual colonies harboring cDNAs were arrayed into 91,920 separate wells in 240 plates of 384 wells/plate. cDNA inserts for each colony were amplified, spotted onto a nylon filter [for details, see Ref. (10)], and both libraries were screened with a 32P-RNA probe constructed from a set of SpTrf cDNA clones (9). The activated library has ~5,925 SpTrf-positive spots or 6.45% of the library, whereas the non-activated coelomocyte library has 79 SpTrf-positive spots or 0.086% of the library. Positive clones are indicated by two spots within a 4 × 4 set of amplified insert cDNA from each clone in the library. (C) Coelomocytes collected over time from three immunoquiescent sea urchins and analyzed by RT-PCR show changes in the SpTrf amplicon sizes before vs. after one or two injections of lipopolysaccharide (arrows). The major element pattern identified after cDNA insert sequencing is E2 has an amplicon size of about 935 nt, which is similar to the single band observed at 24–48 h post challenge. Panel (C) is reprinted from Ref. (11).
Figure 2
Figure 2
Diversity of elements and repeats in the SpTransformer (SpTrf) sequences enable two equally optimal alignments. Optimal alignments of the SpTrf sequences require the insertion of artificial gaps (black horizontal lines) that delineate individual elements shown as colored blocks [numbered across the top (L, leader)]. The intron is not to scale. Different element patterns are based on the variable presence or absence of elements and are listed to the left of each alignment. The combination of elements defines the element pattern that is named according to the distinctive and highly diverse sequence of element 15 (6). (A) The initial alignment employed fragments of cDNA sequences, expressed sequence tags, and full-length cDNA sequences according to Terwilliger et al. (6, 11) and is called a “cDNA-based” alignment. Element 25 in panel (A) is listed as three types, a, b, and c, which are defined by the location of the first of three possible stop codons in the element. These three stops are also present in element 27 in panel (B) but are not indicated. A very common mRNA editing site in element 12 is indicated for the E2 element pattern (indicated) that changes a codon to a stop to encode a truncated E2.1 sequence that omits the histidine-rich region of the protein (see also Figure 4B). (B) A subsequent alignment optimizes the edges of the elements with the edges of the repeats according to Buckley and Smith (15) and is called the “repeat-based” alignment. Both types of alignments are feasible with cDNA and gene sequences. The blue arrows between the two alignments indicate identical regions. Repeats are shown at the bottom of each alignment, occur as tandem repeats or interspersed tandem repeats, and are denoted by different colors (type 1, red; type 2, blue; type 3, green; type 4, yellow; type 5, purple; type 6, peach). This figure is modified from Ref. (16).
Figure 3
Figure 3
The SpTransformer (SpTrf) gene family is diverse, but the gene structure is simple. (A) Digests of genomic DNA from three sea urchins (1–3) with PstI are shown as duplicate Southern blots that are evaluated with 32P-labeled riboprobes spanning elements 1–7 (5′ end) and from elements 7–25 (3′ end) (see Figure 2 for elements). Both probes hybridize to bands of less than 2 kB (arrows) (see Terwilliger et al. (6) for methods). This figure is reprinted from Ref. (16). (B) The SpTrf genes are small with two exons. Although the genes show significant sequence diversity, their overall structure is generally the same with two exons. This figure is modified from Ref. (2). (C) Amplified, cloned, and sequenced genes (171 total) from three sea urchins are represented as red, blue, and green circles in this Venn diagram. Comparisons among nucleotide sequences of the full-length genes within and among sea urchins identified no identical matches (left). However, shared element sequences are present in genes within and among sea urchins (right). Shared sequences are indicated by intersections of the circles. This figure is reprinted from Ref. (16).
Figure 4
Figure 4
Immune challenge decreases edited SpTransformer (SpTrf) mRNAs. (A) The change in transcripts encoding truncated (edited) vs. full-length sequences with regard to immune challenge with lipopolysaccharide (LPS), β-1,3-glucan (glucan), double stranded RNA (dsRNA), or sham injection (aCF; artificial coelomic fluid) relative to pre-challenge transcript numbers is shown for nine animals based on cDNA sequences reported previously (11). Animal 2 received separate challenges from all pathogen-associated molecular patterns. Amplicons from RT-PCR for animals that received LPS that were used for this analysis are shown in Figure 1C. Bars below 0 indicate fewer transcripts after challenge and bars above 0 indicate more. Missing bars indicate no change. This figure is modified from Ref. (33). (B) An alignment of deduced amino acid sequences from a full-length E2 protein and two truncated E2 proteins shows mismatches, frameshifts, and early stops. The SpTrf protein with an E2 element pattern is a full-length protein encoded by cDNA clone Sp0016 [GenBank accession number DQ183104.1 (6)]. In some cDNA sequences denoted E2.1, the sequence is edited at a specific glycine codon to a stop that is not encoded by the gene. The E2.1 truncated sequence is encoded by cDNA clone 1-1539 [GenBank accession number EF066308.1 (11)] and prior to the early stop is not identical to the E2 sequence used in the alignment (bold glycine is indicated). The E2.4 element pattern is an edited mRNA and encodes a truncated protein with missense sequence (cDNA clone 8-2415; GenBank accession number EF065834.1 (11)). The point of the frameshift is indicated with an arrow, which is followed by missense sequences that have been identified by proteomic methods (blue and red text) (32). Additional missense sequence in E2.4 is shown in green followed by an early stop codon. The alignment was done with BioEdit (34) and modified by hand. Stop codons are indicated by the (*).
Figure 5
Figure 5
Three clusters of SpTransformer (SpTrf) genes are present in the Strongylocentrotus purpuratus genome. The three clusters of genes are likely located at two loci within the genome. See Figure 3B for an illustration of the standard gene structure. Clusters 1 and 2 are likely allelic based on matches in the flanking regions outside of the gene clusters, even though the numbers of genes within the loci do not match. Genes are labeled by element pattern; however, those with the same element pattern are not necessarily of identical sequence. All genes are flanked by GA short tandem repeats (STRs) and may be the basis of deleted regions (red arrows), including genes, in Cluster 3 that are indicated by regions of GA STRs that are as long as 3 kB. Segmental duplications including D1 genes (green shading and green arrows) and E2 genes (purple shading and purple arrows) are flanked by GAT STRs (black triangles indicate >35 repeats, gray triangles indicate 4–17 repeats). Red and orange shading indicate likely alleles in Clusters 1 and 2. Regions of missing or deleted genes in Cluster 3 are indicated by red brackets. This figure is modified from Ref. (29).
Figure 6
Figure 6
The phagocyte subpopulation of coelomocytes expresses the SpTransformer (SpTrf) proteins. (A) The standard SpTrf protein structure has an N-terminal leader (red), a glycine-rich region (orange), a histidine-rich region (blue), and a C-terminal region (gray). This figure is reprinted from Ref. (1). (B) A small phagocyte has SpTrf proteins within the cell and on the cell surface. (C) A large polygonal phagocyte has SpTrf proteins in small vesicles surrounding the nucleus. (D) A few discoidal phagocytes have a few, perinuclear vesicles containing SpTrf proteins. (E) Red spherule cells and (F) vibratile cells do not express SpTrf proteins. (G) A cross section of gut shows SpTrf+ cells within the columnar epithelium that are likely coelomocytes. The gut lumen is at the top of the image and the coelomic cavity is toward the bottom. (H) Numerous SpTrf+ cells are present within the axial organ, and are likely coelomocytes. Fluorescence microscopy was used to generate images (B,D–G), and confocal microscopy was used for (C,H). Images (B,C) were contributed by A. J. Majeske. (D–F) were reproduced from Ref. (41) with permission. Copyright 2014. The American Association of Immunologists, Inc. (F,G) were reprinted from Ref. (42). Scale bars are 10 µm for (B–F) and are 100 µm for (G,H).
Figure 7
Figure 7
Amplicons from single phagocyte indicate expression of single SpTransformer (SpTrf) genes in single cells. Coelomocytes were collected from two sea urchins (A,B), fractionated by Percoll density gradient into fractions of polygonal plus small phagocytes (P, S), and discoidal plus small phagocytes (D, S). Fractions were diluted to an estimate of 1 cell/μl followed by further dilutions of 2×, 4×, and 10× to ensure 1 cell/sample. Samples were first tested by nested RT-PCR using primers for SpL8 (shown at the bottom of the images) that encodes the sea urchin homolog of protein 8 from the human large ribosomal subunit, and indicates samples that contain a cell. Samples with cells were evaluated for SpTrf transcripts by nested RT-PCR using four pairs of primers (1–4) on each sample that would amplify different sequence versions of SpTrf cDNAs. Green sample numbers indicate multiple bands amplified by the fours primer pairs. Blue sample numbers indicate a single amplicon for a single pair of primers. Samples indicated in red were chosen for sequencing. X indicates failed or ambiguous sequence results. This figure is reproduced from Ref. (41) with permission. Copyright 2014. The American Association of Immunologists, Inc.
Figure 8
Figure 8
Diversity of the SpTransformer (SpTrf) proteins. (A) Sea urchins (#6 and #25) challenged with lipopolysaccharide (L) at 0 h (left lane) and after 320 h (right lane) were sampled for SpTrf diversity by Western blot 96 h after each injection. Two different sea urchins (#22 and 31) were challenged and analyzed similarly, but the second injection was peptidoglycan (P). Under both protocols, the SpTrf+ bands show diversity that varies with animal and challenge. This figure is reproduced from Ref. (36) with permission. Copyright 2009. The American Association of Immunologists, Inc. (B) Significant diversity in the SpTrf protein arrays from the coelomic fluid (CF) is illustrated by a 2D Western blot. The multiple horizontal protein trains suggest posttranslational modifications to proteins of the same molecular weight that alters the pI. Most of the proteins are present in the acidic range after isoelectric focusing. This figure is reproduced from Ref. (36) with permission. Copyright 2009. The American Association of Immunologists, Inc. (C) SpTrf proteins from the CF and isolated by nickel affinity show horizontal protein trains on a 2D Western blot as in (B). However, nickel-isolated proteins tend to be basic, which is consistent with the preponderance of histidines in the C-terminal region of full-length proteins. This figure is reprinted from Ref. (33).
Figure 9
Figure 9
The deduced structure and element pattern of rSpTransformer-E1 (rSpTrf-E1) and binding characteristics toward bacteria and yeast. (A) The deduced, full-length rSpTrf-E1 sequence predicts a leader (indicated), which is likely cleaved from the mature protein, plus a glycine-rich region (orange text) and a histidine-rich region (blue text). This structure is consistent with the standard SpTransformer (SpTrf) structure (see Figure 6A). The mature rSpTrf-E1 protein is composed of a mosaic of elements (colored blocks) that are defined by gaps based on the “cDNA-based” alignment (see Figure 2A for matching element colors) and is defined as an E1 element pattern according to Terwilliger et al. (6). The full-length rSpTrf-E1 and the recombinant fragments are indicated. This figure is modified from Ref. (48). (B) rSpTrf-E1 labeled with FITC (rSpTrf-E1-FITC) shows saturable binding to Vibrio diazotrophicus based on the increasing fluorescence events by flow cytometry with increasing protein concentration. rSpTrf-E1-FITC does not bind to Bacillus sutbtilis or B. cereus. (C) rSpTrf-E1-FITC binds to Saccharomyces cerevisiae and shows two independent non-linear binding curves (separated by gray dotted vertical line) based on fluorescence events from flow cytometry. Both curves indicate strong binding and the second curve (right of the dotted line) shows a saturable binding plateau. Results suggest specific saturable binding either to different sites on S. cerevisiae, or by different mechanisms. (D) rSpTrf-E1-FITC binds to specific sites on V. diazotrophicus. Binding competition with a fixed saturable concentration of rSpTrf-E1-FITC (as determined in (B) and set to 100% fluorescence) and mixed with increasing concentrations of unlabeled rSpTrf-E1 results in decreased fluorescence intensity (FI) of V. diazotrophicus by flow cytometry. This indicates that the proteins compete for the same sites. Data are shown as the mean ± 1 SD of three independent experiments. This figure is from Ref. (3). Figure 4E. (E) As in (D), competition binding using a saturable level of rSpTrf-E1-FITC [as determined in (C) and set to 100% fluorescence] with increasing concentrations of unlabeled rSpTrf-E1 results in decreased FI of S. cerevisiae by flow cytometry. Results show two competition curves that correlate with the binding curves in (C). Data are shown as the mean ± 1 SD of three independent experiments. Panels (B–E) are reprinted from Ref. (3) with permission from Elsevier.
Figure 10
Figure 10
rSpTransformer-E1 (rSpTrf-E1) and the recombinant histidine-rich (rHis-rich) fragment bind to the same sites on yeast, the recombinant glycine-rich fragment (rGly-rich) fragment has expanded binding, and rSpTrf-E1 binds strongly and specifically to several pathogen-associated molecular patterns (PAMPs). (A) The full-length rSpTrf-E1 competes for binding sites on Saccharomyces cerevisiae with fixed concentrations of both rGly-rich and rHis-rich fragments. Increasing concentrations of rSpTrf-E1 decreases binding by rGly-rich-FITC to yeast by 40% and decreases binding by the rHis-rich-FITC to yeast by 100% as indicated by fluorescence intensity (FI). rSpTrf-E1 and the rHis-rich fragment likely bind to the same sites, whereas the rGly-rich fragment targets additional sites on yeast. (B) rSpTrf-E1 binds moderately strongly to lipopolysaccharide (LPS), β-1,3-glucan (glucan), and flagellin but does not bind to peptidoglycan (PGN) as evaluated by ELISA with immobilized PAMPs in wells of a 96-well plate and increasing concentrations of rSpTrf-E1. Binding is detected with an anti-SpTrf (formerly anti-Sp185/333) antibodies followed by Goat-anti-Rabbit-Ig-HRP and measured at 405 nm. Results are shown as the mean ± 1 SD of three independent experiments. (C) Preincubation of rSpTrf-E1 with increasing concentrations of various PAMPs in solution interferes with rSpTrf-E1 binding to immobilized LPS. Preincubation with LPS reduces binding to immobilized LPS as expected, and both β-1,3-glucan and flagellin also reduce rSpTrf-E1 binding to immobilized LPS. However, PGN does not interfere. Detection of rSpTrf-E1 bound to LPS in wells is done by ELISA with anti-SpTrf antibodies, Goat-anti-Rabbit-Ig-HRP and measured at 405 nm. Results are presented as the mean ± 1 SD of three independent experiments. These figures are reprinted from Ref. (3) with permission from Elsevier.
Figure 11
Figure 11
rSpTransformer-E1 (rSpTrf-E1) causes membrane instability and induces liposomes to bud, fuse, invaginate, and leak contents. (A) Liposomes composed of 10% phosphatidic acid (PA) and 90% phosphatidylcholine are shown filled with dextran labeled with Alexa Fluor® 488 (green) and the membranes labeled with DiD (red). When in the presence of rSpTrf-E1, liposome labeled #1 shows budding or fission resulting in three liposomes (a–d, arrows). Images were captured by confocal microscopy every 30 s as indicated. Leakage of luminal green dextran is suggested from the black areas in the lumens of some liposomes (c,d, circles). (B) Two liposomes of different sizes fuse in the presence of rSpTrf-E1 (a,b, orange arrows). The fused liposome proceeds to invagination (c,d, orange arrows). Note the dark region in the lumen near the convex region of the liposome in (c), which is the site of invagination (d) that forms an internal liposome without luminal dextran labeled with Alexa Fluor® 488 (dextran-488). Images were captured by confocal microscopy every 30 s as indicated. (C) Only the monomeric rSpTrf-E1 and the recombinant histidine-rich (rHis-rich) fragment induce dextran-488 leakage from liposomes. Liposomes loaded with 10 mM 8-aminonaphthalene-1,3,6-trisulfonic acid disodium salt (ANTS; fluorescent dye) and 15 mM p-xylene-Bis-pyridinium bromide (DPX; quencher) are incubated with 10 µM recombinant proteins. Luminal leakage separates ANTS from DPX by dilution into the buffer, which is excited at 360 nm and detected at 520 nm as fractional fluorescence relative to the control (lysed to measure 100% release). In the presence of monomeric rSpTrf-E1 and the rHis-rich fragment, luminal content leakage increases over time. Neither dimeric rSpTrf-E1 nor the rGly-rich fragment induce luminal content leakage from liposomes. (D) rSpTrf-E1 clusters PA in liposome membranes. A liposome composed of 10% fluorescent blue PA (1-oleoyl-2-{6-[(7-nitro-2-1,3-benzoxadiazol-4-yl)amino]hexanoyl}-sn-glycero-3-phosphate; NBD-PA; a, blue channel) plus the lipophilic dye DiD (b, red channel; c, merge) shows a PA cluster (arrows) at the intersection of two liposomes after 20 min of incubation with rSpTrf-E1. (E) NBD-PA is clustered (arrow) at the convex curve in a liposome membrane after 20 min of incubation with rSpTrf-E1. This image is a merge of the blue and red channels. (F) A control liposome shows no change in the distribution of NBD-PA after 20 min without rSpTrf-E1. This image is a merge of the blue and red channels. (G) Liposomes show clusters of NBD-PA after 20 min in the presence of rSpTrf-E1. One liposome shows extraction of NBD-PA from the membrane (arrow; blue channel only). (H) NBD-PA is extracted from liposome membranes after 2 h of incubation with rSpTrf-E1 and forms disordered clusters that are separated from liposomes (arrow). (I) Control liposomes show an even distribution of NBD-PA in the liposome membrane after 2 h in the absence of rSpTrf-E1 (merge of blue and red channels). Images in (A,B,D–I) were captured by confocal microscopy and all scale bars indicate 10 µm. These figures are reprinted from Ref. (5).
Figure 12
Figure 12
A model for SpTransformer (SpTrf) protein functions for clearance of bacteria from the coelomic fluid (CF). Individual phagocytes secrete a single SpTrf protein variant (41), which is illustrated by individual phagocytes (red, green, blue) producing different (color coded) SpTrf protein variants. Bioinformatic predictions of many deduced SpTrf sequences and circular dichroism results for rSpTransformer-E1 (4) indicate that these proteins are likely intrinsically disordered proteins (IDPs) (squiggles). Upon interaction with or binding to targets in the CF, they transform to α helical structures (corkscrews). Whether the SpTrf proteins associate directly with phospholipids on the surface of small phagocytes (green cell) or whether SpTrf proteins associate with any phagocyte type through putative membrane receptor(s) (black rectangles) remain unknown and await investigation. When vesicle membranes fuse with the cell membrane, the membrane-bound SpTrf proteins are exposed on the surface of the small phagocyte (green cell) (44). Other SpTrf proteins that are secreted by nearby polygonal phagocytes and released into the CF likely bind quickly to pathogens through pathogen-associated molecular patterns (lipopolysaccharide, flagellin, or both) on the pathogen surface and swiftly transform from IDPs to proteins with ordered structure forming helices. Alternatively, secreted SpTrf proteins may bind to the surface of small phagocytes through multimerization with other membrane-bound SpTrf proteins, or may bind directly to phospholipids or to putative receptor(s) (black rectangles). The secreted SpTrf proteins that bind to pathogens may function as opsonins and trigger phagocytosis and pathogen clearance. The insert at the top left illustrates a theoretical clustering of phosphatidic acid (green triangles) in the outer leaflet of a phagocyte plasma membrane (represented as the double black line) by SpTrf proteins bound to the bacterium and induce the concave curvature in the membrane that may aid in the formation of the phagosome and uptake of a microbe. Other mechanisms that are known to be involved with phagosome formation are not shown.
Figure 13
Figure 13
Five levels of diversification in the SpTransformer (SpTrf) system.

References

    1. Smith LC, Coscia MR. Tuning the host-pathogen relationship through evolution with a special focus on the echinoid Sp185/333 system. Invertebr Survival J (2016) 13:355–73.
    1. Oren M, Barela Hudgell MA, Golconda P, Lun CM, Smith LC. Genomic instability and shared mechanisms for gene diversification in two distant immune gene families: the echinoid 185/333 and the plant NBS-LRR. In: Malagoli D, editor. The Evolution of the Immune System: Conservation and Diversification. London, UK: Elsevier-Academic Press; (2016). p. 295–310.
    1. Lun CM, Schrankel CS, Chou H-Y, Sacchi S, Smith LC. A recombinant Sp185/333 protein from the purple sea urchin has multitasking binding activities towards certain microbes and PAMPs. Immunobiology (2016) 221:889–903.10.1016/j.imbio.2016.03.006 - DOI - PubMed
    1. Lun CM, Bishop BM, Smith LC. Multitasking immune Sp185/333 protein, rSpTransformer-E1, and its recombinant fragments undergo secondary structural transformation upon binding targets. J Immunol (2017) 198:2957–66.10.4049/jimmunol.1601795 - DOI - PubMed
    1. Lun CM, Samuel RL, Gillmor SD, Boyd A, Smith LC. The recombinant sea urchin immune effector protein, rSpTransformer-E1, binds to phosphatidic acid and deforms membranes. Front Immunol (2017) 8:481.10.3389/fimmu.2017.00481 - DOI - PMC - PubMed

LinkOut - more resources