. 2017:2:15.
doi: 10.1038/s41525-017-0014-7. Epub 2017 Apr 26.

Genomic landscape of high-grade meningiomas

Affiliations

Genomic landscape of high-grade meningiomas

Wenya Linda Bi et al. NPJ Genom Med. 2017.

Erratum in

  • Erratum: Genomic landscape of high-grade meningiomas.
    Bi WL, Greenwald NF, Abedalthagafi M, Wala J, Gibson WJ, Agarwalla PK, Horowitz P, Schumacher SE, Esaulova E, Mei Y, Chevalier A, A Ducar M, Thorner AR, van Hummelen P, O Stemmer-Rachamimov A, Artyomov M, Al-Mefty O, Dunn GP, Santagata S, Dunn IF, Beroukhim R. Bi WL, et al. NPJ Genom Med. 2017 Sep 4;2:26. doi: 10.1038/s41525-017-0023-6. eCollection 2017. NPJ Genom Med. 2017. PMID: 29263836 Free PMC article.

Abstract

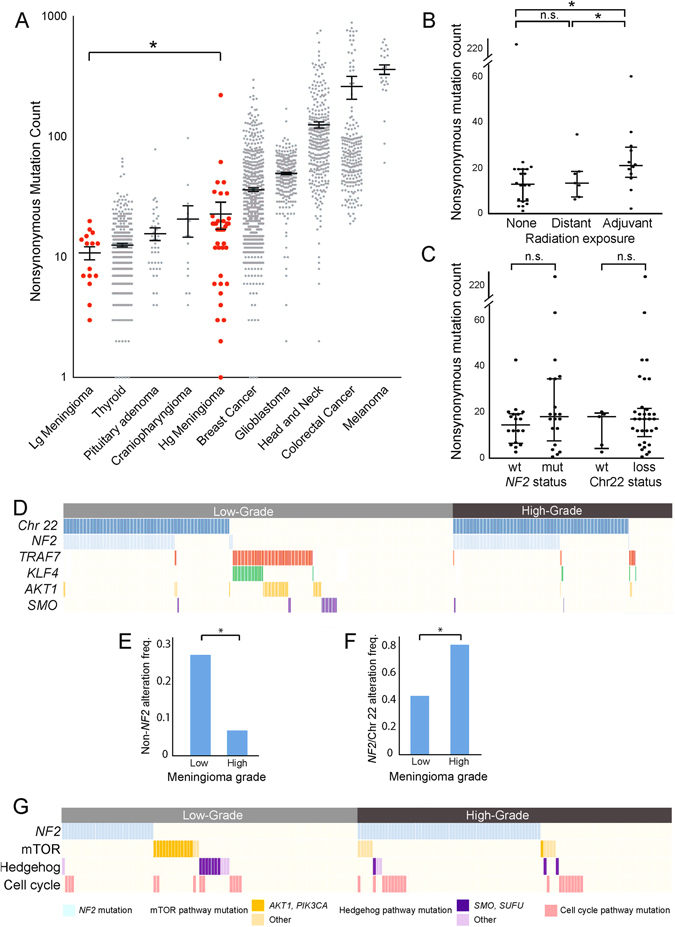
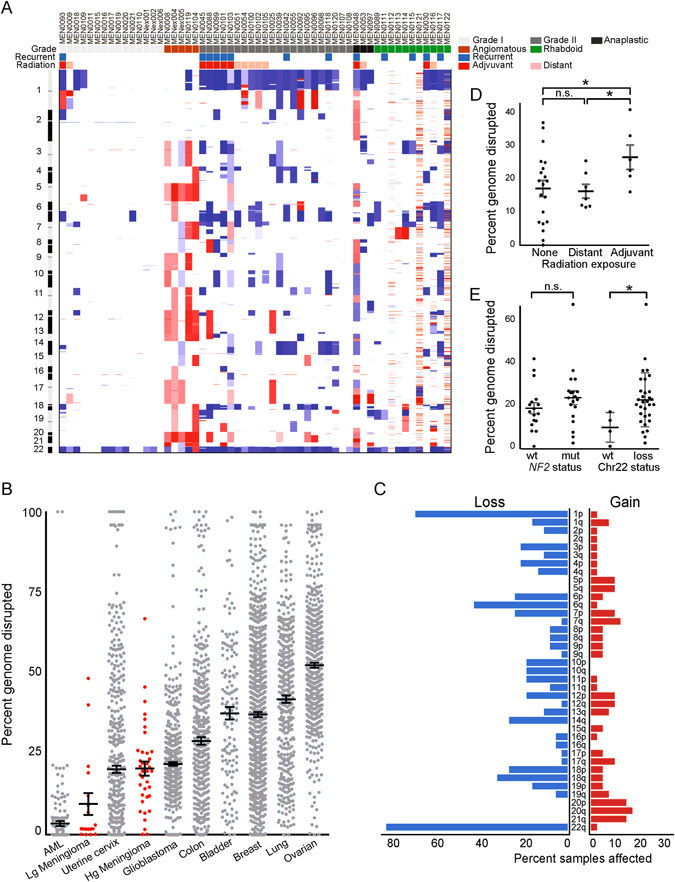
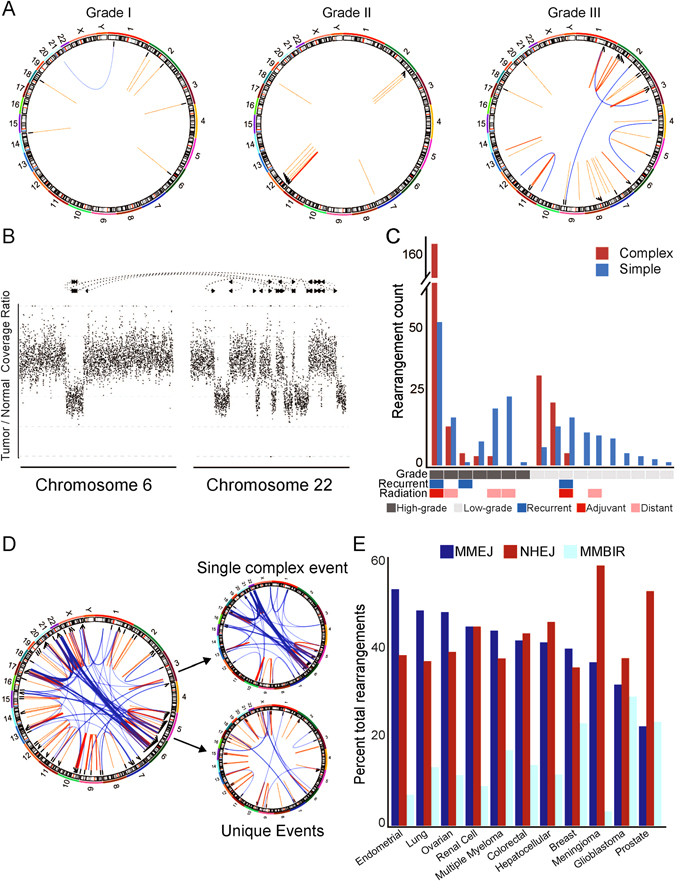
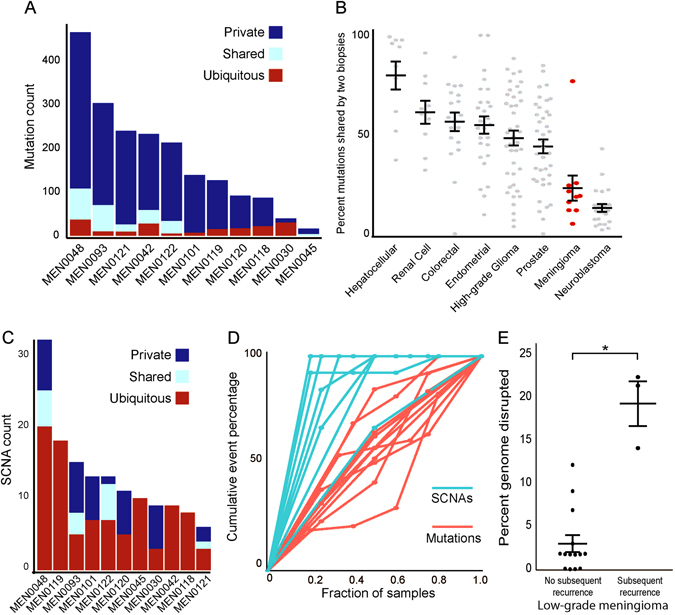
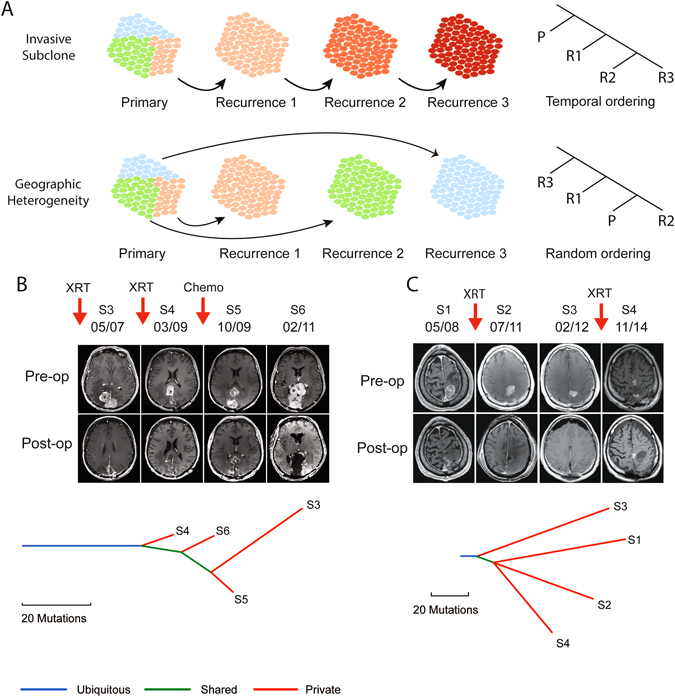
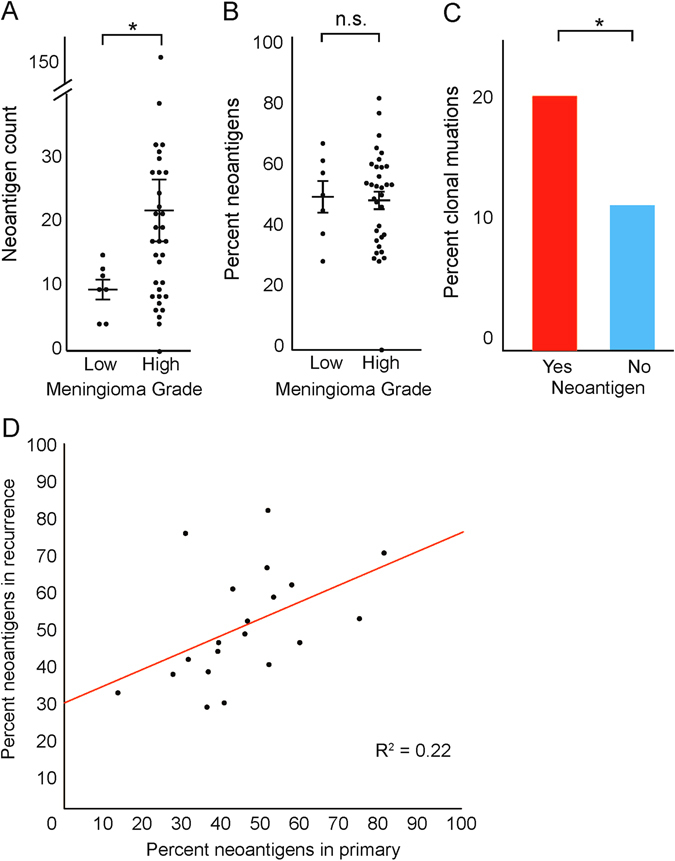
High-grade meningiomas frequently recur and are associated with high rates of morbidity and mortality. To determine the factors that promote the development and evolution of these tumors, we analyzed the genomes of 134 high-grade meningiomas and compared this information with data from 587 previously published meningiomas. High-grade meningiomas had a higher mutation burden than low-grade meningiomas but did not harbor any statistically significant mutated genes aside from NF2. High-grade meningiomas also possessed significantly elevated rates of chromosomal gains and losses, especially among tumors with monosomy 22. Meningiomas previously treated with adjuvant radiation had significantly more copy number alterations than radiation-induced or radiation-naïve meningiomas. Across serial recurrences, genomic disruption preceded the emergence of nearly all mutations, remained largely uniform across time, and when present in low-grade meningiomas, correlated with subsequent progression to a higher grade. In contrast to the largely stable copy number alterations, mutations were strikingly heterogeneous across tumor recurrences, likely due to extensive geographic heterogeneity in the primary tumor. While high-grade meningiomas harbored significantly fewer overtly targetable alterations than low-grade meningiomas, they contained numerous mutations that are predicted to be neoantigens, suggesting that immunologic targeting may be of therapeutic value.


Conflict of interest statement

The authors declare no competing interests.

Figures

Fig. 1
Fig. 1
Mutational characteristics of high-grade meningioma. a Nonsynonymous mutation counts (y-axis) per sample for a selection of tumor types (x-axis). b Nonsynonymous mutation counts (y-axis) for meningiomas stratified by prior radiation exposure (x-axis). c Nonsynonymous mutation counts (y-axis) for meningiomas with or without NF2 mutations or chromosome 22 loss (x-axis). d Chromosome 22 loss or canonical meningioma gene mutation (y-axis) across 702 aggregated samples (x-axis); each column represents one sample and white space indicates lack of coverage. e Percentage of samples (y-axis) with NF2 mutation or chromosome 22 loss stratified by grade (x-axis). f Percentage of samples (y-axis) with non-NF2 driver mutations stratified by grade (x-axis). g Presence of mutations in meningioma-associated pathways (y-axis) across 200 samples with genomic characterization (x-axis). Dark colors correspond to canonical alterations; lighter hues represent non-canonical alterations in the pathway. Lg meningioma low-grade meningioma, Hg meningioma high-grade meningioma, wt wild-type, mut mutant, n.s. not significant. Error bars and central values represent mean with s.e.m. (a) or median with i.q.r. (b, c)
Fig. 2
Fig. 2
Landscape of copy number alterations in meningioma. a Heatmap of gains (red) and losses (blue) across the genome (y-axis) for 56 samples (x-axis) with whole exome or WGS. Pathological features, primary or recurrent status, and exposure to distant (radiation-induced) or recent adjuvant radiation are annotated. b Percent genome disrupted (y-axis) for low-grade and high-grade meningiomas, as compared with eight other cancers (x-axis). c Percent incidence (x-axis) of chromosome arm-level gains and losses (y-axis). d Percent of genome disrupted (y-axis) for meningiomas stratified by radiation exposure (x-axis). e Percent of genome disrupted (y-axis) for meningiomas stratified by NF2 mutation or chromosome 22 loss (x-axis); angiomatous meningiomas were excluded due to their markedly different genomic profile. AML acute myeloid leukemia, Lg meningioma low-grade meningioma, Hg meningioma high-grade meningioma, GBM glioblastoma, n.s. not significant. Error bars and central values represent mean with s.e.m
Fig. 3
Fig. 3
Characteristics of meningioma rearrangements. a Representative Circos plots for three samples (MEN0042, MEN0011, MEN0053), with lines between genomic coordinates representing intrachromosomal (orange) or interchromosomal (blue) rearrangements. b Example of a complex event involving multiple genomic positions (x-axis) with associated changes in read coverage (y-axis). c Number of rearrangements (y-axis) per sample (x-axis) broken down by complex (orange) or simple (blue) event type. d Circos plot of a hyper-rearranged grade III meningioma and the deconstruction of complex and simple rearrangements to the overall makeup of this sample. e Percent incidence of different mechanisms driving rearrangement formation (y-axis) across multiple cancer types (x-axis). MMEJ micro-homology-mediated end joining, NHEJ non-homologous end joining, MMBIR micro-homology-mediated break-induced repair
Fig. 4
Fig. 4
Intra-patient heterogeneity in meningioma. a Mutation count (y-axis) across 11 recurrent samples (x-axis) for mutations that are present in all biopsies (ubiquitous, red), some biopsies (shared, teal), or only a single biopsy (private, blue). b Percent of mutations shared from pairs of samples from the same patient (y-axis) across a variety of diverse cancer types (x-axis).–, , , , c SCNA count (y-axis) across 11 recurrent samples (x-axis) for SCNAs that are present in all biopsies (ubiquitous, red), some biopsies (shared, teal), or only a single biopsy (private, blue). d Cumulative percentage of events per patient (y-axis) as a function of the percentage of samples examined (x-axis) for mutations (red) and SCNAs (teal). e Percent of genome disrupted (y-axis) for low-grade meningiomas, stratified by whether or not they went on to recur (x-axis). Error bars and central values represent mean with s.e.m
Fig. 5
Fig. 5
Phylogenetic analysis of recurrent meningioma. a Schematic illustrating the expected phylogenetic relationship across successive recurrences if a tumor evolves through progressive dominance of an invasive subclone (top) compared with outgrowth of subclones from a geographically heterogeneous primary (bottom). b Patient with a multiply recurrent parasagittal anaplastic meningioma that underwent serial resections as well as interval radiation (XRT) and sunitinib (chemo). Pre-operative and post-operative MR imaging (top) from the third (S3), fourth (S4), fifth (S5), and sixth (S6) resections, spanning a 4-year interval, demonstrates a heterogeneous pattern and location of tumor regrowth despite excellent resections. Phylogenetic tree (bottom) demonstrates a branched evolution of the mutations associated with each tumor resection (S3–S6). c Pre-operative and post-operative MRIs (top) and phylogenetic tree (bottom) of four serial resections (S1–S4) over 6 years in a patient with recurrent rhabdoid meningioma
Fig. 6
Fig. 6
Analysis of predicted neoantigen load in meningioma. a Number of predicted neoantigens (y-axis) in low-grade and high-grade meningioma (x-axis). b Percentage of identified neoantigens (y-axis) in low-grade and high-grade meningioma (x-axis). c Percentage of mutations which are present in all tumor cells (y-axis) stratified by whether they are predicted to be immunogenic (x-axis). d Percentage of mutations in the primary (x-axis) which are predicted to be neoantigens vs. percentage of mutations in matched recurrence (y-axis) which are predicted to be neoantigens. Error bars and central values represent mean with s.e.m

References

    1. Ostrom QT, et al. CBTRUS statistical report: primary brain and central nervous system tumors diagnosed in the United States in 2008-2012. Neuro. Oncol. 2015;17:iv1–iv62. doi: 10.1093/neuonc/nov189. - DOI - PMC - PubMed
    1. Louis, D., Ohgaki, H., Wiestler, O. D. & Cavenee, W. K. WHO Classification of Tumours of the Central Nervous System, 408 (International Agency for Research on Cancer, 2016).
    1. Wen PY, et al. Medical therapies for meningiomas. J. Neurooncol. 2010;99:365–378. doi: 10.1007/s11060-010-0349-8. - DOI - PubMed
    1. Rouleau GA, et al. Alteration in a new gene encoding a putative membrane-organizing protein causes neuro-fibromatosis type 2. Nature. 1993;363:515–521. doi: 10.1038/363515a0. - DOI - PubMed
    1. Ruttledge MH, et al. Evidence for the complete inactivation of the NF2 gene in the majority of sporadic meningiomas. Nat. Genet. 1994;6:180–184. doi: 10.1038/ng0294-180. - DOI - PubMed

LinkOut - more resources