. 2017 Jul 11:5:e3557.
doi: 10.7717/peerj.3557. eCollection 2017.

Methodological considerations in assessment of language lateralisation with fMRI: a systematic review

Affiliations

Methodological considerations in assessment of language lateralisation with fMRI: a systematic review

Abigail R Bradshaw et al. PeerJ. .

Abstract

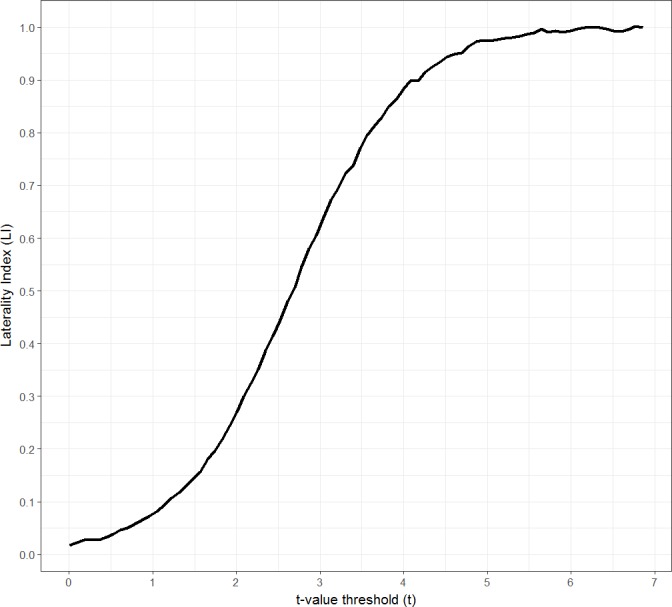
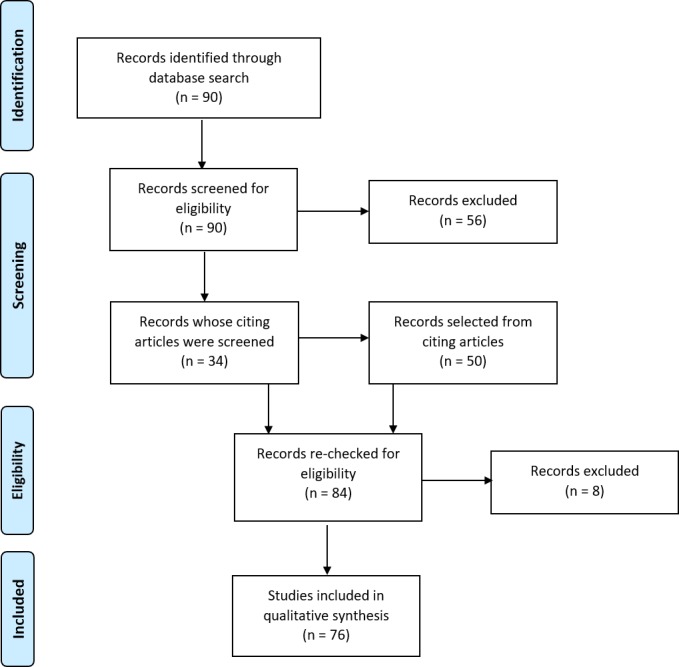
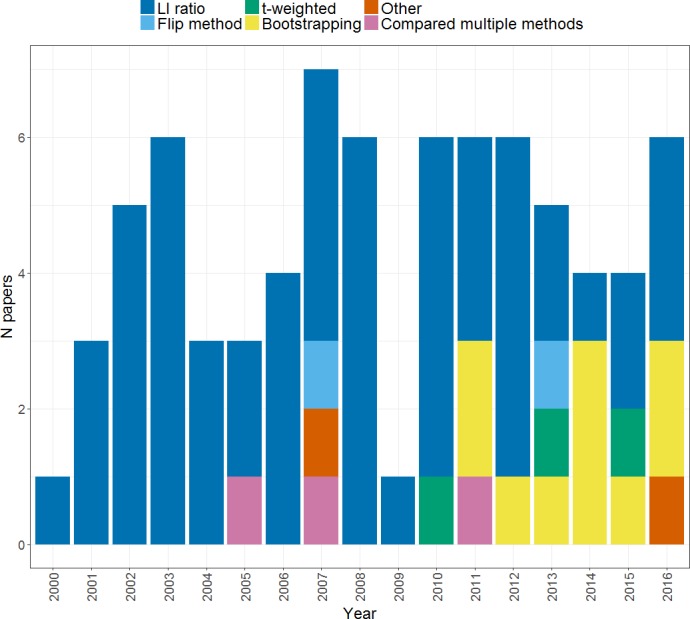
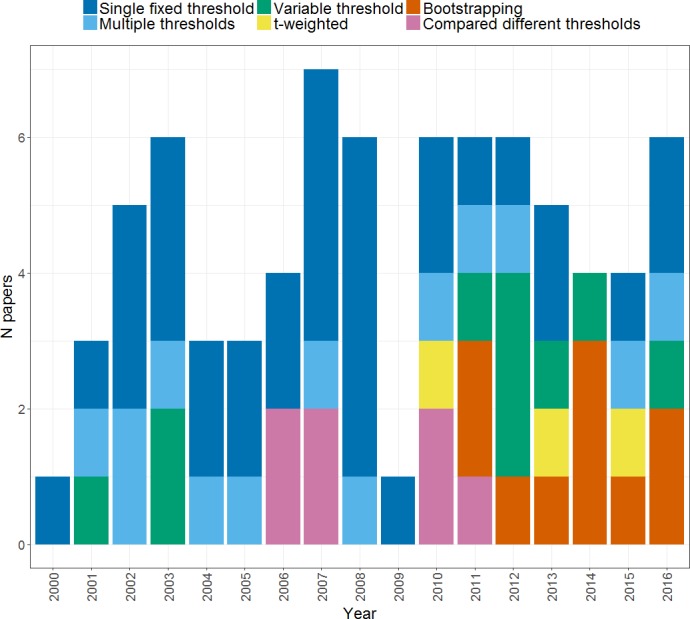
The involvement of the right and left hemispheres in mediating language functions has been measured in a variety of ways over the centuries since the relative dominance of the left hemisphere was first known. Functional magnetic resonance imaging (fMRI) presents a useful non-invasive method of assessing lateralisation that is being increasingly used in clinical practice and research. However, the methods used in the fMRI laterality literature currently are highly variable, making systematic comparisons across studies difficult. Here we consider the different methods of quantifying and classifying laterality that have been used in fMRI studies since 2000, with the aim of determining which give the most robust and reliable measurement. Recommendations are made with a view to informing future research to increase standardisation in fMRI laterality protocols. In particular, the findings reinforce the importance of threshold-independent methods for calculating laterality indices, and the benefits of assessing heterogeneity of language laterality across multiple regions of interest and tasks. This systematic review was registered as a protocol on Open Science Framework: https://osf.io/hyvc4/.

Keywords: Language; Lateralisation; Systematic review; fMRI.


Conflict of interest statement

Dorothy Bishop is an Academic Editor and Academic Advisor for PeerJ.

Figures

Figure 1
Figure 1. Threshold dependent laterality curve.
Plot of LI as a function of threshold (t-value). Figure created by Paul A. Thompson, used with permission.
Figure 2
Figure 2. Search strategy and selection process.
Flow diagram illustrating the search and selection process for obtaining articles for inclusion in the review. Adapted from Moher et al. (2009).
Figure 3
Figure 3. Methods of calculating an LI.
Plot shows the frequency of papers within our search using each method of LI calculation across the years from 2000 to 2016.
Figure 4
Figure 4. Thresholding methods.
Plot shows the frequency of papers using each method of thresholding when calculating an LI across the years from 2000 to 2016.
Figure 5
Figure 5. Illustration of the t-weighting method.
A plot of voxel count as a function of t-score threshold (A) is multiplied with a weighting function (B) in which higher thresholds are given greater weight, to obtain a weighted distribution (C). The integrated areas under the right and left hemisphere curves can then be used for the standard LI equation. Figure created by Paul A. Thompson, used with permission.
Figure 6
Figure 6. Illustration of the bootstrapping method.
(A) Thresholding: contrast images are created across a range of thresholds from 0 to the maximum t-value. (B) Sampling: for each threshold level, a sample of t-values (size i) are randomly selected from the left and right ROIs . (C) Resampling: values from the sample vectors are randomly resampled n times, each with size r. (D) LI calculation: LI values are calculated for all possible combinations of right and left resamples, creating n2 LI values in total. (E) Histogram: steps (B)–(C) are repeated for all threshold levels, and all of the resulting LI values are plotted in one histogram. A trimmed mean, taken from the middle 50% of the data (shaded area), is used as the final LI measure.
Figure 7
Figure 7. Activation measure used for LI calculation.
Plot shows the frequency of papers within our search using each type of activation measure across the years from 2000 to 2016.
Figure 8
Figure 8. The flip method.
By contrasting a right-side contrast image with a mirror image (flipped so that the right hemisphere is on the left), a new contrast image is generated with significant voxels indicating regions in which left activity is statistically significantly greater than right homologue activity.
Figure 9
Figure 9. Methods of dominance classification.
Plot shows the different methods of classifying language dominance used by studies within our search across the period from 2000 to 2016. Note that studies within our search which did not classify dominance are not included in this plot.
Figure 10
Figure 10. Abbott et al.’s (2010) method of dominance classification.
The laterality curve of the subject (blue) is compared to that of a normative control group (black), using the lower 95% confidence interval for the control group (represented by the shaded area). Figure created by Paul A. Thompson, used with permission.
Figure 11
Figure 11. Mazoyer et al.’s (2014) method of dominance classification.
Histograms showing the distribution of LI values across samples of right handed (A) and left handed (B) individuals, with the envelope showing the Gaussian functions fitted to the data for determination of dominance groups. Reprinted from Mazoyer et al. (2014).
Figure 12
Figure 12. Use of global and regional approaches to LI calculation over time.
Plot shows the regional approaches used for LI calculation by studies within our search across the period from 2000 to 2016.

References

    1. Abbott DF, Waites AB, Lillywhite LM, Jackson GD. fMRI assessment of language lateralization: an objective approach. NeuroImage. 2010;50(4):1446–1455. doi: 10.1016/j.neuroimage.2010.01.059. - DOI - PubMed
    1. Adcock J, Wise R, Oxbury J, Oxbury S, Matthews P. Quantitative fMRI assessment of the differences in lateralization of language-related brain activation in patients with temporal lobe epilepsy. NeuroImage. 2003;18(2):423–438. doi: 10.1016/S1053-8119(02)00013-7. - DOI - PubMed
    1. Allendorfer JB, Hernando KA, Hossain S, Nenert R, Holland SK, Szaflarski JP. Arcuate fasciculus asymmetry has a hand in language function but not handedness. Human Brain Mapping. 2016;37(9):3297–3309. doi: 10.1002/hbm.23241. - DOI - PMC - PubMed
    1. Baciu M, Juphard A, Cousin E, Le Bas J. Evaluating fMRI methods for assessing hemispheric language dominance in healthy subjects. European Journal of Radiology. 2005;55(2):209–218. doi: 10.1016/j.ejrad.2004.11.004. - DOI - PubMed
    1. Berl MM, Zimmaro LA, Khan OI, Dustin I, Ritzl E, Duke ES, Sepeta LN, Sato S, Theodore WH, Gaillard WD. Characterization of atypical language activation patterns in focal epilepsy. Annals of Neurology. 2014;75(1):33–42. doi: 10.1002/ana.24015. - DOI - PMC - PubMed

LinkOut - more resources