. 2017 Apr 25;1(11):628-643.
doi: 10.1182/bloodadvances.2017006205.

Immune dysfunctionality of replicative senescent mesenchymal stromal cells is corrected by IFNγ priming

Affiliations

Immune dysfunctionality of replicative senescent mesenchymal stromal cells is corrected by IFNγ priming

Raghavan Chinnadurai et al. Blood Adv. .

Abstract

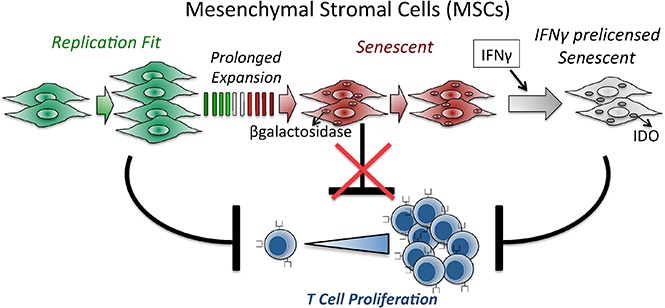
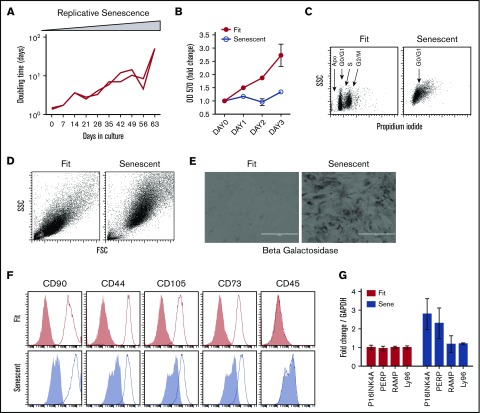
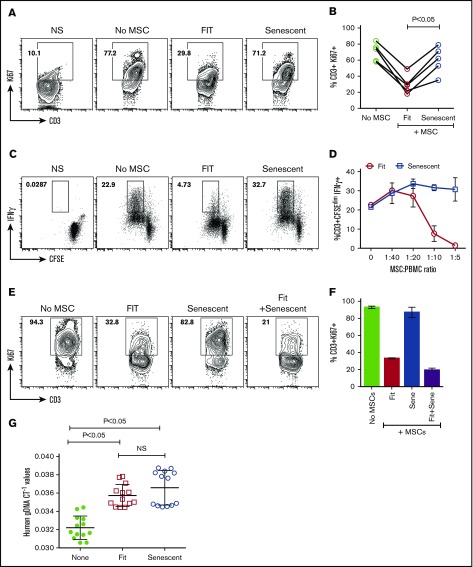
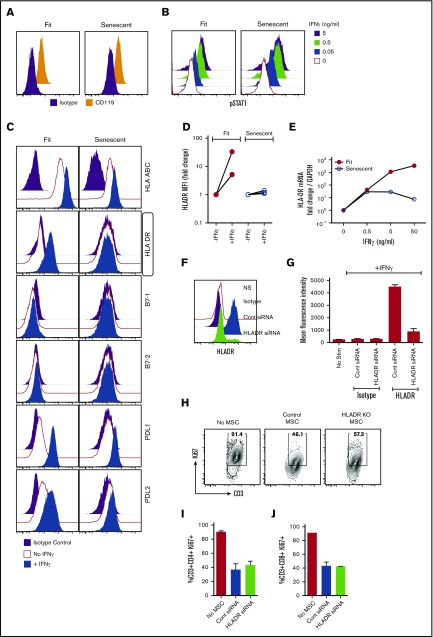
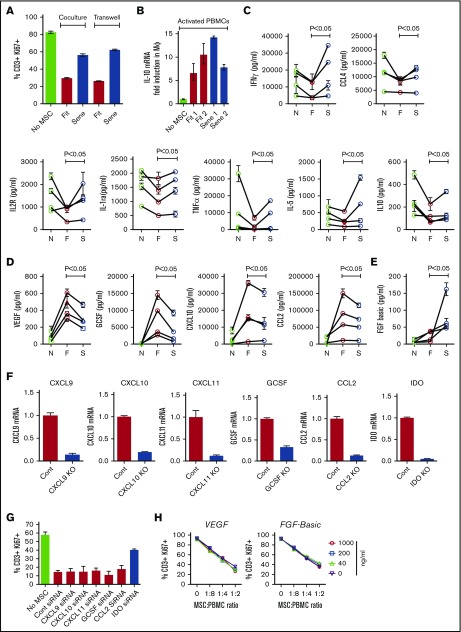
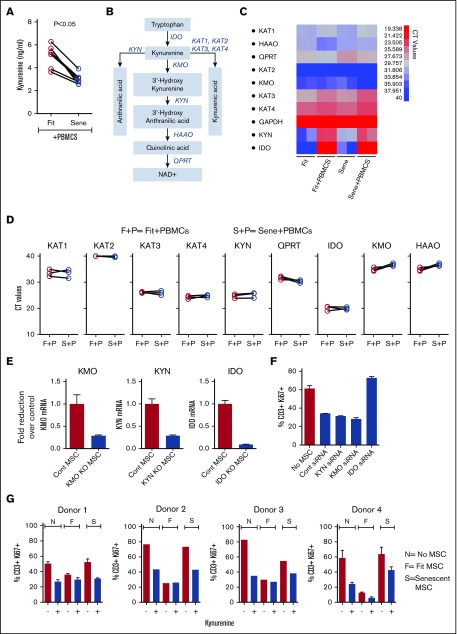
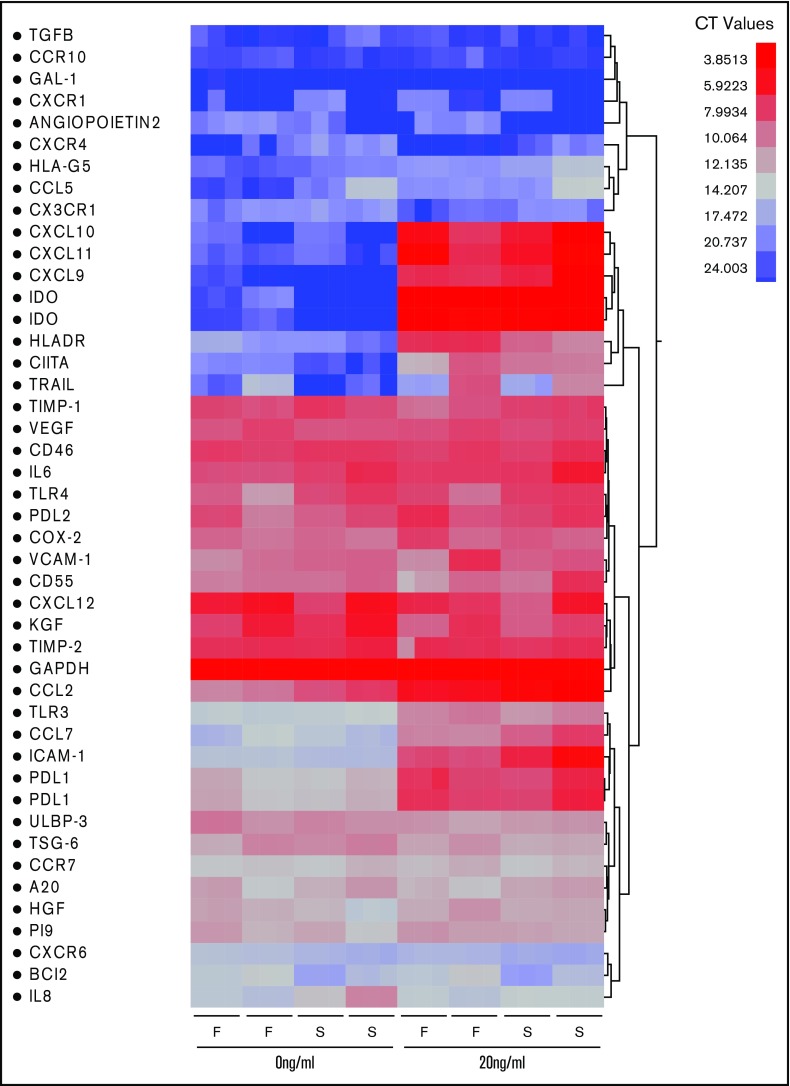
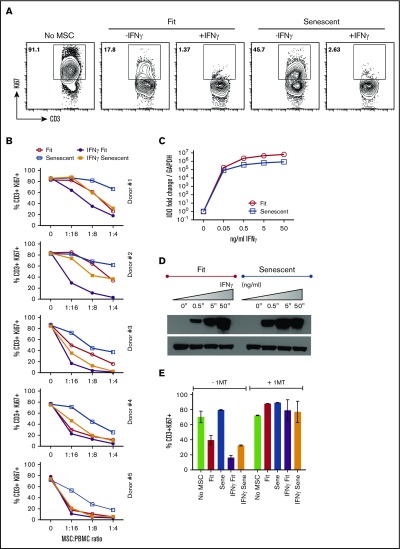
Industrial-scale expansion of mesenchymal stromal cells (MSCs) is often used in clinical trials, and the effect of replicative senescence on MSC functionality is of mechanistic interest. Senescent MSCs exhibit cell-cycle arrest, cellular hypertrophy, and express the senescent marker β-galactosidase. Although both fit and senescent MSCs display intact lung-homing properties in vivo, senescent MSCs acquire a significant defect in inhibiting T-cell proliferation and cytokine secretion in vitro. IFNγ does not upregulate HLA-DR on senescent MSCs, whereas its silencing did not reverse fit MSCs' immunosuppressive properties. Secretome analysis of MSC and activated peripheral blood mononuclear cell coculture demonstrate that senescent MSCs are significantly defective in up (vascular endothelial growth factor [VEGF], granulocyte colony-stimulating factor [GCSF], CXCL10, CCL2) or down (IL-1ra, IFNγ, IL-2r, CCL4, tumor necrosis factor-α, IL-5) regulating cytokines/chemokines. Unlike indoleamine 2,3 dioxygenase (IDO), silencing of CXCL9, CXCL10, CXCL11, GCSF, CCL2, and exogenous addition of VEGF, fibroblast growth factor-basic do not modulate MSCs' immunosuppressive properties. Kynurenine levels were downregulated in senescent MSC cocultures compared with fit MSC counterparts, and exogenous addition of kynurenine inhibits T-cell proliferation in the presence of senescent MSCs. IFNγ prelicensing activated several immunomodulatory genes including IDO in fit and senescent MSCs at comparable levels and significantly enhanced senescent MSCs' immunosuppressive effect on T-cell proliferation. Our results define immune functional defects acquired by senescent MSCs, which are reversible by IFNγ prelicensing.


Conflict of interest statement

Conflict-of-interest disclosure: The authors declare no competing financial interests.

Figures

None
Graphical abstract
Figure 1.
Figure 1.
Phenotypical characteristics of replicative senescent MSCs. (A) MSCs derived from the bone marrow of 2 healthy individuals were culture-passaged at the indicated time points. Doubling time was calculated based on the cell numbers at seeding and harvesting time points and duration of the culture. (B) MSCs from replicative fit and senescent phases were seeded at similar density in the 96-well plates. MTT assay was performed at the indicated time points to determine the growths of MSCs. Results are plotted as mean ± standard deviation (SD). (C) Cell-cycle analysis was performed on fit and senescent MSCs through propidium iodide staining and subjected to flow cytometry. (D) Size and granularity of fit and senescent MSCs were determined by forward and side scatter analysis by flow cytometry. (E) Fit and senescent MSCs were subjected to senescence-associated lysosomal β-galactosidase staining. Dark gray staining represents β-galactosidase staining. Scale bars represent 400 μm. (F) Replicative fit and senescent MSCs were subjected to staining for MSC markers as defined by the ISCT and acquired through flow cytometry. Open and gray histograms represent marker and isotype controls, respectively. Similar results were obtained in a repeat experiment with an additional 1 or 2 fit and senescent MSC donor pairs. (G) Fold difference in the P16INK4A, PERP, LAMP, and LY96 mRNA of fit and senescent MSCs, relative to glyceraldehyde 3-phosphate dehydrogenase (GAPDH), were determined in quantitative sybr green real-time PCR. Cumulative is shown from 2 independent donors.
Figure 2.
Figure 2.
Replicative senescent MSCs display attenuated immunosuppressive and intact lung-homing properties. Replicative fit and senescent MSCs were cultured with αCD3αCD28 Dynabeads-stimulated PBMCs. Four days post culture, T-cell proliferation was measured by Ki67 intracellular staining. (A) Representative fluorescence-activated cell sorting (FACS) plot and (B) cumulative effect of fit and senescent MSCs’ (n = 5 donor pairs) effect on T-cell proliferation (% CD3+Ki67+) is shown. CFSE-labeled PBMCs were cocultured with replicative fit and senescent MSCs and were stimulated with αCD3αCD28 Dynabeads. On the fourth day, intracellular cytokine staining was performed to determine the percentage of cytokine-secreting proliferated T cells CD3+CFSEdim IFNγ T cells. (C) Representative FACS plot and (D) dose-dependent effect are shown. Individual or mixed fit and senescent MSCs at 1:1 ratio were cultured with αCD3αCD28 Dynabeads-stimulated PBMCs and 4 days post culture, T-cell proliferation was measured as indicated above. (E) Representative FACS plot and (F) cumulative effect are shown. Similar results were obtained in a repeat experiment with an additional 1 or 2 fit and senescent MSC donor pairs. (G) Fit or senescent MSCs (0.5 × 10⁶/animal) were injected IV into C57BL/B6 mice via the tail vein. At 24 hours post-infusion, the animals were killed and the lungs were excised to extract total gDNA for real-time PCR amplification of human gDNA and mouse gDNA. Human gDNA threshold cycle (CT) values were normalized with mouse gDNA values. Cumulative inverse CT values with mean ± SD were shown from 2 independent experiments (n = 6 animals per group), performed with 2 unique fit and senescent MSC donors pairs. P < .05 was considered statistically significant based on 2-tailed Student t tests.
Figure 3.
Figure 3.
Senescence-associated defective HLA-DR upregulation does not modulate immunosuppressive properties of MSCs. (A) Fit and senescent MSCs were subjected to staining of the receptor for IFNγ (CD119) and acquired through flow cytometry. (B) Fit and senescent MSCs stimulated with indicated concentrations of IFNγ for 15 minutes. P-STAT1 (Y701) Phosflow was performed subsequently and acquired through flow cytometry. Similar results were obtained in a repeat experiment with an additional 1 or 2 fit and senescent MSC donor pairs. (C) Fit and senescent MSCs were stimulated with IFNγ for 48 hours and subsequently stained with the antibodies to the surface markers for HLA-ABC, HLA-DR, B7-1, B7-2, B7H1, and B7DC for flow cytometry. (D) Cumulative HLA-DR MFI fold change derived from 2 independent fit and senescent MSC donor pairs were shown. (E) Fit and senescent MSCs were stimulated with IFNγ for 48 hours. Expression level of HLA-DR mRNA relative to GAPDH was evaluated by the quantitative SYBR green real-time PCR. δ-δ CT method was applied to calculate the fold induction of HLA-DR over the unstimulated control. Control or HLA-DR siRNA-transfected MSCs were stimulated with IFNγ for 48 hours. Cells were trypsinized, stained for HLA-DR or appropriate isotype control antibodies, and analyzed by flow cytometry. (F) Representative histogram. (G) Cumulative mean fluorescent intensity of HLA-DR and isotype control antibody stains were shown on 2 independent fit and senescent MSC donor pairs. HLA-DR or control siRNA-transfected MSCs were cultured with αCD3αCD28 Dynabeads-stimulated PBMCs. Four days post culture, T-cell proliferation was measured by Ki67 intracellular staining. (H) Representative FACS plot and effect of MSCs on (I) CD3+CD4+ and (J) CD3+CD8+ T-cell proliferation are shown. Similar results were obtained in a repeat experiment with another MSC donor.
Figure 4.
Figure 4.
Differential secretome of activated PBMCs cocultured with fit and senescent MSCs. Replicative fit and senescent MSCs were cultured in the presence and absence of αCD3αCD28 Dynabeads-stimulated PBMCs in 2-chamber transwell plates. Four days post culture, T-cell proliferation was measured by Ki67 intracellular staining. (A) Relative effect of fit and senescent MSCs’ effect on T-cell proliferation (% CD3+Ki67+) in coculture and transwell culture are shown. Similar results were obtained in a repeat experiment with an additional 2 fit and senescent MSC donor pairs. (B) CD14+ purified macrophages were cultured on transwell and in the bottom PBMCs were activated with 2 independent fit or senescent MSC pairs. 48 hours later, macrophages in the transwell were harvested and IL-10 mRNA was measured with GAPDH mRNA as endogenous housekeeping control. Fold induction of IL-10 mRNA was derived through δ-δ CT method. Replicative fit and senescent MSCs were cultured in the presence and absence of αCD3αCD28 Dynabeads-stimulated PBMCs. Four days post culture, supernatant was collected and human cytokine 30-plex panel Luminex assays were performed according to the manufacturer’s instructions. Fit and senescent MSC pairs from 4 independent donors were tested against different PBMC donors. Cytokine levels were shown in pg/mL. F, fit MSCs and activated PBMCs; N, no MSCs and activated PBMCs; S, senescent MSCs and activated PBMCs. (C) IL-1ra, IFNγ, IL-2r, CCL4, TNFα, IL-5, and IL-10 were decreased efficiently by fit but not senescent MSCs. (D) VEGF, GCSF, CXCL10, and CCL2 were upregulated by fit MSCs cocultured with activated PBMCs and the senescent MSCs display attenuated upregulation. (E) FGF-basic was substantially increased by senescent MSCs compared with fit MSCs. (F) Control, CXCL9, CXCL10, CXCL11, GCSF, CCL2, and IDO siRNA-transfected MSCs were cultured with αCD3αCD28 Dynabeads-stimulated PBMCs in 2-chamber transwell plates for 3 to 4 days. Expression level of appropriate silenced mRNA relative to GAPDH was evaluated by quantitative SYBR green real-time PCR. δ-δ CT method was applied to calculate the fold induction of silenced gene over the control siRNA-transfected MSCs. (G) CXCL9, CXCL10, CXCL11, GCSF, CCL2, IDO, and control siRNA-transfected MSCs were cultured with αCD3αCD28 Dynabeads-stimulated PBMCs. Four days post culture, T-cell proliferation was measured by Ki67 intracellular staining. Proliferation of T cells (CD3+Ki67+) in the presence and absence of siRNA transfected MSCs is shown. Similar results were obtained in a repeat experiment with an additional independent MSC donor. (H) VEGF and FGF were added exogenously to fit MSCs cocultured with activated PBMCs at indicated ratios. Four days later, CD3+ T-cell proliferation was measured by Ki67 intracellular staining. Similar results were obtained in a repeat experiment with an additional independent MSC donor.
Figure 5.
Figure 5.
Exogenous addition of kynurenine corrects senescence-associated impaired immunosuppressive properties of MSCs. (A) Replicative fit and senescent MSCs were cultured in the presence and absence of αCD3αCD28 Dynabeads-stimulated PBMCs. Four days post culture, supernatant was collected and kynurenine levels were performed according to the manufacturer’s instructions. Cumulative of 6 donor pairs were shown. (B) Catabolism of kynurenine pathway and the enzymes that facilitate this cascade is shown with a cartoon adapted from reference . IDO, kynurenine aminotransferases (KAT), kynurenine 3-monooxygenase (KMO), KYN, 3-hydroxyanthranilate 3,4-dioxygenase (HAAO), and quinolinate phosphoribosyl transferase (QPRT). Fit and senescent MSCs were cultured in the presence and absence of αCD3αCD28 Dynabeads-stimulated PBMCs in 2-chamber transwell plates. Four days later, MSCs were harvested and the expression level of mRNA of kynurenine catabolic enzymes relative to GAPDH was evaluated by quantitative SYBR green real-time PCR. (C) Representative heat map with CT values (red = high expression, blue = low expression) and (D) cumulative comparison between fit and senescent MSC pairs from 3 unique donors is shown. F+P, fit MSCs + activated PBMCs; S+P, senescent MSCs + activated PBMCs. (E) Control, KYN, KMO, and IDO siRNA-transfected MSCs were cultured with αCD3αCD28 Dynabeads-stimulated PBMCs in 2-chamber transwell plates for 3 to 4 days. Expression level of appropriate silenced mRNA relative to GAPDH was evaluated by quantitative SYBR green real-time PCR. δ-δ CT method was applied to calculate the fold induction of silenced gene over the control siRNA-transfected MSCs. KYN, KMO, and IDO, and control siRNA-transfected MSCs were cultured with αCD3αCD28 Dynabeads-stimulated PBMCs. Four days post culture, T-cell proliferation was measured by Ki67 intracellular staining. (F) Proliferation of T cells (CD3+Ki67+) in the presence and absence of siRNA transfected MSCs is shown. Similar results were obtained in a repeat experiment with an additional independent MSC donor. (G) Kynurenine (500 uM) was added exogenously in the coculture of αCD3αCD28 Dynabeads-stimulated PBMCs with and without fit and senescent MSCs. Four days post culture, T-cell proliferation was measured by Ki67 intracellular staining. F, fit MSCs + activated PBMCs; N, no MSCs + activated PBMCs; S, senescent MSCs + activated PBMCs. Kynurenine’s effect on T-cell proliferation with 4 independent fit and senescent MSC donor pairs is shown.
Figure 6.
Figure 6.
Molecular genetic responses of fit and senescent MSCs to IFNγ. Fit and senescent MSC pairs derived from 2 independent donors were stimulated with 20 ng/mL IFNγ for 48 hours, and total cDNA were generated from RNA. Transcriptional profiles of >40 genes were investigated in Fluidigm nanoscale qPCR 48*48 array plates (n = 3/sample). Heat map of fit (F) and senescent (S) MSCs stimulated with ±20 ng/mL IFNγ showing the expression genes (red = high expression, blue = low expression). Heat map was generated using JMP software.
Figure 7.
Figure 7.
IFNγ prelicensed senescent MSCs display enhanced immunosuppressive activity through IDO. αCD3αCD28 Dynabeads-stimulated PBMCs were cocultured in the presence and absence ± IFNγ prelicensed (20 ng/mL for 48 hours) fit and senescent MSCs. Four days post culture, T-cell proliferation was measured by Ki67 intracellular staining. (A) Representative FACS plot and (B) dose-dependent T-cell inhibitory effect of ± IFNγ prelicensed fit and senescent MSC pairs from 5 independent donors is shown. (C) Fit and senescent MSCs were stimulated with IFNγ for 48 hours. Expression level of IDO mRNA relative to GAPDH was evaluated by quantitative SYBR green real-time PCR. δ-δ CT method was applied to calculate the fold induction of IDO over the unstimulated control. (D) IDO expression at protein level is shown by western blot analysis, and actin was used as an internal control. Similar results were obtained in a repeat experiment with an additional independent MSC donor. (E) ± IFNγ prelicensed fit and senescent MSCs were cocultured with activated PBMCs in the presence and absence of IDO blocker, 1MT. Four days after, T-cell proliferation was measured by flow cytometry. Similar results were obtained in a repeat experiment with another MSC donor pair.

References

    1. Phinney DG, Galipeau J, Krampera M, Martin I, Shi Y, Sensebe L. MSCs: science and trials. Nat Med. 2013;19(7):812. - PubMed
    1. Kallekleiv M, Larun L, Bruserud Ø, Hatfield KJ. Co-transplantation of multipotent mesenchymal stromal cells in allogeneic hematopoietic stem cell transplantation: a systematic review and meta-analysis. Cytotherapy. 2016;18(2):172-185. - PubMed
    1. Galipeau J. The mesenchymal stromal cells dilemma--does a negative phase III trial of random donor mesenchymal stromal cells in steroid-resistant graft-versus-host disease represent a death knell or a bump in the road? Cytotherapy. 2013;15(1):2-8. - PubMed
    1. Pittenger MF, Mackay AM, Beck SC, et al. Multilineage potential of adult human mesenchymal stem cells. Science. 1999;284(5411):143-147. - PubMed
    1. von Bahr L, Sundberg B, Lönnies L, et al. Long-term complications, immunologic effects, and role of passage for outcome in mesenchymal stromal cell therapy. Biol Blood Marrow Transplant. 2012;18(4):557-564. - PubMed