. 2017 Jul 17:8:16021.
doi: 10.1038/ncomms16021.

Transancestral mapping and genetic load in systemic lupus erythematosus

Carl D Langefeld  1   2 Hannah C Ainsworth  1   2 Deborah S Cunninghame Graham  3 Jennifer A Kelly  4 Mary E Comeau  1   2 Miranda C Marion  1   2 Timothy D Howard  1   5 Paula S Ramos  6   7 Jennifer A Croker  8 David L Morris  3 Johanna K Sandling  9 Jonas Carlsson Almlöf  9 Eduardo M Acevedo-Vásquez  10 Graciela S Alarcón  8 Alejandra M Babini  11 Vicente Baca  12 Anders A Bengtsson  13 Guillermo A Berbotto  14 Marc Bijl  15 Elizabeth E Brown  8 Hermine I Brunner  16 Mario H Cardiel  17 Luis Catoggio  18 Ricard Cervera  19 Jorge M Cucho-Venegas  10 Solbritt Rantapää Dahlqvist  20 Sandra D'Alfonso  21 Berta Martins Da Silva  22 Iñigo de la Rúa Figueroa  23 Andrea Doria  24 Jeffrey C Edberg  8 Emőke Endreffy  25 Jorge A Esquivel-Valerio  26 Paul R Fortin  27 Barry I Freedman  1   28 Johan Frostegård  29 Mercedes A García  30 Ignacio García de la Torre  31 Gary S Gilkeson  7 Dafna D Gladman  32 Iva Gunnarsson  33 Joel M Guthridge  4 Jennifer L Huggins  16 Judith A James  4   34 Cees G M Kallenberg  35 Diane L Kamen  7 David R Karp  36 Kenneth M Kaufman  37 Leah C Kottyan  37 László Kovács  38 Helle Laustrup  39 Bernard R Lauwerys  40 Quan-Zhen Li  36 Marco A Maradiaga-Ceceña  41 Javier Martín  42 Joseph M McCune  43 David R McWilliams  1   2 Joan T Merrill  4 Pedro Miranda  44 José F Moctezuma  45 Swapan K Nath  4 Timothy B Niewold  46 Lorena Orozco  47 Norberto Ortego-Centeno  48 Michelle Petri  49 Christian A Pineau  50 Bernardo A Pons-Estel  51 Janet Pope  52 Prithvi Raj  36 Rosalind Ramsey-Goldman  53 John D Reveille  54 Laurie P Russell  1   2 José M Sabio  55 Carlos A Aguilar-Salinas  56 Hugo R Scherbarth  57 Raffaella Scorza  58 Michael F Seldin  59 Christopher Sjöwall  60 Elisabet Svenungsson  33 Susan D Thompson  37 Sergio M A Toloza  61 Lennart Truedsson  62 Teresa Tusié-Luna  63 Carlos Vasconcelos  64 Luis M Vilá  65 Daniel J Wallace  66 Michael H Weisman  66 Joan E Wither  32 Tushar Bhangale  67 Jorge R Oksenberg  68 John D Rioux  69 Peter K Gregersen  70 Ann-Christine Syvänen  9 Lars Rönnblom  71 Lindsey A Criswell  72 Chaim O Jacob  73 Kathy L Sivils  4 Betty P Tsao  7 Laura E Schanberg  74 Timothy W Behrens  67 Earl D Silverman  75 Marta E Alarcón-Riquelme  4   76   77 Robert P Kimberly  8 John B Harley  37 Edward K Wakeland  36 Robert R Graham  67 Patrick M Gaffney  4 Timothy J Vyse  3
Affiliations

Transancestral mapping and genetic load in systemic lupus erythematosus

Carl D Langefeld et al. Nat Commun. .

Abstract

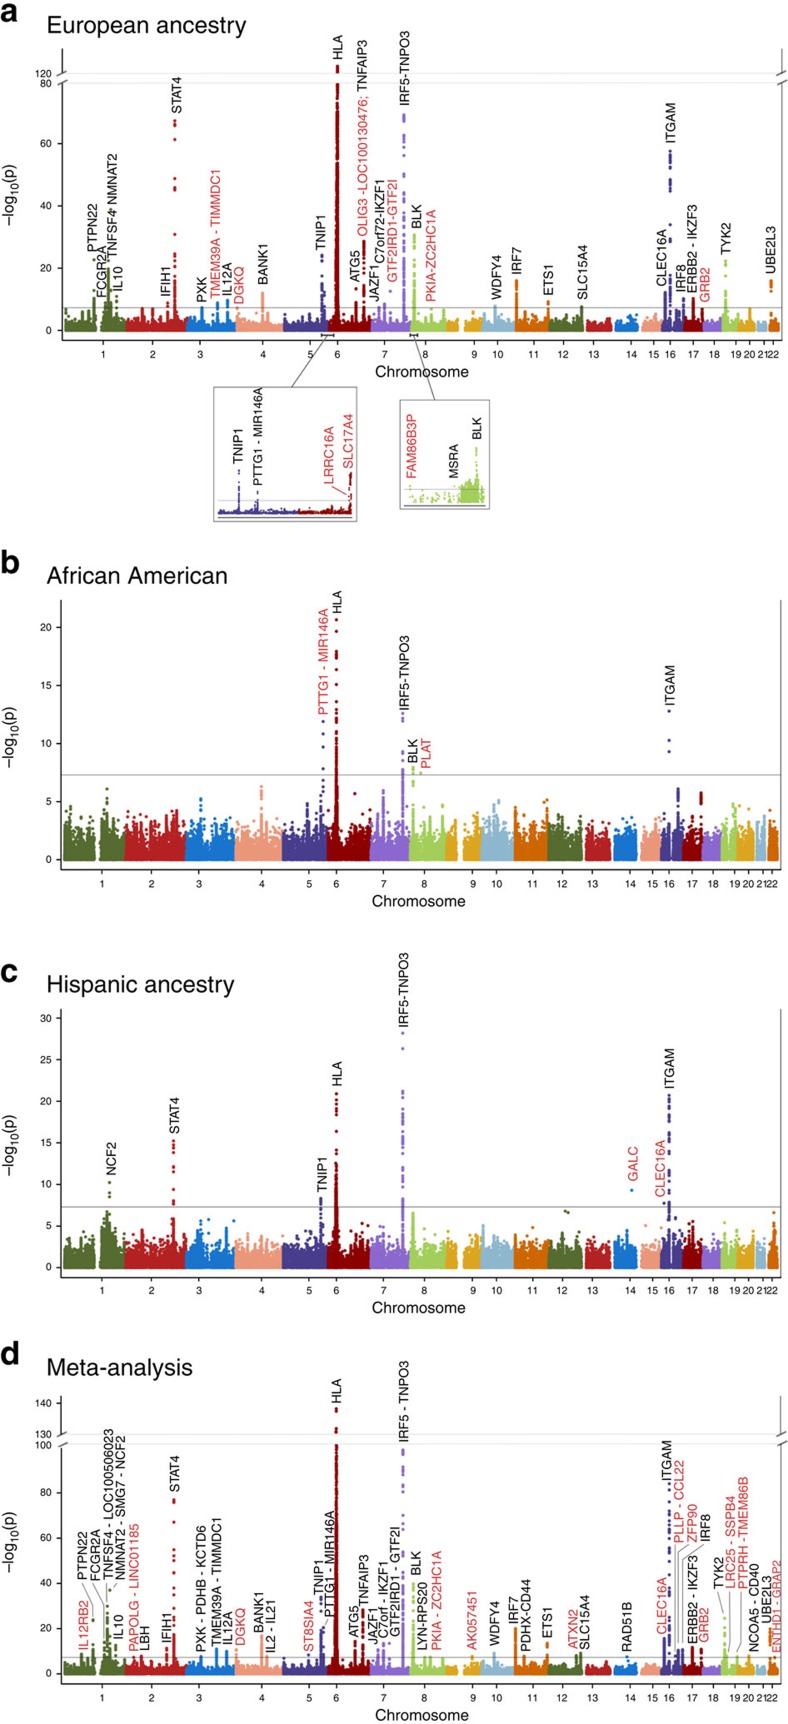
Systemic lupus erythematosus (SLE) is an autoimmune disease with marked gender and ethnic disparities. We report a large transancestral association study of SLE using Immunochip genotype data from 27,574 individuals of European (EA), African (AA) and Hispanic Amerindian (HA) ancestry. We identify 58 distinct non-HLA regions in EA, 9 in AA and 16 in HA (∼50% of these regions have multiple independent associations); these include 24 novel SLE regions (P<5 × 10⁻⁸), refined association signals in established regions, extended associations to additional ancestries, and a disentangled complex HLA multigenic effect. The risk allele count (genetic load) exhibits an accelerating pattern of SLE risk, leading us to posit a cumulative hit hypothesis for autoimmune disease. Comparing results across the three ancestries identifies both ancestry-dependent and ancestry-independent contributions to SLE risk. Our results are consistent with the unique and complex histories of the populations sampled, and collectively help clarify the genetic architecture and ethnic disparities in SLE.


Conflict of interest statement

R.R.G., T.B. and T.W.B. are employees of Genentech, Inc. The remaining authors declare no competing financial interests.

Figures

Figure 1
Figure 1. Genome-wide associations in SLE.
Manhattan plots for (a) European ancestry, (b) African American, (c) Hispanic ancestry, and the (d) meta-analysis. Tier 1 associations are labelled with novel regions highlighted in red. Genome-wide significance (5 × 10⁻⁸) is indicated on each plot.
Figure 2
Figure 2. HLA SNP associations with and without adjustment of classical HLA alleles.
SNPs spanning the extended MHC region showed significant associations across (a) European ancestry, (b) African American, (c) Hispanic ancestry, and the (d) meta-analysis. The classical HLA alleles, from the ethnic-specific stepwise-models (Supplementary Data 5), accounted for a majority of the MHC SNP signals. For each plot, the Tier 1 threshold, P≤5 × 10⁻⁸, is indicated by the red line. Associations, downstream in 6p21 spanning UHRF1BP1-DEF6 were largely unaffected after adjusting for classical HLA alleles and appear independent of the MHC.
Figure 3
Figure 3. Clustering of HLA Class II alleles by amino acid sequence similarity.
For (a) DRB1, (b) DQA1, and (c) DQB1, the odds ratios for each cohort are superimposed on the cluster if the SLE association P-value was less than 0.01. Alleles that were present in the multi-locus model from the stepwise procedure are also denoted. This process aims to identify clusters with shared SLE risk or not-risk odds ratios across the three cohorts. Such clusters help identify potential amino acid sequences contributing to SLE risk. For example, DRB1*15:01 and 15:03 are clustered amongst protective alleles, suggesting presence of specific amino acids differentiating risk (Supplementary Figs 8 and 9).
Figure 4
Figure 4. Ancestral landscape of SLE risk alleles.
Clustering by relative allele frequency yields three distinctive categories for SLE risk alleles: comparable frequencies across populations, increased frequencies in AA, and decreased frequencies in AA. The comparable frequency grouping contained the most risk alleles, of which, many were common alleles. This cluster had the smallest deviations from average admixture proportions, across the three cohorts. The increased frequencies in AA alleles exhibited moderate deviations towards greater AA-ancestral contribution. The largest deviations from average admixture were found within alleles exhibiting decreased frequencies in AA. These alleles were enriched for admixture deviations of increased CEU-ancestry. The patterns across relative allele frequencies reveal that ancestry-specific associations are largely not driven by monomorphic SNPs in other populations.
Figure 5
Figure 5. The non-additive effect of EA risk-allele genetic load on SLE risk.
The cumulative effect of EA SLE-risk alleles (cumulative hits) on an individual's risk of SLE is greater than if the individual SNPs were acting independently/additively. (a) The genetic load was computed as the sum of the number of EA risk variants from the Tier 1, 2 or 3 SNPs that met the region-specific stepwise modelling (see Online Methods). In the AA, HA and an independent set of 2,000 EA cases and 2,000 EA controls, the samples with the lowest 10% in risk-allele counts were identified and formed the baseline comparison group. Using a moving window of 10 in the allele count, the odds ratio for that window relative to the lowest 10% was computed and graphed. (b) The process was repeated for a weighted sum of the number of EA risk-allele variants. Here, the alleles are weighted by the natural logarithm of the odds ratio for that SNP’s association with SLE. The corresponding moving window for the weighted genetic load used a window size of 3. Supplementary Fig. 17 plots the natural logarithm of the odds ratio (instead of the odds ratio) of genetic load versus SLE risk.

References

    1. Danchenko N., Satia J. A. & Anthony M. S. Epidemiology of systemic lupus erythematosus: a comparison of worldwide disease burden. Lupus 15, 308–318 (2006). - PubMed
    1. International Consortium for Systemic Lupus Erythematosus Genetics (SLEGEN). et al. Genome-wide association scan in women with systemic lupus erythematosus identifies susceptibility variants in ITGAM, PXK, KIAA1542 and other loci. Nat. Genet. 40, 204–210 (2008). - PMC - PubMed
    1. Chung S. A. et al. Lupus nephritis susceptibility loci in women with systemic lupus erythematosus. J. Am. Soc. Nephrol. 25, 2859–2870 (2014). - PMC - PubMed
    1. Hom G. et al. Association of systemic lupus erythematosus with C8orf13-BLK and ITGAM–ITGAX. N. Engl. J. Med. 358, 900–909 (2008). - PubMed
    1. Rullo O. J. & Tsao B. P. Recent insights into the genetic basis of systemic lupus erythematosus. Ann. Rheum. Dis. 72, ii56–ii61 (2013). - PMC - PubMed

Publication types